

The Climate Leadership and Community Protection Act (Climate Act) integration analysis benefits and costs presentation was discussed at the October 14, 2021 Climate Action Council meeting (meeting recording available here). This post documents the proposed costs as presented.
I have written extensively on implementation of the CLCPA because I believe the ambitions for a zero-emissions economy outstrip available technology such that it will adversely affect reliability and affordability, will have worse impacts on the environment than the purported effects of climate change, and cannot measurably affect global warming when implemented. The opinions expressed in this post do not reflect the position of any of my previous employers or any other company I have been associated with, these comments are mine alone.
Background
The Climate Action Council is responsible for submitting the Scoping Plan that will outline a plan to implement strategies to meet the ambitious targets of the CLCPA. Of particular interest are the 2030 targets: reduce greenhouse gas emissions by 40% relative to the 1990 baseline by 2030 and 70% of the electrical energy is supposed to come from renewable resources. Starting in the fall of 2020 seven advisory panels developed recommended strategies to meet the targets that were presented to the Climate Action Council in the spring of 2021. Both the Council and the advisory panels are composed of political appointees chosen more for their direct involvement in the CLCPA transition than their expertise in the energy sector so the strategies proposed were more aspirational than practical.
Developing a plan to transform the energy sector of the State of New York is an enormous challenge so the New York State Energy Research and Development Authority (NYSERDA) and its consultants are providing technical support to translate the recommended strategies into specific policy options. The results of this integration analysis were presented to the Climate Action Council in two October meetings.
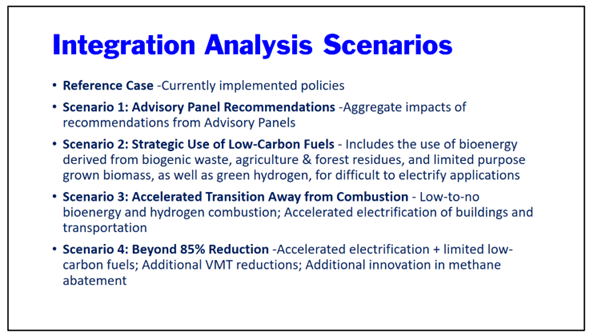
The integration analysis models the complete New York energy sector. It includes a reference case that projects how the economy and energy sector will evolve out to 2050 in the absence of any Climate Act policies or mandates. The following slide from the first integration analysis presentation lists the four mitigation scenarios that were developed to compare with the reference case. The first simply developed energy strategies that implemented the advisory panel recommendations but the results showed that even more stringent policies were needed because the 2030 targets were not met. The second mitigation scenario meets the 2030 targets by using low-carbon fuels to meet the critical need for dispatchable resources to keep the lights on. The third scenario placates the members of the Climate Action Council that naively demanded that no combustion is necessary despite the lack of a proven technology that can keep the lights on in the worst-case scenarios. Because some members of the Climate Action Council are dupes who don’t appreciate the technological hurdles and risks to reliability of the transition to zero-emissions using renewable energy and have no personal accountability for recommending policies that put New York at risk of catastrophic blackouts, there is a fourth mitigation scenario that looks at options for eliminating combustion as much as possible as soon as possible.
Costs
It is difficult to describe the cost calculations in any detail because the documentation consists of a power point presentation and an appendix with a few other slides. The description of the cost categories (discussed at 1:29:40 in the recording) in the following slide are all I had available to try to understand their estimates. For example, the description of electricity system states that it “Includes incremental capital and operating costs for electricity generation, transmission (including embedded system costs), distribution systems, and in-state hydrogen production costs”. It is impossible to evaluate what they mean by this generalization and the only breakdown of these costs is in a graph so resolving specific costs per category is only an approximation.

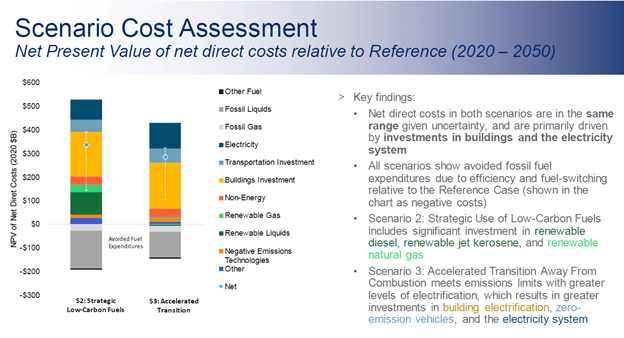
The scenario cost assessment (discussed at 1:31:26 in the recording) presents the net present value of net direct costs relative to the reference case over the years 2020 to 2050. Keep in mind that the strategies propose to electrify everything possible and that means that the electric needs of homes will be much higher than today. Also consider that much of the electric system is in need of upgrade and replacement even without the Climate Act and that will require substantially more revenue. In the example, electricity system costs include “incremental capital and operating costs” for distribution systems. There is no documentation available to see what they assumed in the reference case relative to the incremental additional costs.
The following slide compares the costs of Scenarios 2 and 3. Each bar on the left consists of the total net costs (values above zero) and the fuel savings (values below zero). The costs for each category are the incremental costs, for example the higher cost of a heat pump relative to the cost of a gas furnace. There is a blue diamond on the bar that represents the difference between the net costs and fuel savings and that is the value they list elsewhere for the costs. The brackets around the diamond are their uncertainty ranges. The key findings on the right are self-explanatory. Note that the major difference between the scenario 2 and scenario 3 costs is the expenditures necessary to produce the renewable fuels.
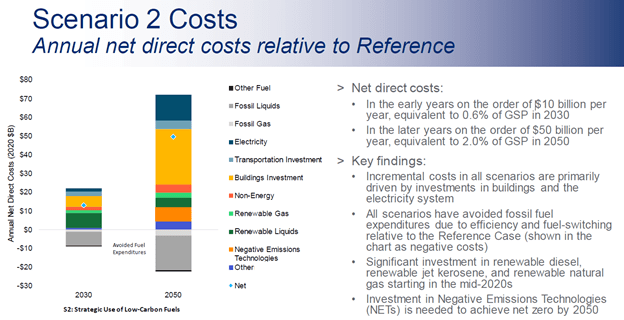
The next slide (discussed at 1:35:00 in the recording) lists the Scenario 2, strategic use of low-carbon fuels, annual net direct costs. In the early years the net direct costs are on the order of $10 billion per year, equivalent to 0.6% of GSP in 2030. In the later years the costs are on the order of $50 billion per year, equivalent to 2.0% of GSP in 2050. There is a similar slide for Scenario 3.
The next slide shown here (discussed at 1:37:25 in the recording) compares the annual direct system expenditure costs for scenarios 2 and 3 relative to current direct costs. The slide claims that the change in direct costs over time is “moderate” relative to total system expenditure in 2030 and 2050 because the system expenditure costs in 2030: are only 7.1 – 8.6% higher and in 2050 are only 24 – 27% higher. The presentation argues that the changes are primarily a re-orientation away from fossil fuel infrastructure to the zero-emissions infrastructure and that is the “larger part of the story”.

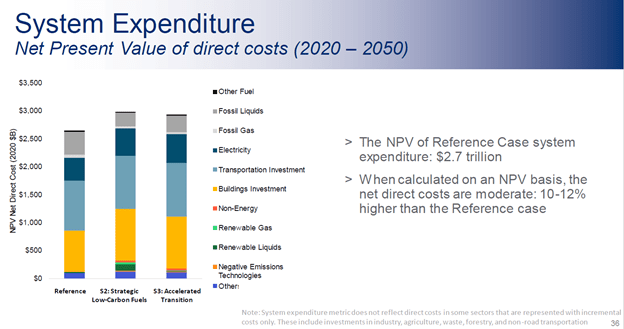
The final slide in the cost presentation (discussed at 1:38:58 in the recording) looks at the cumulative costs over the period 2020 to 2050. According to this analysis over the 30 years New York has to invest $2.7 trillion dollars to make sure that our houses are “keeping us warm” and that our vehicles can “move us from point A to point B” so we have to invest that money no matter what we do. The integration analysis claims that the net direct costs to invest in the zero-emissions transition is merely a 10-12% adder to the energy system costs.
Summary and Conclusion
There is insufficient information to evaluate whether the cost projections withstand scrutiny. In order to estimate the costs of technology that does not exist at scale there has to be a wide range of possibilities. Slide 87 in the October 14, 2021 presentation to the Climate Action Council discusses technical cost sensitivity. It notes that the “Integration Analysis includes sensitivity on cost for key demand side technologies, meant to represent an ‘innovation’ world view in which these technologies achieve significant price declines relative to reference case forecast”. As an example, they note that this “includes a 20% decrease in price for heat pumps, electric vehicles”. Given that electric car prices are getting more expensive because battery costs are increasing as lithium supplies are strained and many other jurisdictions are also implementing net-zero programs which will strain supplies further, I think that the 20% decrease in electric vehicle prices forecast is unlikely to verify. My impression is that these cost estimates are biased low as a result.
The total system expenditures over the period 2020 to 2050 predicted for the reference case are $2.7 trillion and the cost with the re-oriented Climate Act expenditures is roughly $3 trillion so the integration analysis claims that the implementation costs are only $340 billion. However other analysts predict higher costs for electrification. For example, the Energy & Environment Legal Institute (E&E Legal) state-by-state report on the capital cost associated with “electrification” for states and the nation. The report, and its accompanying data spreadsheet, gives a different picture for New York. It estimates that in order to convert the entire economy to use electricity as a fuel the estimated costs are $119 billion to go to 100% renewable electricity; $208 billion for the transportation sector; $320 billion for direct use infrastructure; $63 billion for households; $541 billion for commercial buildings; $181 billion for on-road vehicles; and $34 billion for off road vehicles, for a grand total of $1.465 trillion. The integration analysis projections are net relative to the difference between a zero-emissions alternative relative to existing technology but without their assumptions we cannot make a direct comparison with this analysis.
The integration analysis cost estimates for Scenarios 2 and 3 are roughly the same. Scenario 2 net present value costs over the period 2020 to 2050 are $340 billion. In the early years the net direct costs are on the order of $10 billion per year, equivalent to “only” 0.6% of GSP in 2030. What is not mentioned is that works out to $170 per month for a family of four. In the later years the costs are on the order of $50 billion per year, equivalent to 2.0% of GSP in 2050 and that works out to $850 per month for a family of four.
On October 26,2021, the AP-NORC Center and the Energy Policy Institute at the University of Chicago (EPIC) released the results of a survey that claimed that a majority of Americans regard climate change as a problem of “high importance”. It also included survey questions asking whether respondents would support, oppose, or neither support or oppose a law that imposed “a fee on carbon to combat climate change”. The survey question asked “If the law passed, it would increase the average amount your household pays each month for energy, including electricity, heating gas, and gasoline or diesel for your car by a total of X dollars per month” where respondents were randomly assigned a $1, $10, $20, $40, $75, or $100 cost increase. For a $1 per month increase, 45% would support, 30% would oppose, and 25% would neither support or oppose. For a $100 per month increase, 20% would support, 62% would oppose, and 18% would neither support or oppose. I can only conclude that $170 per month for a household in the early years of the Climate Act would be opposed by an even greater margin and that the $850 per month cost increase would be universally opposed.
The presentation discussion downplays the cost increases for the transition as simply a modest investment above our business-as-usual expenditures. However, when put in terms of personal reference the extraordinary costs are startling. Furthermore, the fact is that the business-as-usual expenditures have a proven track record providing safe and reliable energy. On the other hand, the zero-emissions technologies proposed are unproven. As far as I can tell, they may work most of the time but there are serious concerns whether they will work when needed the most. Until the technology catches up with the reality of a zero-emissions transition it is foolhardy to proceed as planned given these eye-watering costs.

2 thoughts on “Climate Leadership & Community Protection Act Integration Analysis Cost Estimates”