

New York Senate Bill S4264A, proposes to amend Article 19 of the Environmental Conservation Law by adding a new Title 13, Value of Pollution and Mitigation Program but the short title is the Climate & Community Investment Act (CCIA). This bill was proposed in the last legislative session but when the costs became apparent it stalled. Because the Climate Leadership and Community Protection Act (Climate Plan) did not devote State resources and personnel to implementation, advocates of the proposal have introduced it again. This post documents my first look at the proposed fee structure relative to the Integration Analysis projected emissions.
I have written extensively on implementation of the Climate Act because I believe the ambitions for a zero-emissions economy outstrip available technology such that it will adversely affect reliability and affordability, risk safety, affect lifestyles, will have worse impacts on the environment than the purported effects of climate change in New York, and cannot measurably affect global warming when implemented. The opinions expressed in this post do not reflect the position of any of my previous employers or any other company I have been associated with, these comments are mine alone.
Background
The Climate Action Council is responsible for preparing the Scoping Plan that will “achieve the State’s bold clean energy and climate agenda”. Starting in the fall of 2020 seven advisory panels developed recommended strategies to meet the targets that were presented to the Climate Action Council in the spring of 2021. Those recommendations were translated into specific policy options in an integration analysis by the New York State Energy Research and Development Authority (NYSERDA) and its consultants. An overview of the results of this integration analysis were presented to the Climate Action Council at the two October meetings and has since been updated. A draft scoping plan has been prepared and later in December the Council will vote on whether the plan can be released to the public to initiate the public comment period.
The underlying premise of the Climate Act was that transitioning the New York energy system to net-zero by 2050 was only a matter of political will. As a result, the targets were chosen without doing a detailed engineering analysis to determine how it might work, whether the technology is available for it to work, and how much it could cost. Now it is a law and, despite the fact that there is no funding mechanism, implementation plans are proceeding. This proposed legislation is supposed to provide some of the funding for implementation.
Last year I did a series of posts (summarized here) on the CCIA that covered many aspects of the law but I have not reviewed the current proposal relative to last year’s to determine if there have been many changes. This post only considers one aspect of the proposal the carbon pollution fee. In particular, I calculate the value of the fee based on the Integration Analysis scenario emission reduction trajectories.
CCIA Carbon Fee
The Climate and Communities Investment Authority will publish an annual fee for carbon dioxide equivalent emissions. Carbon dioxide equivalence is “a simple way to normalize all these greenhouse gases and other climate influences in standard units based on the radiative forcing of a unit of carbon dioxide over a specified timeframe”. In short, the fee applies to all of the regulated greenhouse gas emissions set to their CO2 equivalence value.
The authors of the law have drafted the calculation methodology to provide a dependable revenue stream and also to prod action by increasing the fee if the actual emissions reduction trajectory does not comport with their arbitrary target emission reduction trajectory. Anyone looking at New York greenhouse gas emissions is handicapped by the fact that the Climate Act emissions calculation methodology is inconsistent with everyone else and so complex and requires so much information that it is impossible for outsiders to calculate. The CCIA target trajectory is based on a 2018 baseline but that number is not available from the State. In addition, projecting the emissions reduction trajectory from the present out to 2050 is as complex a problem. Consequently, I was not able to provide any credible estimate of the expected fee structure last year. However data are now available for a look at the fees.
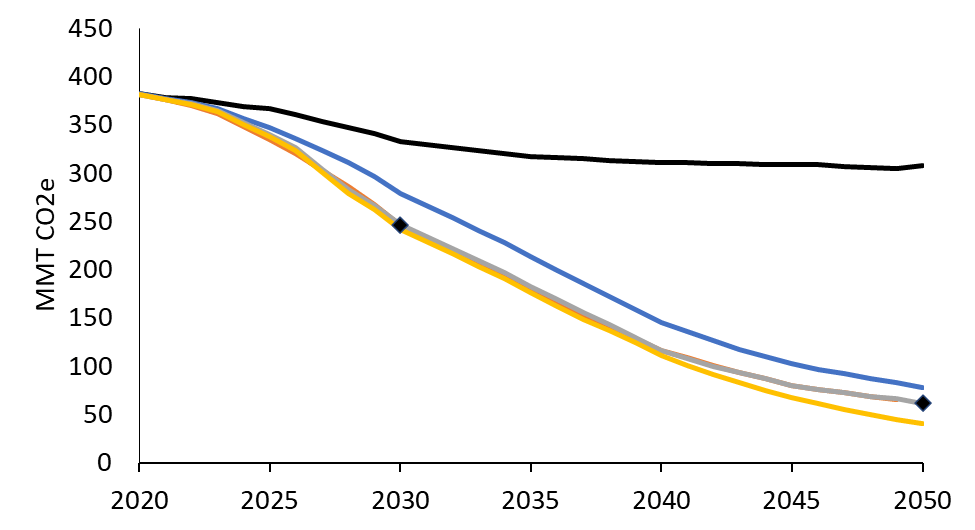
Since the legislation was drafted the Integration Analysis has generated the emissions reduction trajectory for a reference case and four scenarios. A spreadsheet entitled Integration Analysis – Key Drivers and Outputs (updated November 18, 2021)] provides most of the information needed to evaluate and estimate emissions. In the “Annual Emissions” tab the following figure and the data used to generate the figure are available and can be used to estimate the annual carbon fee.
Carbon Fee Annual Adjustment Calculation
The carbon fee includes an annual adjustment calculation that compares the environmental integrity metric to an arbitrary statewide greenhouse gas emissions trajectory. Presumably the idea is that if the observed emissions reductions are not happening fast enough then a larger fee will encourage faster reductions. The environmental integrity metric (EIM) calculation definition follows:
- 3041. (2) In two thousand twenty-four, and every year thereafter, the Commissioner shall, in consultation with the Department of Environmental Conservation:
(a) calculate the five-year environmental integrity metric, which shall equal a fraction, expressed as a percentage:
(i) the numerator of which is:
(A) the sum of the quantity of actual statewide greenhouse gas emissions, measured in short tons CO2e, in each of the preceding five years, minus
(B) the sum of the quantity of target statewide greenhouse gas emissions, measured in short tons CO2e, in each of the preceding five years, pursuant to subdivision four of this section; and
(ii) the denominator of which is the sum of the quantity of target statewide greenhouse gas emissions, measured in short tons CO2e, in each of the preceding five years, pursuant to subdivision four of this section; and
(b) calculate the cumulative environmental integrity metric, which shall equal a fraction, expressed as a percentage:
(i) the numerator of which is:
(A) the sum of the quantity of actual statewide greenhouse gas emissions, measured in short tons CO2e, in each of the preceding years that are after two thousand eighteen, minus
(B) the sum of the quantity of target statewide greenhouse gas emissions, measured in short tons CO2e, in each of the preceding years that are after two thousand eighteen, pursuant to subdivision four of this section; and
(ii) the denominator of which is the sum of the quantity of target statewide greenhouse gas emissions, measured in short tons CO2e, in each of the preceding years that are after two thousand eighteen, pursuant to subdivision four of this section;
The statewide greenhouse gas emissions trajectory is defined as follows:
-
- 3041. (4) For the purposes of calculating the five-year environmental integrity metric and the cumulative environmental integrity metric under subdivision two of this section, the authority shall refer to the following statewide greenhouse gas emissions targets:
(a) for the year two thousand twenty-one, eighty-five percent of two thousand eighteen emissions;
(b) for each year after two thousand twenty-one and before two thou sand twenty-seven, less than in the preceding year by four percent of the two thousand eighteen emissions; and
(c) for each year after two thousand twenty-six and before two thousand forty-two, less than in the preceding year by three percent of two thousand eighteen emissions; and
(d) for each year after two thousand forty-one, less than in the preceding year by two percent of two thousand eighteen emissions.
Carbon Fee Calculation
I spent a lot of trying to figure out how the annual adjustment was supposed to work. The fee starts at $55 in 2022. From 2023 to 2025 there is a five percent increase per year. It starts to get more complicated for the years 2026 to through 2031. There are limits for the five-year EIM relative to the observed five-year reductions. If the five-year EIM is less than -5% then the annual adjustment is 2%, between -5% and 5% the adjustment is 5%, if between 5% and 10% the adjustment is 7% and if it is over 10% the adjustment is 10%. In addition, a cost-of-living adjustment is added. The subsequent years incorporate an adjustment based on the cumulative EIM. If the cumulative EIM is less than -1% and the five-year EIM is less then 5% then the adjustment is 2%. If the cumulative EIM is greater than 3% or the five-year EIM is greater than 10% then the adjustment is 10%. The in between combinations are so complicated that I could not calculate the values. However, it turns out that based on my estimates that both the five-year EIM and the cumulative EIM exceed the 10% thresholds in 2026 and every year thereafter.
The EIM calculates values using the 2020 total New York greenhouse gas emissions as a baseline. I assumed that value would equal the Climate Act total emissions and that is a problem. At this time the only annual emissions available to the general public that incorporate all the unique New York adjustments are the 1990 Climate Act baseline. I am hopeful that 2018 through 2020 Climate Act emissions totals will all be released by the end of the year when the 2020 values are supposed to be released.
In order to estimate how the CCIA emissions reduction trajectory compares to the Climate Act integration analysis emission reduction trajectories I considered a couple of examples that calculated the annual EIM adjustment and applied it to the CCIA fees starting in 2026 for Integration Analysis Scenarios 2-4. The two examples tried to bracket the possible emissions trajectory. The first assumed that the emissions in 2018 equaled the 1990 Climate Act baseline. The second assumed that the emissions in 2018 equaled the 2020 integration analysis emissions.
There really isn’t much difference between the examples. The CCIA emissions trajectory calls for more reductions earlier than any of the scenarios in either example. The Integration Analysis scenarios are tuned to match the 2030 emission target and are on the order of 2% lower. On the other hand, the CCIA emissions in 2030 are 20% less than the emissions target. Consequently, the CCIA emission fee methodology ends up using the highest annual adjustment each year.
Discussion
I am not impressed by the numeracy of the authors of the CCIA. The description of the emission fee conditions is unclear and I think there is an error relative to what I think they wanted to do. As far as I can tell there have been no substantive revisions to the text since it was first drafted last year. At the end of last year, DEC promulgated Part 496 that established the 2030 and 2050 emission limits for the state. As far as I can tell the methodology was not linked to the interim target so that the emissions trajectory calls for more reductions sooner. Furthermore, there were no estimates of emissions reductions expected as a result of the Climate Act implementation strategies. As a result, the emission fee adjustments are at the highest level throughout the period.
In 2034 and every year after, the CCIA emission fee exceeds the New York State value of carbon for all the scenarios in both examples but this analysis did not include a cost-of-living adjustment so the crossover point will be even sooner. The value of carbon is the avoided negative societal costs due to climate change caused by the reduction of one ton of CO2. When the emission fee exceeds that value, it means that the cost charged exceed the expected benefits. In a rational world the CCIA fee would be capped at the value of carbon value.
This work accepted the Integration Analysis emission estimates for 2020 through 2050 without modification. Note however, that the 2020 “modeled year reflecting historical trends” does not comport well with the observations. It is unfortunate that the Integration Analysis – Key Drivers and Outputs spreadsheet did not include the electric supply emissions with the capacity and generation results tables because we would be able to easily verify whether the E3 modeled year adequately represents 2020. What we can say is that the New York Independent System Operator Gold Book for 2021 stated that the gas and fuel oil generation in 2020 was 56,425 GWh and the Integration Analysis spreadsheet modeled value was 70,745 GWh, 25% higher. Consequently, the assumption that the Integration Analysis emissions were a reasonable estimate of future emissions seems pretty weak.
Conclusion
The Integration Analysis includes estimates of annual emissions that can be used to estimate how the CCIA fee will evolve over time. Based on the data available it appears that the CCIA emissions trajectory calculation requires early reductions greater than that necessary to meet the 2030 Climate Act target. As a result, all years after 2025 are adjusted upwards by 10% per year. It is not clear whether this is a feature or a bug in the minds of the CCIA authors.
I will update this analysis when the 2018 through 2020 emissions data are released.

One thought on “Climate & Community Investment Act Is Back”