

The Climate Leadership and Community Protection Act (Climate Act) establishes a “Net Zero” target by 2050. The Draft Scoping Plan defines how to “achieve the State’s bold clean energy and climate agenda” and claims that there are significant direct and indirect benefits, including improved public health. One Scoping Plan policy is active transportation that claims that if physical activity is built into daily routines by forcing people to walk or bicycle rather than drive, then emissions will be reduced and there will be health benefits too. This post looks at the claim that there will be $39.5 billion in health co-benefits for active transportation.
I have written extensively on implementation of the Climate Act because I believe the ambitions for a zero-emissions economy outstrip available technology such that it will adversely affect reliability and affordability, risk safety, affect lifestyles, will have worse impacts on the environment than the purported effects of climate change in New York, and cannot measurably affect global warming when implemented. The opinions expressed in this post do not reflect the position of any of my previous employers or any other company I have been associated with, these comments are mine alone.
Background
The Climate Action Council is responsible for preparing the Scoping Plan that will “achieve the State’s bold clean energy and climate agenda”. Starting in the fall of 2020 seven advisory panels developed recommended strategies to meet the targets that were presented to the Climate Action Council in the spring of 2021. Those recommendations were translated into specific policy options in an integration analysis by the New York State Energy Research and Development Authority (NYSERDA) and its consultants. An overview of the results of this integration analysis were presented to the Climate Action Council at two October meetings and has since been updated. This analysis forms the basis of the draft Scoping Plan that is supposed to be released to the public at the end of the year.
The Scoping Plan estimates societal health benefits and avoided economic damages caused by climate change as a result of GHG emission reductions. Improvements in air quality, increased active transportation, and energy efficiency interventions in low- and middle-income homes generates health benefits ranging from approximately $165 billion to $170 billion. Reduced GHG emissions avoids the economic impacts of damages caused by climate change equaling approximately $235 to $250 billion. The combined benefits range from approximately $400 billion to $420 billion. This post addresses the alleged benefits from increased active transportation.
In the following sections I provide my indented and italicized comments for documentation in Scoping Plan Appendix G: Integration Analysis Technical Supplement.
Appendix G: Section II, Page 24: 1.4 Increased Active Transportation.
The public health benefits of increased active transportation were estimated using the Integrated Transport and Health Impact Model (ITHIM).[1] The analysis drew on modeling conducted for the New York State Clean Transportation Roadmap,[2] which estimated the increase in walking and biking trips resulting from a decrease in VMT.
The documentation consists of a Power Point presentation to the Transportation Advisory Panel. The presentation lacks important information. The scenarios in the presentation are not the scenarios in the Scoping Plan. There is no reference describing which simulated policies are included in the Scoping Plan scenarios. The presentation does not list the expected decrease in vehicle miles traveled (VMT).
ITHIM uses U.S.-level data from the Global Burden of Disease study[1] and other published literature to estimate the change in the relative risk of premature mortality due to increased physical activity. ITHIM also calculates the potential increase in pedestrian mortality from vehicle collisions, and it presents the net change in mortality for a given change in walking and biking activity.
ITHIM calculates the health impacts of walking and bicycling short distances usually traveled by car or driving low-emission automobiles. Without any documentation it is not clear if ITHIM includes pedestrian mortality in the winter.
In this analysis, the ITHIM model was customized with NYS-specific data on population, baseline mortality rates, and VMT, from the same data sources discussed above for the ambient air quality analysis, as well as baseline walking and biking activity taken from the Federal Highway Administration’s National Household Travel Survey.[1]
In another analysis that used ITHIM: “We utilized data from local, state, and federal sources to fulfill the 14 ITHIM calibration items, which include disease burdens, travel habits, physical activity participation, air pollution levels, and traffic injuries and fatalities.” It is not clear how Scoping Plan analysis handled all 14 calibration items.
The analysis valued the change in mortality using the value of a statistical life from COBRA to be consistent with the ambient air quality analysis.
Comprehensive documentation would explain how the numbers differ and offer more of a rationale than “consistency”.
The analysis used NYS-specific data where possible alongside the default equations within ITHIM to estimate the net change in mortality from increased walking and biking. These equations include default parameters based on national-level data to represent the change in relative risk of mortality from change in physical activity.
Again an explanation why national-level data are appropriate to use for New York is needed.
This analysis was conducted at the state level, rather than modeling changes in walking and biking activity due to changes in VMT within counties or individual communities. For this reason, the results of this analysis should be considered a first-order approximation of the benefits of increased active transportation.
This is a huge issue with this analysis. The plain reading of this is that they took the statewide change in VMT, assumed that some portion of this would be replaced by walking and biking, and then took health care credit for the change. However, smart planning changes to walking and biking is a specific community outcome. In my opinion, the actual number of places where this strategy could actually encourage more walking and bicycling to work is very small.
Appendix G: Section II, Page 37: 2.3 Health Benefits of Increased Active Transportation
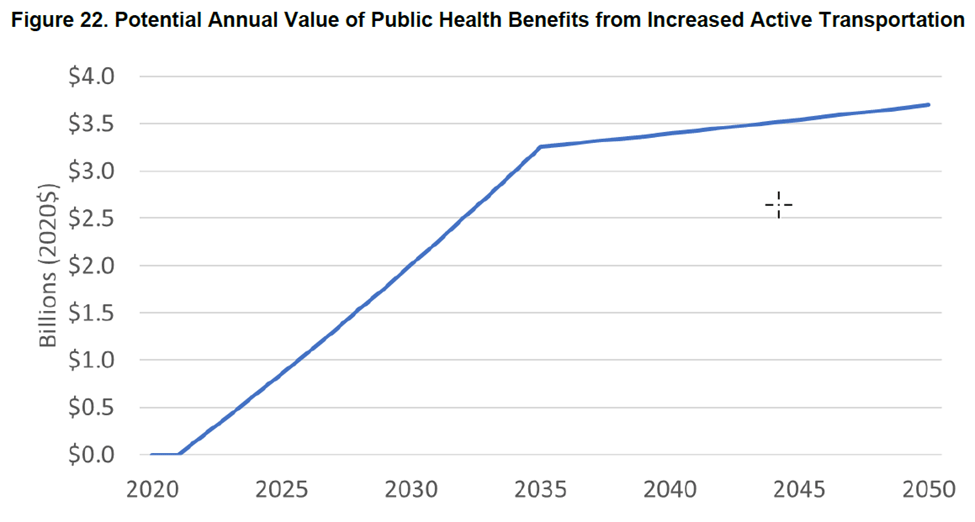
The potential value of the net reduction in the number of deaths, including the decrease in deaths from increased physical activity and the increase in deaths from traffic collisions, is estimated to be a NPV of $39.5 billion (2020 to 2050). As presented in Figure 22, the values increase over the years as walking and cycling increases with the introduction of infrastructure and other measures to encourage the use of these modes. Note that the projected decrease in premature deaths from physical activity far outweighs the potential increase in deaths from traffic collisions. Active transportation benefits are the same for the Low-Carbon Fuels and Accelerated Transition scenarios.
[1] U.S. Federal Highway Administration. 2021. National Household Travel Survey. https://nhts.ornl.gov/
[1] Institute for Health Metrics and Evaluation (IHME). Global Burden of Disease (GBD). Seattle, WA: Institute for Health Metrics, University of Washington; 2015. http://www.healthdata.org/gbd
[1] Available at: http://cal-ithim.org/ithim/#Home
[2] Cadmus. New York Clean Transportation Roadmap Preliminary Results: GHGs and Energy. Presentation to the Transportation Advisory Panel to the New York State Climate Action Council. April 9, 2021. https://climate.ny.gov/Advisory-Panel/Meetings-and-Materials.
New York Clean Transportation Roadmap Preliminary Results: GHGs and Energy
On April 9, 2021 Cadmus presented preliminary results for the New York Clean Transportation Roadmap. As noted above this represents the documentation for this policy. I have not found the final report and the Scoping Plan offers no other reference. The documentation consists of a slide presentation and lacks important information. For example, the presentation includes the following slide that describes a couple of simulated policies that could represent the mechanism to increase physical activity. For example, in the Smart Growth policy, the baseline states: “2050 Reference Case value for fraction of HH in mixed-use neighborhoods ranges from 4 to 74% across MSAs”. I don’t know what the HH acronym means. On the other hand, the Complete Streets policy appears to directly address increased walking and biking to work.

In order to evaluate the claims, I wondered how many employees are expected to start using active transportation to get to work. Demographics of the Civilian Labor Force for New York State and the New York State Labor Market Regions lists 2015 – 2019 American Community Survey (ACS) five-year estimates of employed people for ten regions. Note that the Complete Streets mitigation scenario states that the “Start value for % walking or biking to work ranges from 0.7% to 12.1% across counties”. I believe that the percentage of people walking or biking to work is highest in New York City which is one of the regions in the ACS employee estimates. This is an example of a problem with the poor documentation. Assuming that the New York City region has 12.1% employees who walk or bike to work and that all the other regions have 0.7% who do so, then we can calculate the state-wide percentage. Using those assumptions, the state-wide percentage is 5.6% which exceeds the 2050 goal for Mitigation Scenario 1. That makes no sense and without adequate documentation it is impossible to reconcile this discrepancy.
There is another issue with these estimates. There is a spreadsheet that lists the data in the health benefit figures. In the following table the benefits column are values in the Scoping Plan documentation. I interpret the Complete Streets policy to increase the percentage of workers who walk, bike or take an electronic bike or scooter to work by either 5% or 10% by 2050. In the table I divide the benefits claimed by the number of commuters. Complete documentation would show how many employees switch per year and then it would be possible to estimate the health benefits per active commuter. Even without that differentiation the numbers per commuter seem high. More importantly, are the health benefits applied for each commuter every year until 2050?
Figure 14 Data Potential Annual Value of Public Health Benefits from Increased Active Transportation for 9,498,320 employees in Demographics of the Civilian Labor Force
| Actively Commuting | |||
| 5% | 10% | ||
| 474,916 | 949,832 | ||
| Benefits | Benefits per Commuter | ||
| Year | (millions, 2020$) | 5% | 10% |
| 2020 | $0 | $0 | $0 |
| 2021 | $0 | $0 | $0 |
| 2022 | $208 | $439 | $219 |
| 2023 | $420 | $885 | $442 |
| 2024 | $636 | $1,338 | $669 |
| 2025 | $855 | $1,800 | $900 |
| 2026 | $1,077 | $2,269 | $1,134 |
| 2027 | $1,304 | $2,746 | $1,373 |
| 2028 | $1,534 | $3,230 | $1,615 |
| 2029 | $1,768 | $3,723 | $1,862 |
| 2030 | $2,006 | $4,224 | $2,112 |
| 2031 | $2,248 | $4,734 | $2,367 |
| 2032 | $2,494 | $5,251 | $2,626 |
| 2033 | $2,744 | $5,778 | $2,889 |
| 2034 | $2,998 | $6,312 | $3,156 |
| 2035 | $3,256 | $6,856 | $3,428 |
| 2036 | $3,284 | $6,914 | $3,457 |
| 2037 | $3,312 | $6,973 | $3,486 |
| 2038 | $3,340 | $7,032 | $3,516 |
| 2039 | $3,368 | $7,092 | $3,546 |
| 2040 | $3,397 | $7,153 | $3,576 |
| 2041 | $3,426 | $7,213 | $3,607 |
| 2042 | $3,455 | $7,275 | $3,637 |
| 2043 | $3,484 | $7,337 | $3,668 |
| 2044 | $3,514 | $7,399 | $3,700 |
| 2045 | $3,544 | $7,462 | $3,731 |
| 2046 | $3,574 | $7,526 | $3,763 |
| 2047 | $3,604 | $7,590 | $3,795 |
| 2048 | $3,635 | $7,654 | $3,827 |
| 2049 | $3,666 | $7,720 | $3,860 |
| 2050 | $3,697 | $7,785 | $3,893 |
Conclusion
The Scoping Plan claims that “the potential value of the net reduction in the number of deaths, including the decrease in deaths from increased physical activity and the increase in deaths from traffic collisions, is estimated to be a net present value of $39.5 billion (2020 to 2050)”. My first impression of this value was that it was too high. While the lack of documentation makes it difficult to decipher exactly how the number was derived, I see nothing to disprove that impression.
The Scoping Plan admits that “the results of this analysis should be considered a first-order approximation of the benefits of increased active transportation”. In this instance “first-order approximation” means wild guess that they threw up hoping it would stick. While there are undoubtedly some benefits for active transportation, the Scoping Plan claim for $39.5 billion is unsupportable.
