

The Climate Leadership and Community Protection Act (Climate Act) includes a commitment for environmental justice goals. I recently described the comments I submitted on the Climate Justice Working Group (CJWG) draft criteria to determine which communities should be targeted for benefits from Climate Act investments associated with these environmental justice goals. This post describes the energy affordability indicator.
The Climate Act establishes a “Net Zero” target (85% reduction and 15% offset of emissions) by 2050. I have written extensively on implementation of the Climate Act. Everyone wants to do right by the environment to the extent that efforts will make a positive impact at an affordable level. Based on my analysis of the Climate Act I don’t think that will be the case. I believe that the ambitions for a zero-emissions economy outstrip available renewable technology such that the transition to an electric system relying on wind and solar will do more harm than good. The opinions expressed in this post do not reflect the position of any of my previous employers or any other company I have been associated with, these comments are mine alone.
Climate Act Background
The Climate Action Council is responsible for preparing the Scoping Plan that will “achieve the State’s bold clean energy and climate agenda” in the Climate Act. They were assisted by Advisory Panels who developed and presented strategies to the meet the goals to the Council. Those strategies were used to develop the integration analysis prepared by the New York State Energy Research and Development Authority (NYSERDA) and its consultants that quantified the impact of the strategies. That material was used to write Draft Scoping Plan that was released for public comment at the end of 2021. The Climate Action Council will revise the Draft Scoping Plan based on comments and other expert input in 2022 with the goal to finalize the Scoping Plan by the end of the year.
The article describing my comments covered the background of the CJWG process to develop criteria to identify Disadvantaged Communities and mentioned that there is a fact sheet on the process. For the purposes of this article, the focus is on one of the 45 indicators – “energy affordability”. In the comments I submitted on the process I made a recommendation to address the affordability concern. In particular I explained that I believe that energy poverty is the issue that I think will most likely occur and will adversely affect the low- and middle- income people in Disadvantaged Communities and across the state. I noted that I was concerned that the emphasis on communities would result in those citizens who suffer from energy poverty but don’t happen to live in a Disadvantaged Community getting left behind. I recommended that the weighting for energy poverty should be increased to address this concern. In this analysis I reviewed the data used for the energy affordability indicator to try to quantify the effect of the CJWG approach.
CJWG Energy Affordability
The Technical Documentation for the Disadvantaged Community Criteria document includes the following description of the Energy Affordability Indicator:
Metric Definition: Average energy costs as percentage of income
Data Source: DOE Low-Income Energy Affordability Data (LEAD) Tool (U.S. Census Bureau’s American Community Survey 2018 Public Use Microdata Samples)
Calculation Method: DOE used census energy expenditure data, housing unit type data, household income data, and number of people in the household, to model the average energy burden by tract.
Rationale for Inclusion: Energy affordability or energy burden is an indicator that is highly actionable and addressable by the Climate Act. The NY REV Energy Affordability Policy intends to limit energy costs to no more than 6% of income as per the 2016 order from the PSC, which plans for bill assistance, energy efficiency, and access to clean energy resources to decrease low-income energy costs.
High energy burden leads to stress, depression, hot or cold home temperatures, and associated health risks including asthma. This metric is also a proxy for type and age of home, which could impact how expensive it is to heat or cool due to materials or inefficiencies.
Potential Limitations and Future Improvements: The US DOE’s estimation approach does have some margin of error that they are looking to improve upon by using more measured values in future iterations.
References:
https://www.energy.gov/eere/slsc/maps/lead-tool
Ma, Ookie, Krystal Laymon, Megan Day, Ricardo Oliveira, Jon Weers, and Aaron Vimont. 2019. Low-Income Energy Affordability Data (LEAD) Tool Methodology. Golden, CO: National Renewable Energy Laboratory. NREL/TP-6A20-74249. https://www.nrel.gov/docs/fy19osti/74249.pdf.
2021 ORDER ADOPTING ENERGY AFFORDABILITY POLICY MODIFICATIONS AND DIRECTING UTILITY FILINGS: https://documents.dps.ny.gov/public/Common/ViewDoc.aspx?DocRefId={1CFD4CE2-AB87-4A8C-B56B-F123366B1520}
2021 Staff Report On New York State Energy Affordability Policy https://documents.dps.ny.gov/public/Common/ViewDoc.aspx?DocRefId={C3F867FC-27B0-49FB-AD29-7EED80C8F69E}
Energy Affordability Data
The CJWG DAC criteria documentation noted that “The NY REV Energy Affordability Policy intends to limit energy costs to no more than 6% of income as per the 2016 order from the PSC, which plans for bill assistance, energy efficiency, and access to clean energy resources to decrease low-income energy costs.” I have not been able to find any documentation that explains where New York stands relative to this goal. In my opinion, someone, somewhere should summarize the number of people who are paying more than 6% of their income on energy costs. I thought that the data used for this metric might be able to shed some light on this metric as well as address my specific concerns about the CJWG criteria for Disadvantaged Communities.
The Low-Income Energy Affordability Data (LEAD) Tool was developed by the Better Building’s Clean Energy for Low Income Communities Accelerator (CELICA) to help state and local partners understand housing and energy characteristics for the low- and moderate-income (LMI) communities they serve. The tool provides data, maps, and graphs. Data for the LEAD Tool comes from the U.S. Census Bureau’s American Community Survey 2018 Public Use Microdata Samples. The energy data is for housing only.
In order to use LEAD the first step is to select an Income Model from the following options:
- Area Median Income (AMI) – The Area Median Income is the midpoint of a region’s income distribution – half of families in a region earn more than the median and half earn less than the median.
- Federal Poverty Level (FPL) – The Federal Poverty Level is a measure of income used by the U.S. government to determine who is eligible for subsidies, programs, and benefits.
- State Median Income (SMI) – The State Median Income is the midpoint of a region’s income distribution – half of families in a region earn more than the median and half earn less than the median.
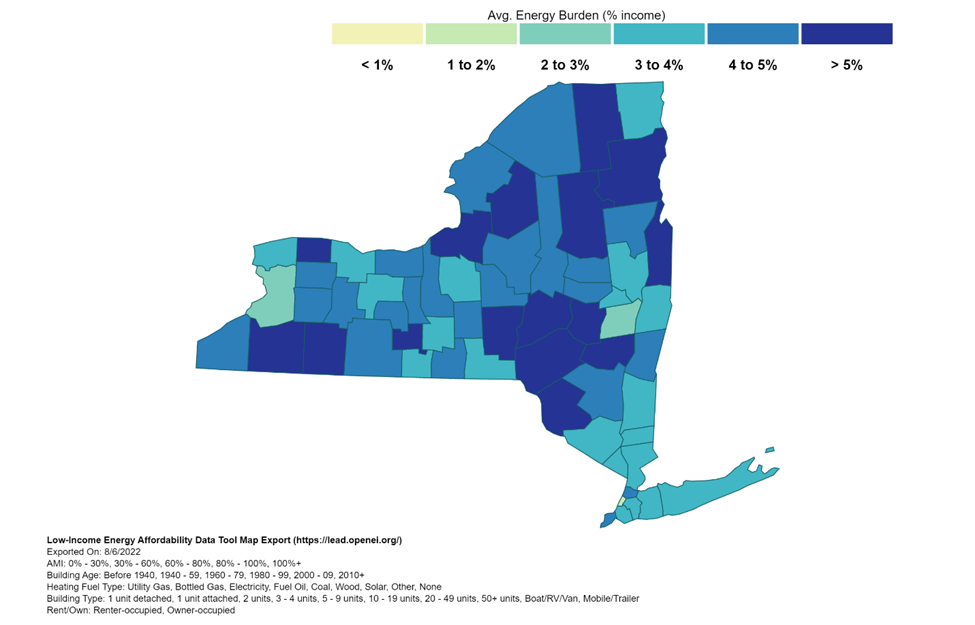
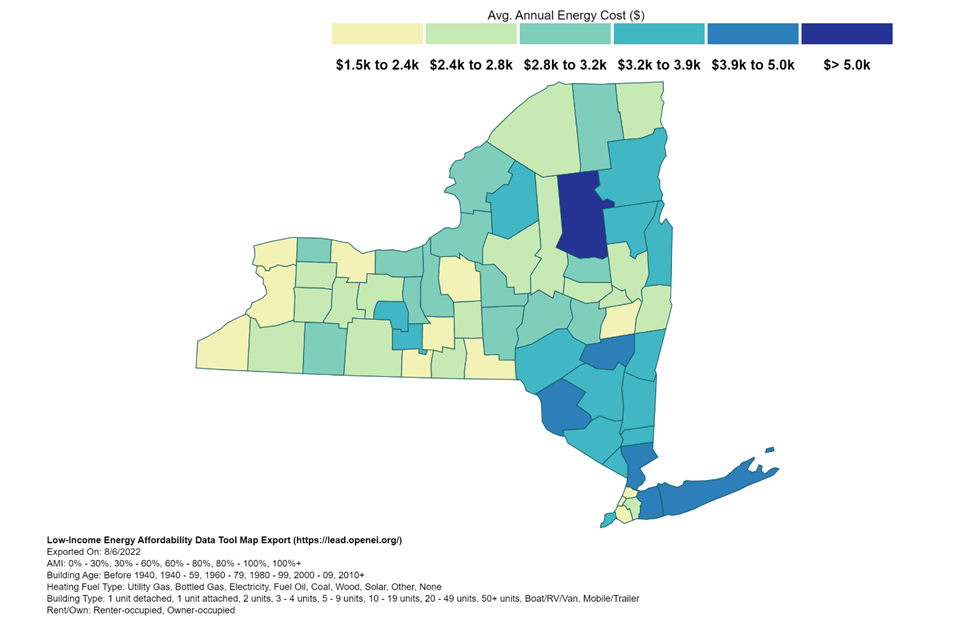
The following figures show the annual energy burden and energy cost as a function of the AML. I compared the output for the different income models and found that there was no significant difference in the results for the New York counties output. The model generates New York State’s County, city and census tract data for average energy burden, average annual energy cost, and housing counts.
LEAD Tool New York Map Average Energy Burden (% income) using Area Median Income
LEAD Tool New York Map Average Annual Energy Cost ($) using Area Median Income
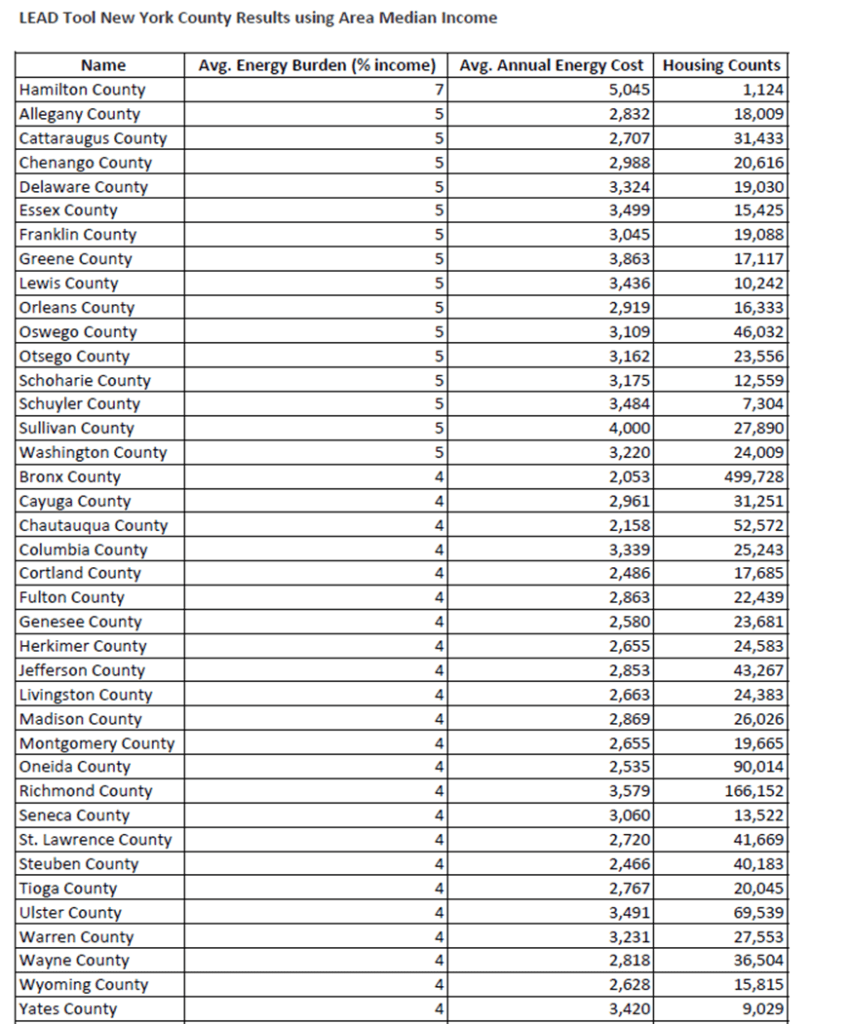
The county specific results for the whole state are available here and the results for those counties that have an average energy burden of 4% or greater are listed below.
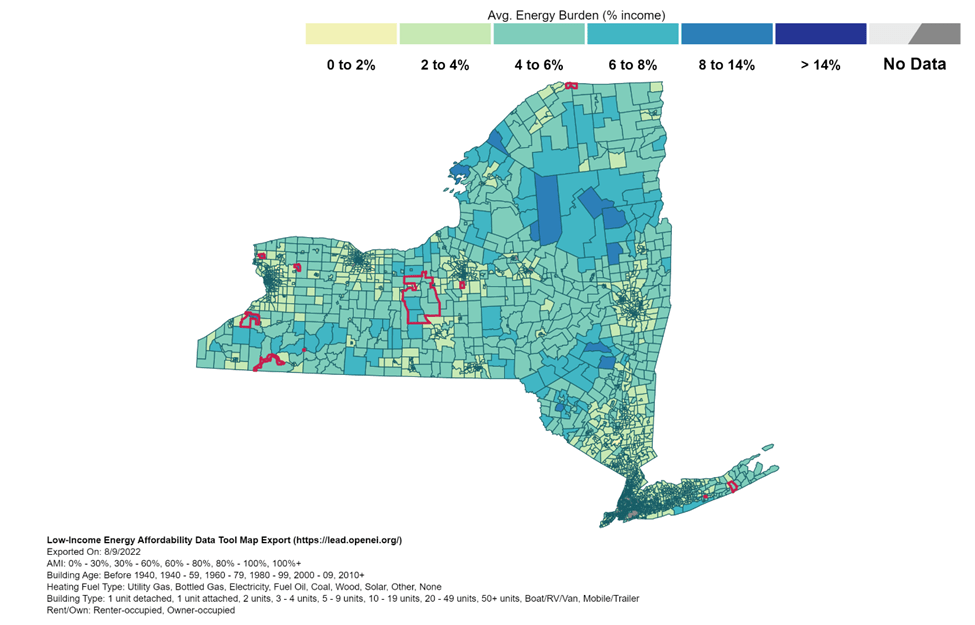
The CJWG DAC criteria are based on census tract data. The census tract map is shown below and specific results for the whole state are available here. The map shows that there are many areas of the state that exceed the 6% target, albeit the average energy burden per census tract does not tell us how many people actually have energy burdens that exceed the target. Note that many of the census tracts in the Adirondack and Catskill Parks exceed the 6% threshold.
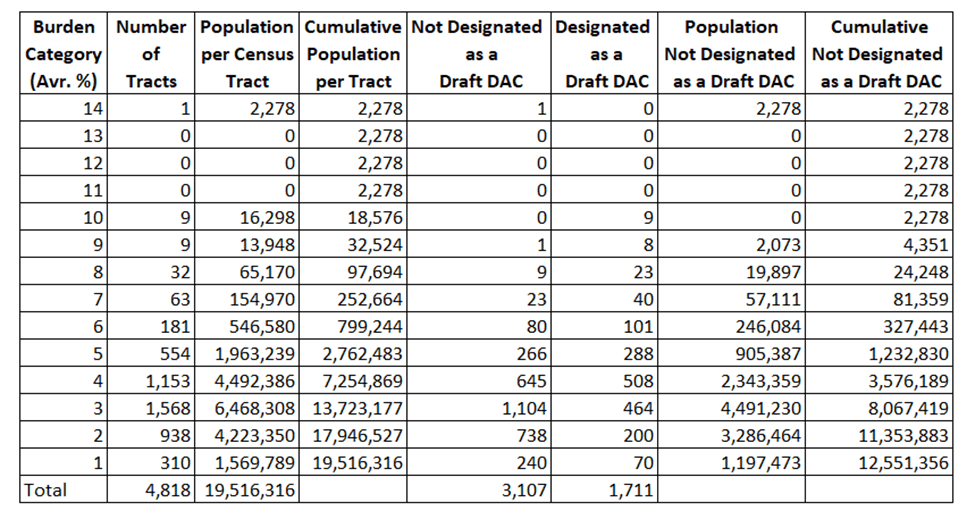
The breakdown of the average energy burden by census tract table below provides more information. There are 4,818 census tracts in the LEAD Tool output that have average energy burden estimates. (There is not an exact one for one matchup between the census tracts available in the LEAD Tool and the CJWG DAC Criteria technical support documentation but the differences are small and I believe that they are inconsequential.) The distribution of the average energy burden shows that most census tracts have a burden less than the 6% target. Note, however, that the even if the average burden for a tract is in the 1% category there still will be some people that could have an energy burden greater than 6%. The cumulative population for the energy burden categories six and greater is nearly 800,000 people. The distribution of the census tracts that are designated as Draft Disadvantaged Communities show that the energy affordability criterion is not a prime driver of DAC classification. For census tracts with energy affordability classifications greater than or equal to six, over 114 (38%) of the tracts are not designated as draft DAC and the population in those census tracts is 327,443.
Average Energy Burden by Census Tract Population Distribution
If the technical support documentation had included the calculation formula, I could have analyzed the possible reasons why some census tracts were designated and why other similar tracts were not. This would be particularly interesting relative to the New York City vs. the rest of the state classifications.
Conclusion
I was hopeful that the LEAD Tool used to generate the CJWG energy affordability indicator would provide enough information to calculate the status of the state relative to the NY REV Energy Affordability Policy target of 6%. Disappointingly the LEAD Tool does not provide the number of individuals so I was unable to calculate the status of the State relative to this metric.
In my comments on the Draft Disadvantaged Community Criteria, I argued that energy affordability should be an environmental justice priority in the future because I expect that energy costs will go up in the future which will affect low- and middle-income residents disproportionally. I recommended that the weighting scheme be changed to put more of an emphasis on that criterion. These results estimate the potential number of people adversely affected because they are excluded from a disadvantaged community. Using a first-order approximation of the distribution of energy affordability relative to the mean I guess that upwards of a million people could be in energy poverty outside of the disadvantaged communities. As far as I can tell those individuals are more likely to reside in rural areas.
