

The final version of the important New York Independent System Operator (NYISO) 2021-2040 System & Resource Outlook that addresses New York’s Climate Leadership and Community Protection Act (Climate Act) was released on September 22, 2022. This post compares the projections for resources needed to meet the Climate Act targets in this report and the Draft Scoping Plan.
Everyone wants to do right by the environment to the extent that they can afford to and not be unduly burdened by the effects of environmental policies. I submitted comments on the Climate Act implementation plan and have written extensively on New York’s net-zero transition because I believe the ambitions for a zero-emissions economy embodied in the Climate Act outstrip available renewable technology such that this supposed cure will do more harm than good. The opinions expressed in this post do not reflect the position of any of my previous employers or any other company I have been associated with, these comments are mine alone.
Background
The implementation for the New York’s Climate Act “Net Zero” target (85% reduction and 15% offset of emissions) by 2050 is underway. The Climate Action Council has been working to develop plans to implement the Climate Act. Over the summer of 2021 the New York State Energy Research & Development Authority (NYSERDA) and its consultant Energy + Environmental Economics (E3) prepared an Integration Analysis to “estimate the economy-wide benefits, costs, and GHG emissions reductions associated with pathways that achieve the Climate Act GHG emission limits and carbon neutrality goal”. Integration Analysis implementation strategies were incorporated into the Draft Scoping Plan when it was released at the end of 2021. Since the end of the public comment period in early July 2022 the Climate Action Council has been addressing the comments received as part of the development of the Final Scoping Plan that is supposed to provide a guide for the net-zero transition.
I have previously written that the Climate Action Council has not confronted reliability issues raised by New York agencies responsible for keeping the lights on. The first post (New York Climate Act: Is Anyone Listening to the Experts?) described the NYISO 2021-2030 Comprehensive Reliability Plan (CRP) report (appendices) released late last year and the difficulties raised in the report are large. The second post (New York Climate Act: What the Experts are Saying Now) highlighted results shown in a draft presentation for the 2021-2040 System & Resource Outlook that all but admitted meeting the net-zero goals of the Climate Act are impossible on the mandated schedule. Recently I wrote about the “For discussion purposes only” draft of the 2021-2040 System & Resource Outlook report described in the previous article and the concerns raised. It is amazing to me that these issues continue to be ignored.
Description of Resource Outlook and Draft Scoping Plan Mitigation Scenarios
This section compares two alternate approaches to meeting the Climate Act net-zero transition requirements.
The NYISO Resource Outlook report includes two scenarios that “reflect full achievement of the Climate Act targets”.
Outlook Scenario 1 – Utilizes industry data and NYISO load forecasts, representing a future with high demand (57,144 MW winter peak and 208,679 GWh energy demand in 2040) and assumes less restrictions in renewable generation buildout options.
Outlook Scenario 2 – Utilizes various assumptions consistent with the Climate Action Council Integration Analysis and represents a future with a moderate peak but a higher overall energy demand (42,301 MW winter peak and 235,731 GWh energy demand in 2040).
The Resource Outlook describes the scenarios:
In both Policy Case scenarios, a significant amount of land-based wind capacity was built by 2040. The model selected land-based wind due to its assumed capital cost, energy output, and capacity ratings. In both scenarios, land-based wind capacity builds to the assumed capacity build limits imposed (~16 GW).
In both scenarios, a significant amount of capacity from renewable generation and dispatchable emission free resources (DEFRs) is projected by 2040, with the most installation forecasted in the last five years, to help offset the projected fossil-fueled generation retirements. Dispatchable emission free resources are a proxy generator type assumed for generation expansion in the Policy Case to represent a yet unavailable future technology that would be dispatchable and produces emissions-free energy (e.g., hydrogen, RNG, nuclear, other long-term season storage, etc.). As noted above, all existing fossil-fueled generation (~26 GW) was modeled as retired by 2040 due to the CLCPA requirement of a zero emissions grid by 2040. In addition, in Scenario 2 the age-based retirement assumption captured the retirement of 12 GW, nearly half the fossil fleet. The models expanded to approximately 111 GW of total capacity for Scenario 1 and 124 GW of total capacity for Scenario 2, inclusive of NYCA generators, BTM-PV, and qualifying imports from Hydro Québec. This level of total installed capacity would be needed in 2040 to satisfy the state policy, energy, and resource adequacy constraints for Scenario 1 and Scenario 2, respectively. Of this total, approximately 85 GW to 100 GW represent generation expansion for Scenario 1 and Scenario 2, respectively, beyond the 9.5 GW planned through state contracts.25 For comparison, the Contract Case has approximately 51 GW of total installed capacity by 2040.
In general, resources take years from development to deployment. By year 2030, roughly seven years from the publication of this report, an estimated 20 GW of additional renewable generation needs to be in-service to support the energy policy target of 100% zero-emission generation by 2040. For reference, 12.9 GW of new generation has been developed since wholesale electricity markets began more than 20 years ago in 1999. Over the past five years, 2.6 GW of renewable and fossil-fueled generators came on-line while 4.8 GW of generation deactivated26. This Outlook demonstrates the need for an unprecedented pace of project deployment, which will require significant labor and materials available for New York over a long period of time.
Offshore wind capacity buildout remains near the 9 GW policy objective through 2040 for both scenarios. This outcome results primarily from the assumed high capital cost of offshore wind technology in the model, which was the highest cost renewable technology available. Additionally, considering the declining marginal capacity reliability value curves assumed, offshore wind at the levels modeled is an inefficient resource to meet peak capacity needs and Locational Capacity Requirements because the capacity contribution of intermittent renewable resources declines as more are added to the system.
Overall, results for Scenario 2 showed a higher level of renewable buildout than Scenario 1, most notably in utility-scale solar capacity, and had a different projection of the capacity expansion throughout the study period as compared to Scenario 1 for all generator types. The main factors for these differences are the assumptions for load forecasts and differences in generator types eligible for capacity expansion as well as the maximum allowable capacity builds by technology type modeled between the two scenarios. One major difference in Scenario 2 is that a reduced land-based wind capacity limit was used, which changed the projection of capacity builds for all types. Notably, the projections for offshore wind were higher earlier in the model horizon (e.g., 2030) in Scenario 2 as compared to Scenario 1 to help achieve the 70 x 30 target.
Two primary drivers are attributable to increased renewable resources in capacity expansion: (1) high operating cost of dispatchable generators, and (2) low capital costs for renewable generators. High fuel (e.g., natural gas prices, clean DEFR fuel prices) and/or high CO2 emissions prices result in significant decrease in fossil generation and subsequent increase in renewable generation earlier than otherwise projected. Low capital costs for renewable generators result in capacity builds much earlier than otherwise projected, and often an increase in the total amount of capacity built.
In terms of the zonal location for capacity buildouts determined by the capacity expansion model, limitations were imposed on the zonal level as to which generator type(s) could build in each zone. For instance, land-based wind was eligible for expansion in upstate regions (Zones A-G), utility-scale solar was eligible for expansion in upstate regions and Long Island (Zones A-G and Zone K), and offshore wind was eligible for expansion in New York City and Long Island (Zones J and K). Dispatchable emission free resource (DEFR) technologies and battery storage were included as generation resource options in all NYCA zones.
The Draft Scoping Plan includes a reference case and four mitigation scenarios. The first mitigation scenario only includes the initial recommendations of the Climate Act Advisory Panels but it did not meet the targets. The three remaining mitigation scenarios meet or exceed GHG emission limits and achieve carbon neutrality by 2050. They all include:
- Zero emission power sector by 2040
- Enhancement and expansion of transit & vehicle miles traveled (VMT) reduction
- More rapid and widespread end-use electrification & efficiency
- Higher methane mitigation in agriculture and waste
- End-use electric load flexibility reflective of high customer engagement and advanced technologies
The three mitigation scenarios that meet the Climate Act targets address concerns raised by the Climate Action Council membership:
Draft Scoping Plan Scenario 2: Strategic Use of Low-Carbon Fuels: Includes the use of bioenergy derived from biogenic waste, agriculture & forest residues, and limited purpose grown biomass, as well as green hydrogen, for difficult to electrify applications
Draft Scoping Plan Scenario 3: Accelerated Transition Away from Combustion: Includes Low-to-no bioenergy and hydrogen combustion and accelerated electrification of buildings and transportation
Draft Scoping Plan Scenario 4: Beyond 85% Reduction: Accelerated electrification + limited low-carbon fuels: This scenario adds additional VMT reductions; additional innovation in methane abatement; and avoids direct air capture of CO2
I prepared Draft Scoping Plan comments on these mitigation scenarios that includes descriptions and a comparison of the differences between them based on Appendix G of the Draft Scoping Plan. Unfortunately, the documentation is so poor that it does not explain the rationale for the generation sector differences described in the next section.
Comparison of Scenarios
The following table provides an overview of the capacity (MW) and energy generated (GWhr) generating resources in the five scenarios described above. Because it is difficult to read the table I have also provided a spreadsheet with the table and the input data extracted from the NYISO and Integration Analysis spreadsheets. I will compare each of the resource categories in the following from 2019 up to 2040 when the state’s electric grid is supposed to be zero-emissions.
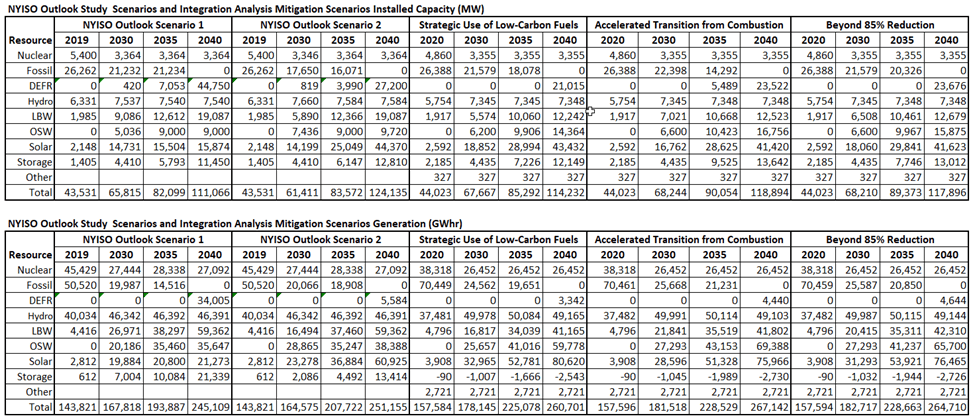
The first resource category is nuclear. There is no significant difference in the capacity and power generated between the scenarios. They all reflect the irrational shutdown of over 2,000 MW at the Indian Point Nuclear Station and continued operation of the remaining nuclear facilities to 2040. Despite the fact that nuclear is the only dispatchable emissions-free generating resource that can be scaled up neither analysis believes that additional nuclear power generation could be part of New York’s future.
There are interesting differences between the scenarios in the fossil generation resource category. Resource Outlook Scenario 1 reduces fossil capacity 19% from 2019 to 2030, keeps it the same in 2035, and then goes to zero in 2040. Resource Outlook Scenario 2 reduces fossil capacity 33% from 2019 to 2030, reduces it another 9% by 2035, and then goes to zero in 2040. Note that the energy produced is the same for both scenarios in 2030 but in 2025 Scenario 1 is reduced 8% more. So even though there is more fossil capacity in 2035 in Scenario 1 it is used less. This is problematic for me because it means that the production resource model is treating the fossil resources differently between the scenarios. It is not clear what would cause this difference.
The Integration Analysis scenario fossil projections raise similar concerns. Scenario 2, Accelerated Transition from Combustion, capacity and generation is higher in 2030 compared to the other two scenarios but then does show a marked decrease in 2035. If it is accelerated, why is it higher in 2030? Integration Analysis Scenarios 2 and 4 are comparable to Resource Outlook Scenario 1 and Integration Analysis Scenario 3 is comparable to Resource Outlook Scenario 2. I assume that this reflects similar assumptions by the analysts at NYISO and NYSERDA.
All the Hydro category scenarios show an increase in capacity between 2019 and 2030. I assume that a large part of that is due to the Clean Path New York (CPNY) and Champlain Hudson Power Express projects.
The remaining categories are the key parts of the transition.
The land-based wind (LBW) resource category is the first where there are significant differences between the Resource Outlook and the Integration Analysis scenarios. Resource Outlook Scenario 1 increases LBW capacity 3.1 times whereas Scenario 2 only doubles the amount in 2030. Integration Analysis Scenario 2 also doubles capacity by 2030, Scenario 3 goes up 2.7 times, and Scenario 4 goes up 2.4 times. The differences between scenarios disappear by 2035 but the Resource Outlook projects land-based wind capacity will be 53% higher than the mitigation scenarios in the Integration analysis with 42% more generation.
The NYISO production resource model apparently does not think that offshore wind is a cost-effective option because both scenarios do not increase the projected capacity significantly beyond the Climate Act mandate of 9,000 MW. On the other hand, the Integration Analysis scenarios nearly double the amount of offshore wind resources projected. Overall, the Resource Outlook offshore wind capacity is 40% lower than the average of the Integration Analysis scenarios and generation is 43% lower.
For the solar resource there is a significant difference between Resource Outlook Scenario 1 and all the other scenarios. The capacity is 63% lower and the generation is 71% lower than the averages of the other scenarios. In 2040 the capacity factor for the projected resource capacity and expected generation is a reasonable 15% for Resource Outlook Scenario 1 whereas Resource Outlook Scenario 2 is 17% but 21% for the Integration Analysis scenarios. In my opinion I question why there is a difference for the Resource outlook scenarios. I don’t think that the Integration Analysis expectation that the solar capacity factor can bas high as 21% in 2040 is reasonable for New York’s latitude and snowfalls.
The energy storage resource category capacity values are pretty much the same all the scenarios. However, the generation projections are presented differently so that it is not possible to compare them.
As noted in the Resource Outlook, the Dispatchable Emissions-Free Resource (DEFR) category is a proxy generator type that represents a yet unavailable future technology that would be dispatchable and produces emissions-free energy (e.g., hydrogen, RNG, nuclear, other long-term season storage, etc.). The DEFR capacity and generation is substantially higher in Resource Outlook Scenario 1 and all the other scenarios. Even Resource Outlook Scenario 2 is higher than the Integration Analysis scenarios. In addition, Resource Outlook Scenario 1 capacity factor is 9% whereas the others are all around 2%.
Getting to 100%: Six strategies for the challenging last 10%
My most recent post described a recent paper, Getting to 100%: Six strategies for the challenging last 10%, that provides a concise evaluation of six zero-emissions technologies. It is instructive to consider these strategies in the context of these projections. The authors from the National Renewable Energy Laboratory provided the following summary of the challenge:
Meeting the last increment of demand always poses challenges, irrespective of whether the resources used to meet it are carbon free. The challenges primarily stem from the infrequent utilization of assets deployed to meet high demand periods, which require very high revenue during those periods to recover capital costs. Achieving 100% carbon-free electricity obviates the use of traditional fossil-fuel-based generation technologies, by themselves, to serve the last increment of demand—which we refer to as the ‘‘last 10%.’’
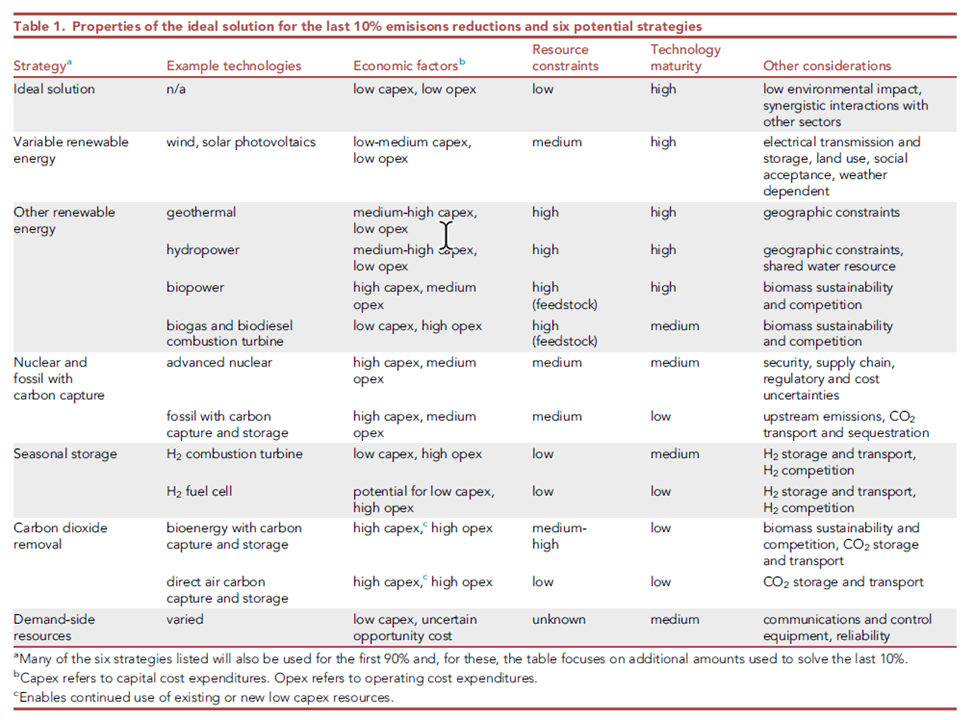
The Getting to 100% paper describes six strategies that are summarized in the following table. Note that the strategies are compared to an ideal solution. Ideally, the solution for peak loads would have low capital expenses and low operating expense, low resource constraints, be technologically mature, have low environmental impacts, and work well with other resources. Needless to say, no technology comes close to meeting those ideal conditions. The authors note that: “Although existing studies generally highlight the same fundamental causes associated with the last 10% problem, there is a lack of consensus on the preferred strategies for meeting this challenge. This is not surprising, given the diversity of possible solutions and the speculative nature of their costs, given their early stage of development.”
The Getting to 100% paper described strategies for the last 10% challenge which for this resource refers to increasing the use of wind, solar, and storage to cover what I call the ultimate problem. Both the Resource Outlook and the Integration Analysis models predict that the primary resource for this challenge will be seasonal storage using DEFR. Although there are mentions of the other strategies the emphasis is on the dispatchable emissions-free resource. The proxy technology in the Integration Analysis is hydrogen although the production and use options are not specified.
There are other options for seasonal storage. The report notes:
This group of technologies is not well defined, but it could include batteries with very low-cost electrolytes capable of longer-than-diurnal durations. Because of the requirement for very low-cost energy storage, most seasonal storage pathways focus on hydrogen, ammonia, and other hydrogen-derived fuels stored in geologic formations.
Ultimately the Getting to 100% paper evaluates hydrogen used either in a combustion turbine or a fuel cell for electricity production. In the New York implementation plan the dispatchable emissions-free resource (DEFR) place holder is hydrogen produced using wind and solar. There are members of the Climate Action Council that insist that the hydrogen has to be used in a fuel cell rather than a combustion turbine because combustion causes emissions.
The Draft Scoping Plan calls for the use of so-called “green hydrogen” whereby hydrogen is produced by a carbon-free process of electrolysis from water. The Draft does not include a feasibility analysis of the production and use of hydrogen in some form as the placeholder technology for DEFR. The Resource Outlook does not specify a specific technology but emphasizes the risks of depending upon an unproven technology: “Both scenarios include significant DEFR capacity by 2035, but it is important to note that the lead time necessary for commercialization, development, permitting, and construction of DEFR power plants will require action much sooner if this timeline is to be achieved.”
I submitted a Draft Scoping Plan comment specifically addressing this presumption. I do not believe that the Integration Analysis correctly accounted for the energy needed to produce the hydrogen needed for the DEFR requirement. I think that there will be siting issues for all the fuel cells, electrolyzers, pipelines, and hydrogen storage facilities. . In the exisitng system the generating sources assigned for peaking power for this reliability requirement used the cheapest technology available (simple-cycle gas turbines). Meeting this requirement in the future using the hydrogen DEFR resource will be using the most expensive generating technology available. The capacity factors for this resource in the Draft Scoping Plan are 2% for all mitigation scenarios so it will be difficult to cover these costs for the short periods needed. I guarantee the usual suspects will complain about profiteering when the costs spike during these periods.
In addition, the Getting to 100%: Six strategies for the challenging last 10% report notes that “current high-cost electrolyzers need to operate almost continuously to recover their capital expense”. The Draft Scoping Plan plans to use intermittent wind and solar that preclude any continuous processes. That issue has been completely ignored in the Draft Scoping Plan.
Recall that there are members of the Climate Action Council that insist that hydrogen used for electric generation has to be used in fuel cells. The Getting to 100% paper addresses fuel cells:
Fuel cells have diverse applications, but their use for bulk power generation is currently limited. Given the range and scale of applications especially for transportation, substantial capital cost reductions for fuel cells are possible. With low capital costs for combustion turbines and future potential cost reductions for fuel cells, the economic case for hydrogen mainly hinges on lowering the cost of electrolytic hydrogen.
According to Table 1 in the Getting to 100% paper, it really is a stretch to say that there are any positive aspects for using hydrogen. For hydrogen used in combustion turbines the report claims low capital expenses (apparently referring only to the combustion turbine but not including the generation of the hydrogen itself), medium operating expenses and resource constraints, and concerns about hydrogen storage and transport as well as competition for using hydrogen in other sectors. For hydrogen used in fuel cells there is a potential for low capital expenses, high operating expenses, low resource constraints (apparently referring only to the fuel cell and not assuming that the hydrogen is generated with wind and solar resources), low technological maturity, and the same other considerations as hydrogen used in combustion turbines.
Discussion
This analysis found significant differences between the projections for land-based wind, offshore wind, energy storage and dispatchable emissions-free resources in the Resource Outlook and the Integration Analysis. I think that those differences should be discussed in an open forum. Most importantly to New York citizens the costs associated with the different options have to be made available from the NYISO and Climate Action Council. I am pretty sure costs account for the differences in the NYISO scenarios but without that information we cannot be sure. Most importantly, the feasibility of a dispatchable emissions-free resource has to be addressed and the projected DEFR utilization difference between Resource Outlook Scenario 1 and all the other scenarios reconciled. I also believe that both organizations have to address the economic viability challenge of DEFR stemming from the infrequent utilization of those assets deployed to meet high demand periods, which require very high revenue during those periods to recover capital costs.
Moreover, the forum should also address implementation concerns raised by the New York State Reliability Council in their Draft Scoping Plan comments. They made the point that the new resources required are enormous and also raised other concerns:
Practical considerations affecting the availability, schedule and operability for new interconnections include: interconnection standards; site availability; permitting; resource equipment availability; regulatory approval; large volume of projects in NYISO queue and study process; scalability of long-term battery storage and other technologies; operational control; impact of extreme weather; consideration of a must- run reliability need for legacy resources. In addition, the pace of transportation and building electrification, the timing of any natural gas phase-out and their impact on the electric T&D system must also be carefully studied from technical, economic and environmental perspectives. Together, these practical considerations require the development of reliable zero emission resources to be conscientiously sequenced and timed in the near term (through 2030) to ensure broader GHG reductions in all sectors beyond 2030.
One final point about the modeling analyses. The programs are proprietary and the documentation is sparse so it is not possible to fully understand the results. For example, the Integration Analysis Accelerated Transition Away from Combustion scenario has higher fossil generation projections in intermediate years than the other scenarios. Untangling the reason for that would be a challenge. I believe that the models can create projection differences as much by input tweaks as by the projection algorithms. Because the models are so complicated and include so many input parameters the modelers have to be careful to limit changes between scenarios that could affect the outcomes.
Conclusion
I have repeatedly made the point that the differences between the NYISO projected resources and the Integration Analysis projections need to be reconciled. This post attempted to explicitly list those differences. Unfortunately, this concern does not seem to be shared by the Climate Action Council and the Hochul Administration. It is only a matter of time until the ramifications of this abrogation of responsibility affects reliability and affordability of the state’s electric grid.
The other unresolved issue is the feasibility of any dispatchable emissions-free resource. It is staggering that the State is pushing ahead without an independent analysis of the options available for this critical resource. As it stands it will not end well.

8 thoughts on “Comparison of NYISO Resource Outlook and Draft Scoping Plan Generating Resource Projections”