

This past Friday and Saturday (February 3-4 2023) there was a brief shot intensely cold air to the Northeast US. This post includes a couple of descriptions of the implications of this weather event relative to the Climate Leadership and Community Protection Act (Climate Act) and I present some data describing the event.
This is another article about the Climate Act implementation plan that I have written because I believe the ambitions for a zero-emissions economy embodied in the Climate Act outstrip available renewable technology such that the net-zero transition will do more harm than good. The opinions expressed in this post do not reflect the position of any of my previous employers or any other company I have been associated with, these comments are mine alone.
I am Thankful – Mark Stevens
Mark is a regular reader at this blog and has contributed several recent items for posting. He is a retired science and technology teacher from Long Island. His email to me this weekend is a perfect introduction to the issues raised by this weather event.
It was 3 degrees F Saturday morning with a wind chill of -3 degrees. All night the north wind raged, rattling “sealed” windows and doors but still blowing frigid air through them. I did everything I could: raise the boiler’s temperature, cover the big expanse of glass on the patio doors windows, pull the shades. I even added an electric heater in the room my tropical parrot resides so he doesn’t get a fatal pneumonia.
The possibility of a power failure crossed my mind with the overhead wires, high winds, many surrounding trees, and almost monthly power interruptions in the past. It would be an absolutely worst-case scenario if the power went out tonight. Frozen pipes next? I have a backup generator but the thought of going out in the howling cold night, fueling it, hooking it up, starting it, and monitoring the systems wasn’t that appealing.
But LIPA’s tree trimming maintenance and generation/distribution system upkeep allowed the power to stay on through the night and into the next day as I write this. We’re cozy, comfortable and safe. This kind of cold can kill.
I’m thankful we have a reliable, cost-effective electrical generation and distribution system. I’m thankful I have a natural gas-fired boiler that works 24/7 keeping me and my family safe and alive. I am thankful that I don’t rely on intermittent, expensive wind and solar generation as electricity sources that can fail at any time leaving me without power. I’m grateful I don’t have to rely on “backup” battery power that is grossly inadequate, expensive, highly polluting to manufacture and can cause a non-extinguishable toxic gas fire. I pray it does not change.
What’s Keeping the Heat On – James Hanley
James is a Fellow at the Empire Center. His post yesterday is a great overview of the problem facing New York as it continues the implementation of the Climate Act.
As another Arctic blast hits the Northeast and temperatures plunge, more energy is needed to keep New Yorkers warm. Where is that energy coming from?
A lot of it comes from natural gas, but there’s a big supply problem. Because of the state’s ban on fracking and its refusal to allow new and upgraded natural gas infrastructure, not enough gas can get to power plants to generate the electricity needed to keep the lights and heat on in everyone’s houses during times of extreme demand.
What gas is available gets bid up to eye-wateringly high prices. It’s hard to speak meaningfully of an average price for natural gas because the market is volatile, but the 2022 high price in Pennsylvania was $12.95 per million British thermal units (mmbtu). According to one energy industry source, during last Christmas’s cold snap, the price in New York hit $100 per mmbtu.
That translated into an electricity price of nearly 90 cents per kilowatt hour, compared to the average New York price of 19 cents.
That assumes the power plant can even get the gas it needs to operate. With such severe gas shortages, some natural gas-fired plants had to shut down for lack of fuel. What gets burned to take their place – fuel oil – is not only expensive, but also much dirtier and producing more carbon dioxide than natural gas.
So, ironically, because New York has limited the supply of the much cleaner burning natural gas in order to prevent pollution and CO2, the power industry has no choice at times but to spew more pollution into disadvantaged communities and add more carbon to the atmosphere.
The hope is that renewables will one day suffice to supply the electricity we need to heat our homes on a day like this. That hope is irresponsible, because wind and solar aren’t reliable and there is no available “clean” backup power source.
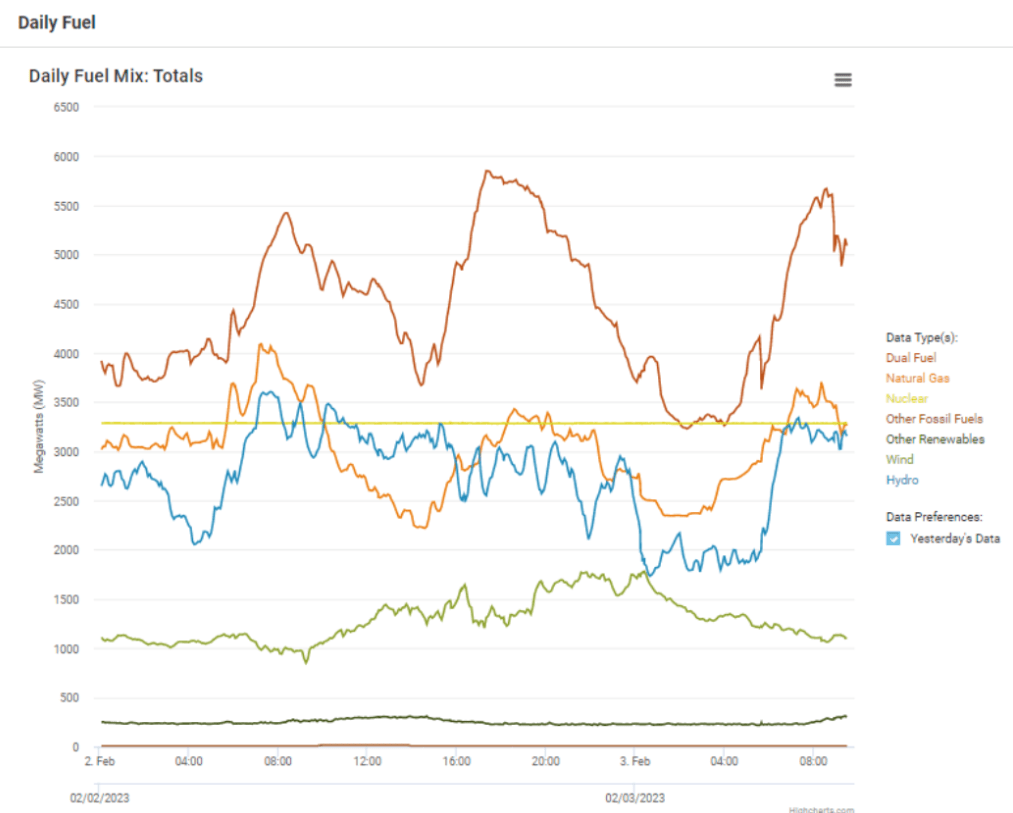
Below is a graph from the New York Independent System Operator’s (NYISO) real-time dashboard, showing fuel use on February 2 into the early hours of February 3. On what was otherwise a reasonably good day for wind power (the light green line), we can see it declining in the early hours of February 3 as the cold front moved in, while the use of dual fuel generators (the top line), which can burn fuel oil, dramatically increased. Building more wind turbines has limited effect – as the wind drops across the state, all the turbines decrease in output.
NYISO has repeatedly warned – and the Climate Action Council’s Scoping Plan admits – that wind and solar will not be sufficient. New York will need between 25 and 45 gigawatts of dispatchable power – power that unlike wind and sun, but like natural gas, fuel oil, and hydro, can be turned on and off at will.
To comply with the Climate Leadership and Community Protection Act (CLCPA), these sources are supposed to be emissions free, leading NYISO to coin the ugly acronym DEFRs – dispatchable emissions-free resources. But they coined that term because they can’t identify any source that meets that standard and is currently available at utility scale and a commercially competitive price.
This means that for the foreseeable future, fossil fuels will be the only proven source of dispatchable backup to keep the heat and lights on during weather that is killingly cold. Since New York no longer has any coal plants, that can be oil – which is more polluting and has higher carbon content – or natural gas.
The CLCPA has a clear goal of eliminating all greenhouse gas emitting power production by 2040, which would mean shutting down all natural gas-fired power plants. But it also provides a path for keeping open those plants that are necessary to ensure a reliable electrical supply. That path, however, faces considerable political opposition.
New York will soon be forced to make a choice: plunging forward with shutting down natural gas-fired power plants, risking rolling blackouts during extreme cold, or moving forward more slowly on its emissions goals, but keeping the heat on. There is no third way.
The Numbers
The past two days were ideally suited to staying inside. I am a numbers guy so I spent time the last several days watching the weather and the electric system using two different resources. The go to resource for weather observations in New York is the NYS Mesonet At UAlbany. I watched the arctic air come into the region and then tracked the event over time. The NYISO Real-Time Dashboard is a fascinating link into the New York electricity market. I suspected correctly that this weather would cause a spike in electric load and I could see that play out over the period.
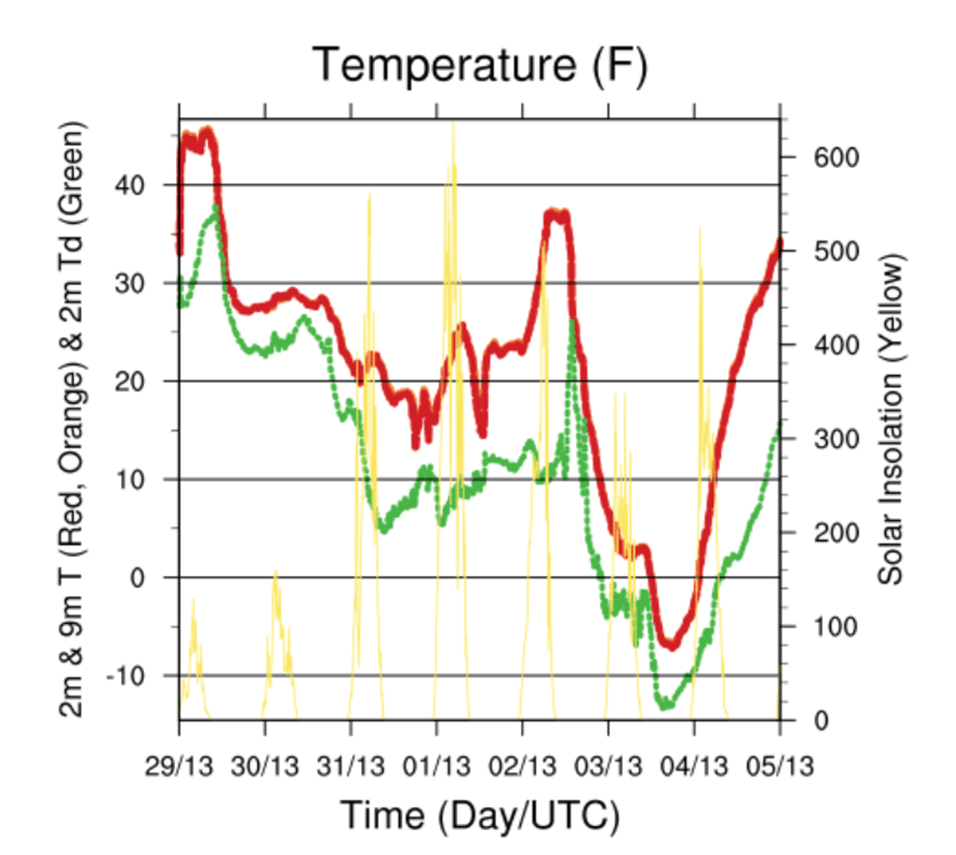
The weather data presented here is all from the NYS Mesonet at the University of Albany. The following graph lists the last seven days of temperature, dew point temperature, and solar irradiance data at Elbridge, NY which is near my home. Note that at the time I write this it is February 5 at 8:00 AM and that corresponds to 05/13 or 1300 universal coordinated time or Greenwich mean time, the standard for meteorological observations. On the night of February 2 the temperature (red) was around 38oF about 7:00 PM EST or 0000 UTC. Then the front came through and the temperature plunged overnight and during the day before briefly leveling out a few degrees above zero until nightfall when it dropped down to 7 or so below.
The next graph is for the same time period but shows the wind speed, wind gusts, and pressure. Frontal passage was accompanied with a dip in the station pressure. The pressure gradient was strong for most of the period so winds were steady slightly above 10 mph with gusts peaking at 38 mph.

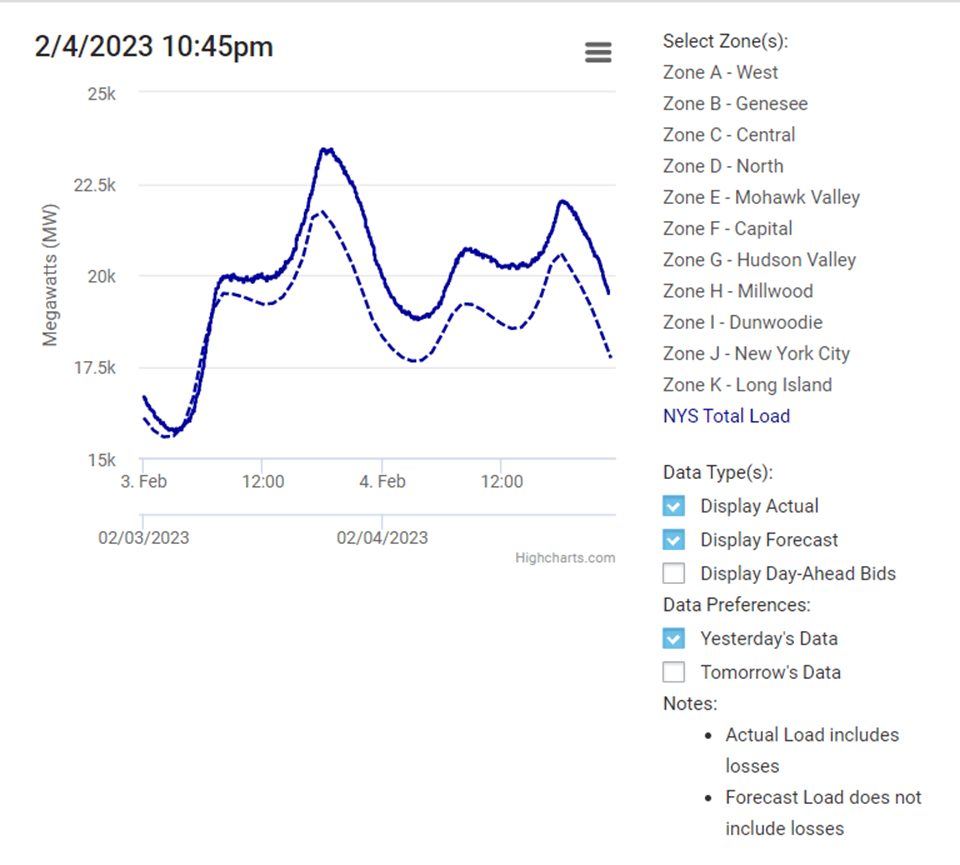
The NYISO Real-Time Dashboard has two relevant graphical displays: the load and real-time fuel mix. The following graph shows the actual and forecast New York total load on February 3-4 (all times are EST). It is noteworthy that the actual loads on both days were significantly higher than forecast loads. The load peaked on 2/3 at 6:50 PM at 23,447 MW and at 6:10 PM on 2/4 at 21,990 MW.
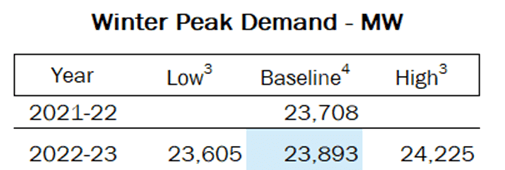
The NYISO 2022 Load and Capacity Data report winter peak demand projections are all greater than the observed peak loads so this should not have been a demand response problem with the existing fleet.
The real-time fuel mix data shows how the existing fleet met the peak loads during this weather event. The following table lists the daily statistics for the different fuel types. The fuel-mix categories are Nuclear; Hydro, including pumped storage; Dual Fuel, units that burn natural gas and other fossil fuels; Natural Gas only; Other Fossil Fuels, units that burn oil only; Other Renewables are facilities that produce power from solar, energy storage resources, methane, refuse or wood; and Wind (at this time exclusively land-based wind).
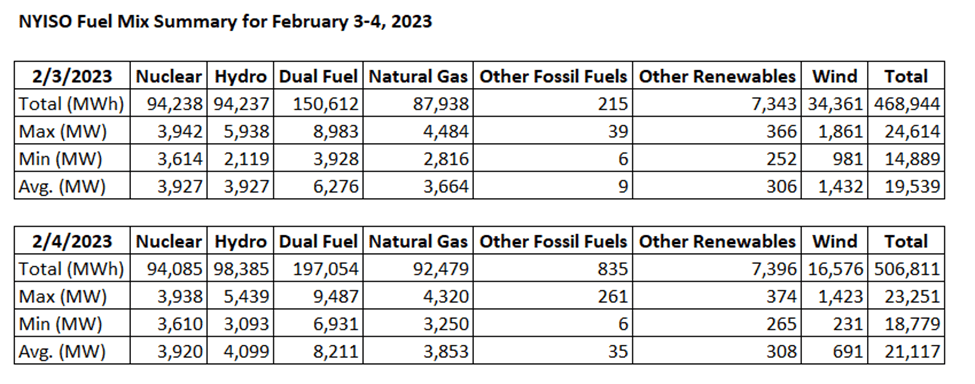
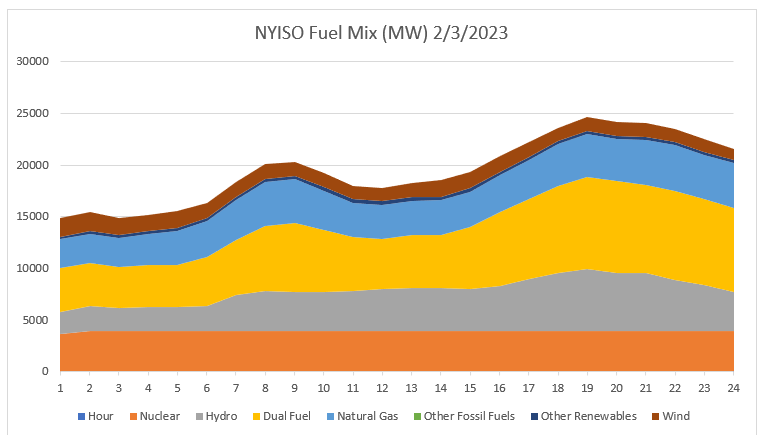
The graphs show how important the fossil fuel units are to keeping the lights on. One notable feature of the fuel type data on 2/3 is that the wind generation was not very high even though winds across the state were quite high. I believe this is because wind turbines don’t provide optimal power if the winds are too light or too strong. The strong winds on this date apparently affected the wind production so even on a windy day New York’s land based wind provided only 65% of the maximum potential capability.

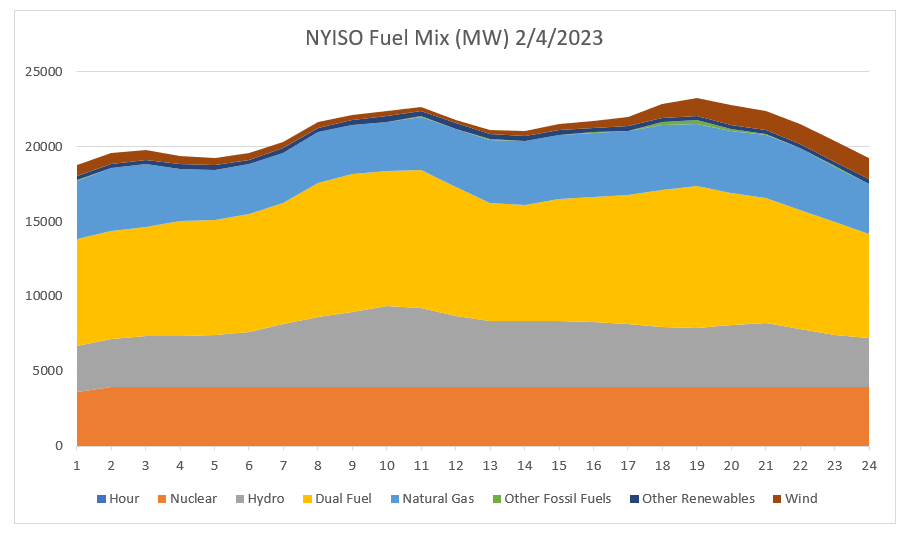
On 2/4/2023 the wind resource was affected by light winds. On this date New York’s land based wind provided only 32% of the maximum potential capability.
Conclusion
Stevens explains how important it is for our safety and well-being to have fossil fuels available during extremely cold weather. Hanley showed that natural gas played an important role keeping the lights on during this arctic blast and described some of the uncertainty associated with the planned net-zero transition. My contribution was to provide more documentation for the weather, resulting electric load peak, and the contribution of different fuels to meeting that peak. I am going to follow up on this post with a deeper dive into the resource availability and implications to the Scoping Plan recommendations for generating resource allocations.
Hanley’s conclusion is spot on:
New York will soon be forced to make a choice: plunging forward with shutting down natural gas-fired power plants, risking rolling blackouts during extreme cold, or moving forward more slowly on its emissions goals, but keeping the heat on. There is no third way.
