

The Climate Leadership and Community Protection Act (Climate Act) includes a target for a 40% reduction of greenhouse gas (GHG) emissions from 1990 levels by 2030. This post describes the latest New York State (NYS) GHG emission inventories and some implications.
This is another article about Climate Act implementation activities that I have written because I believe the ambitions for a zero-emissions economy embodied in the Climate Act outstrip available renewable technology such that the net-zero transition will do more harm than good. The opinions expressed in this post do not reflect the position of any of my previous employers or any other company I have been associated with, these comments are mine alone.
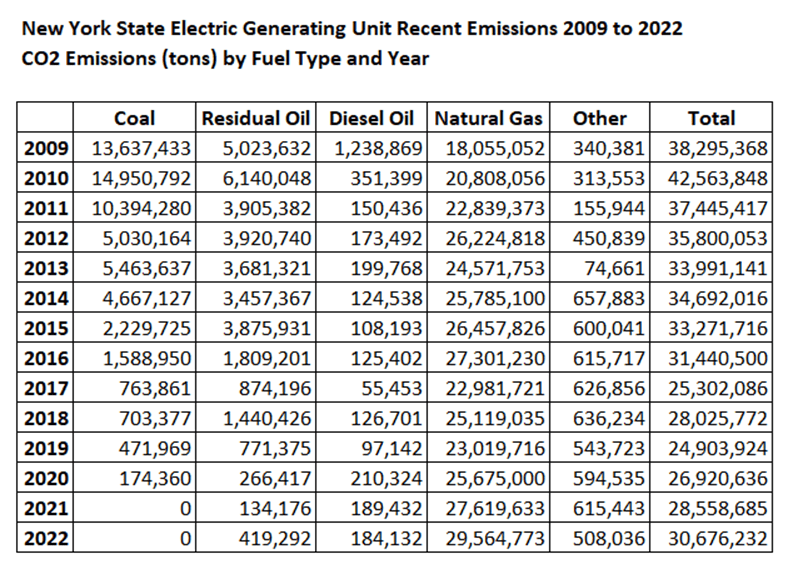
NYS Electric Generating Unit Emissions
According to the Environmental Protection Agency (EPA): “Emissions trading, sometimes referred to as ‘cap and trade’ or ‘allowance trading,’ is an approach to reducing pollution that has been used successfully to protect human health and the environment.” One of the requirements for such a program is a monitoring system that consistently and accurately measures the emissions. NYS electric generating units are in different emissions trading systems and have developed an accurate measuring system that relies on continuous emissions monitoring systems that record pollution levels that are reported to EPA.
The only GHG monitored and reported to EPA is CO2. In 2022 the units that report to EPA emitted 30.7 million short tons. The NYS GHG inventory reports emissions as million metric tons and the 2022 emissions were 27.8 million metric tons. As shown in the following table NYS emissions had been trending down until 2019 as generation from coal and oil was displaced by generation from natural gas. The last three years the effect of the shutdown of the Indian Point nuclear generating station and the loss of its zero-emissions capacity have become evident. Since 2019 CO2 emissions have increased 5.8 million tons or 23%.
NYS GHG Emissions
At the end of 2022 the New York State Department of Environmental Conservation (DEC) released the 2022 statewide GHG emissions report (2022 GHG Report). I published an overview post of this greenhouse gas (GHG) inventory last year that described the games played using that inventory to “prove” that there are societal benefits for the emission reduction programs needed to meet the Climate Act targets.
New York State greenhouse gas (GHG) emissions accounting it includes upstream emissions and is biased against methane. Obviously if upstream emissions are included then the total increases but at the same time it makes the inventory incompatible with everybody else’s inventory. There are two methane effects. Global warming potential (GWP) weighs the radiative forcing of a gas against that of carbon dioxide over a specified time frame so that it is possible to compare the effects of different gases. The values used by New York are compare the effect on a molecular basis not on the basis of the gases in the atmosphere so the numbers are biased. Almost all jurisdictions use a 100-year GWP time horizon but the Climate Act mandates the use of the 20-year GWP which increases carbon dioxide equivalent values. In addition, I believe the State is using higher emission estimates for methane production, transport, and processing. As a result, NY GHG emission inventory estimates are nearly double values determined by other jurisdictions.
The 2022 GHG Report includes the following documents:
- Summary Report (PDF)
- Sectoral Report 1: Energy (PDF)
- Sectoral Report 2: Industrial Processes and Product Use (PDF)
- Sectoral Report 3: Agriculture, Forestry, and Land Use (PDF)
- Sectoral Report 4: Waste (PDF)
- Appendix: CLCPA Emission Factors (PDF)
In order to calculate all the emissions in New York and estimate the upstream emissions it took DEC, the New York State Energy Research & Development Authority (NYSERDA) and consultants two years to produce the reports. This article is concerned only with electricity generation especially as it relates to overall emission trends and emissions data could be used for a market-based control program.
2020 GHG Emissions
Table ES.2 in the Summary Report presents emissions for different sectors. Electric generation emissions are listed as electric power fuel combustion, imported electricity, and as part of imported fossil fuels. In 2020, GHG gas emissions from electric power fuel combustion totaled 22.12 million metric tons of carbon dioxide equivalent (mmt CO2e) using a 20-year global warming potential. Imported electricity totaled 7.81 mmt CO2e. Fuel combustion and imported electricity emissions were primarily CO2. The Table ES.2 imported fossil fuel value shown covers all fossil fuel used in other sectors. I found another source that breaks out the electric upstream emissions that I used to calculate emissions.
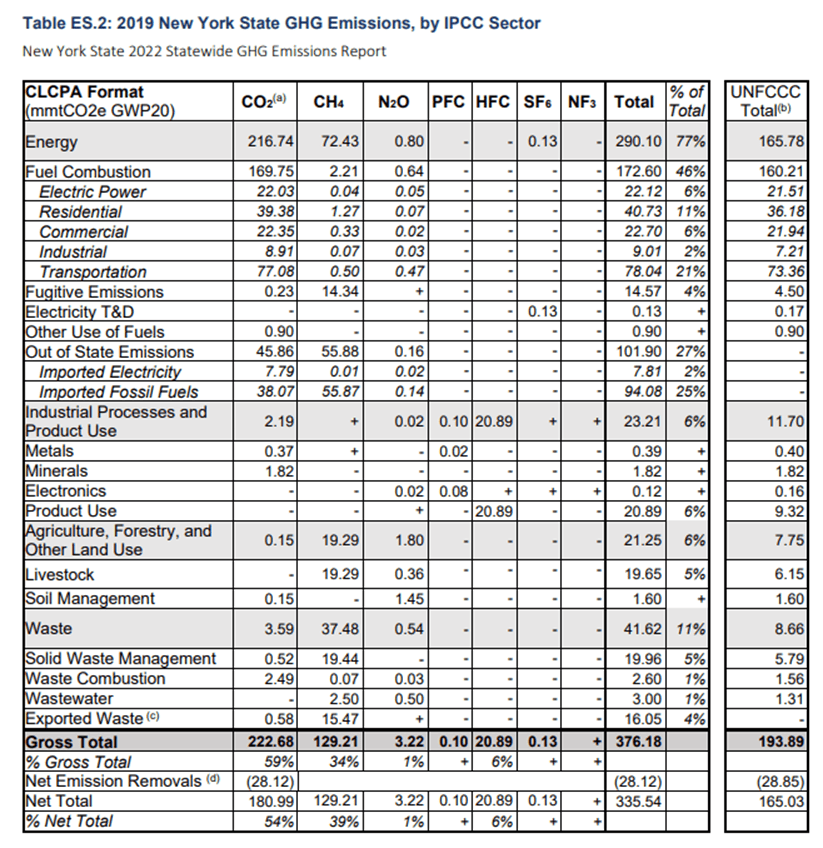
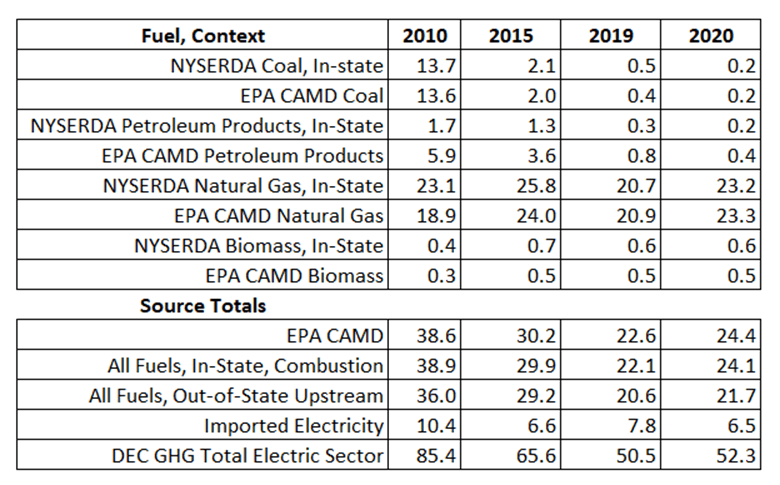
When I first started looking at the electric sector numbers, I compared the State numbers to the emissions reported by the generating companies to EPA. The reported 2020 EPA numbers were 24.4 mmt CO2e but the 2022 GHG Report electric sector emissions were 52.3 mmt CO2e. The 2022 GHG Report Sectoral Report 1: Energy chapter on electricity generation does not provide much detail but references a NYSERDA report: Technical Documentation: Estimating Energy Sector Greenhouse Gas Emissions Under New York State’s Climate Leadership and Community Protection Act that does provide details. I provide more details on the calculation methodology here. The following table combines Table 28 electric sector emissions by fuel type in that document with EPA Clean Air Markets Division emissions data. In Table ES.2 above the total imported fossil fuel emissions in 2020 were 94.08 mmt CO2e and in the NYSERDA technical documentation the upstream emissions are 21.7 mmt CO2e. New York’s biased accounting methodology doubles electric sector emissions from the emissions reported to EPA. The claim that upstream emissions are on the order of direct emissions is not credible.
NYS GHG Emissions Data
The 2020 GHG Report includes a sectoral report covering the energy sector. The results section notes:
The most significant emission reduction in this report was the decrease in fuel combustion emissions in the electricity sector from 1990 to current by over 60%. This is related to the transition away from fuels with higher combustion emissions to those with lower combustion emissions; as natural gas usage has increased, the use of coal and petroleum fuels such as residual fuel oil has declined. As described in NYSERDA (2022a), the emissions from the extraction, processing, transmission, and distribution of these fuels have not followed the same pattern.
I also evaluated the data used in the report. It is available along with just about everything else at the NYS data website. This is part of the Open NY initiative described as:
Open NY is the award-winning initiative of policies, programs and tools that provide public access to digital data for collaboration and analysis. Empowering the public and government with data for the digital age.
Everything may be there but it is not easy to use.
The data used in the 2020 GHG emissions report are available. I have developed a spreadsheet (documentation) that simplifies the use of the data for more refined evaluation.
One finding in my evaluation is that there are changes in the total emissions reported relative to last year’s inventory. The spreadsheet lists all the differences. Importantly there is a difference between the regulatory Part 496 1990 baseline emissions of 409.78 million metric tons and this inventory that says 1990 emissions were 404.26 and last year’s baseline emissions were 402.54. Recall that Part 496 determines the 2030 emissions limit, 245.87 million metric tons and 2050 emission limit, 61.47 million metric tons as percentages of the baseline. At some point DEC will have to address these differences.
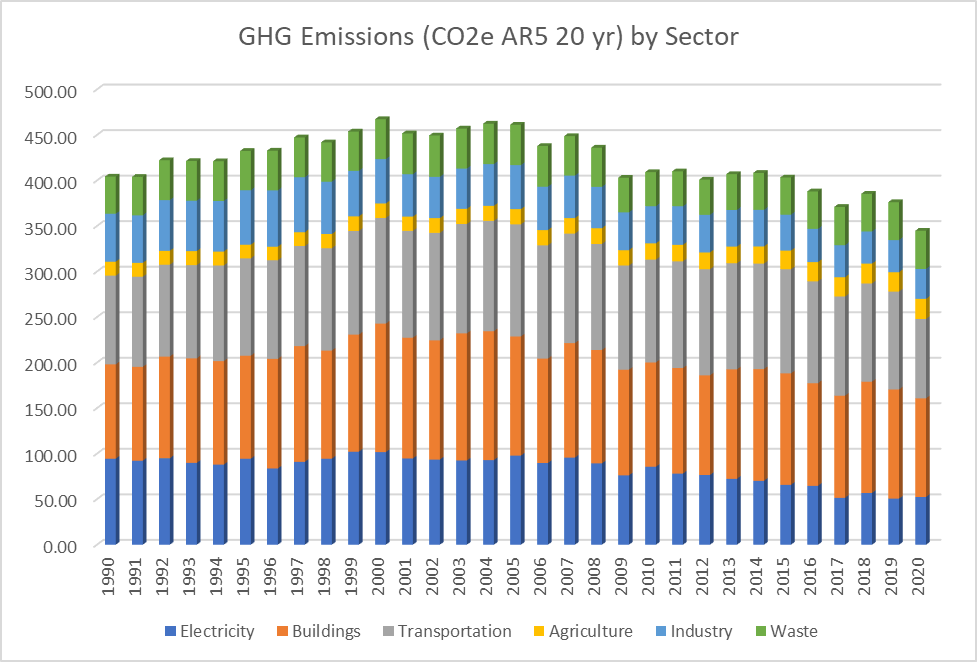
Another interesting result is the distribution of emissions by economic sector as shown in the following figure. Overall emissions have been going down since the mid-2000’s. The electric sector reductions have been the primary cause. As noted previously electric sector emissions were decreasing over time until 2019 but started increasing since then.
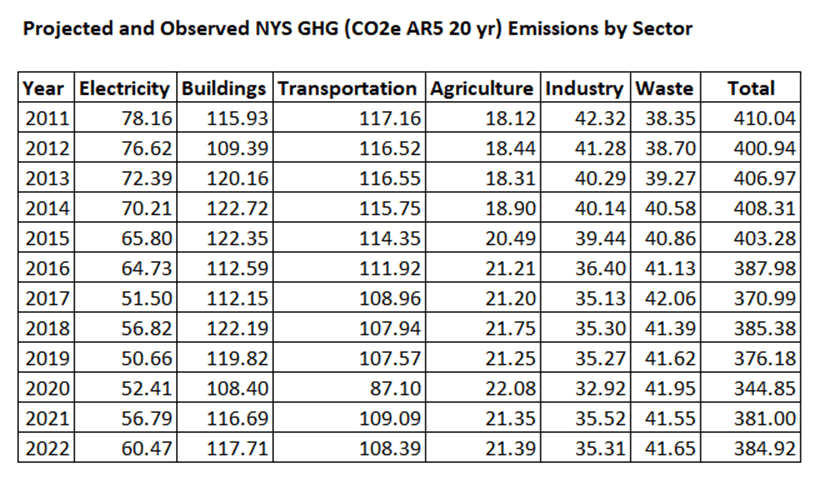
Projected 2021 and 2022 NYS GHG Emissions
In order to determine where NYS stands relative to the 2030 target currently, it is necessary to combine the EPA and NYS datasets. The 2020 GHG Report notes that the pandemic shutdowns affected 2020 emissions. In order to project 2021 emissions, I used the average of the years 2016-2020 for all sectors except electricity and for 2022 I used the average of 2017-2021 excluding 2020.
Because the electric sector emissions include upstream and imported electricity emissions, I had to do something more refined. The direct emissions used the EPA reported emissions. The upstream and imported electricity emissions are in Table 28: electric sector emissions by fuel type of the NYSERDA (2022a) technical documentation. I took the average of the 2019 and 2020 data for the imported component. The upstream emissions are related to the direct emissions. I assumed that relationship was equal to the ratio of the 2019 and 2020 average EPA emissions to the out-of-state upstream emissions. Using these assumptions, I project that the 2022 emissions increase to levels not seen since 2018.
Discussion
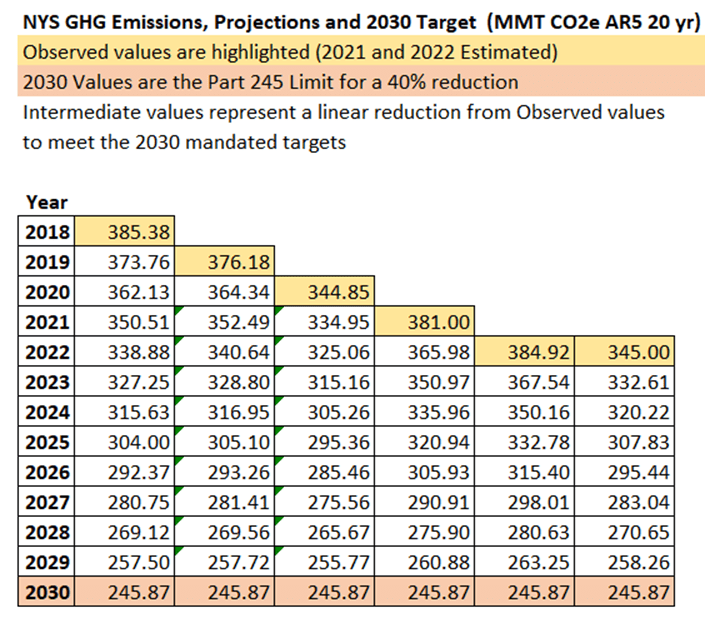
The Climate Act includes a target for a 40% reduction of greenhouse gas (GHG) emissions from 1990 levels by 2030. The NYS Part 496 1990 baseline emissions are 404.26 mmt CO2e. The total 2020 NYS emissions were 344.85 mmt CO2e which is a 15% reduction from the baseline. The 2030 limit is 245.9 CO2e which will require a further 29% reduction.
I looked at alternative emission reduction trajectories to get to the 2030 limit. The following table estimates the emissions needed to meet the targets from starting points in 2018 to 2022. Using the observed 2020 emissions noted above would require a 2.96% reduction per year. Using the projected 2021 emissions (381.00 mmt CO2e) the annual reduction rate would be 3.94%. Similarly, for 2022 because the emissions have gone up the annual reduction rate would have to be 4.52%. Even if the 2022 emissions turn out to equal the 2020 emissions the annual reduction rate would have to be 3.59%.
Because of the variation of weather-related fuel usage GHG emissions have quite a bit of interannual variability (on the order of 3%). My impression is that the annual reduction rates required to meet the 2030 target will be a significant challenge. It is not clear what will happen if anyone of many issues causes delays in the implementation compliance trajectory.
There is another aspect of these data that is relevant with respect to the proposed cap and invest program. The electric generating sector has developed a verifiable emissions reporting system that provides compliance data two months after the end of the year. That system uses traceable direct measurements. The 2020 GHG emissions report that represents the “official” compliance reporting by the DEC takes two years to produce. It uses fuel use data, emission factors, and many assumptions in a process that is anything but open and transparent. There have been three iterations of NYS GHG emission inventories and the historical data has changed in each subsequent iteration. That approach does not meet the EPA emissions trading system recommendation for a timely, consistent, and accurate emissions reporting system.
Conclusion
There are a few takeaway points with these data. The EPA electric generating unit emissions for 2022 increase over past years because of the NYS decision to shut down 2,000 MW of zero-emissions generating capacity at Indian Point. Clearly, if the net-zero transition is to succeed then maintaining and expanding the state’s nuclear resources is necessary. The data also show that the emission reduction trajectory is ambitious and, I believe, unlikely to be met.
The Climate Act GHG emission reporting requirements double the electric sector emissions over the direct measurements used by EPA. The reporting system developed for EPA gets the results in two months but the reporting system used to generate the Climate Act GHG emissions takes two years. One of the arguments used by the Climate Action Council to justify the proposal for a cap and invest market-based control program was that the Regional Greenhouse Gas Initiative (RGGI) trading system was a successful model that could be used. RGGI uses the EPA reporting data to provide timely, consistent, and accurate data for compliance requirements. There is no favorable comparison between the EPA system and the Climate Act reporting system. The reality that the NYS GHG emissions reporting data are incompatible with any emissions trading system is just one of the practical problems that the cap and invest proposal must address before it can be implemented.
