Balancing the risks and benefits of environmental initiatives
The Problem with Overbuilding Wind and Solar
The Climate Leadership & Community Protection Act (Climate Act) net-zero transition plan includes a requirement for “zero-emissions” electric generating by 2040. New York’s irrational energy policies preclude the only proven zero-emissions choice (nuclear energy) to meet that requirement. Instead, the emphasis is on solar and wind development. A recent post at Trust, yet verify includes a great graphic that illustrates an inherent flaw with wind and solar that Climate Act implementation must address.
I have been following the Climate Act since it was first proposed. I submitted comments on the Climate Act implementation plan and have written over 300 articles about New York’s net-zero transition. The opinions expressed in this post do not reflect the position of any of my previous employers or any other company I have been associated with, these comments are mine alone.
Climate Act Background
The Climate Act established a New York “Net Zero” target (85% reduction and 15% offset of emissions) by 2050 and an interim 2030 target of a 40% reduction by 2030. The Climate Action Council is responsible for preparing the Scoping Plan that outlines how to “achieve the State’s bold clean energy and climate agenda.” In brief, that plan is to electrify everything possible and power the electric grid with zero-emissions generating resources by 2040. The Integration Analysis prepared by the New York State Energy Research and Development Authority (NYSERDA) and its consultants quantifies the impact of the electrification strategies. That material was used to write a Draft Scoping Plan. After a year-long review the Scoping Plan recommendations were finalized at the end of 2022. In 2023 the Scoping Plan recommendations are supposed to be implemented through regulation and legislation.
Implementation
In order to get a sense of the magnitude of the renewable resource development necessary to implement the Climate Act this section shows the expected changes to load and generating resources.
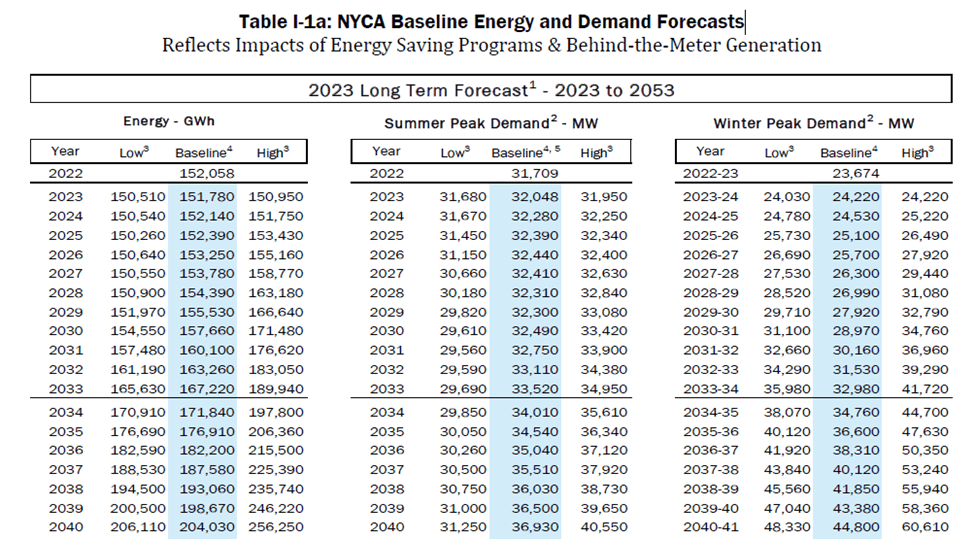
The New York Independent System Operator (NYISO) 2023 Load & Capacity Data Report (also known as the “Gold Book”) 2023 Load & Capacity Data Report (Gold Book) lists the 2022 observed load and projections out to 2053. The following excerpt shows Table I 1-a baseline energy and demand data to 2040.
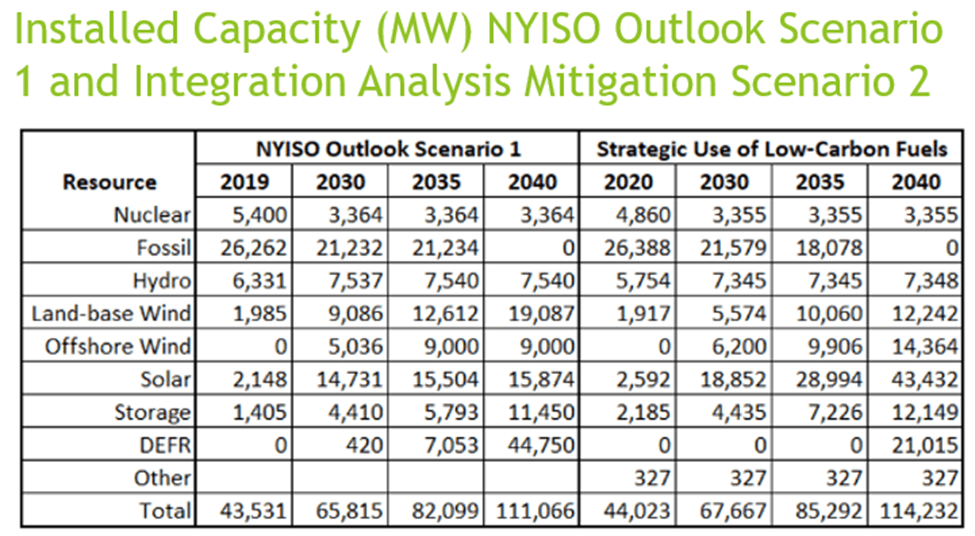
There are two relevant projections for future generating resources. The “official” Hochul Administration projections are in the Final Scoping Plan. The NYISO projections are in the 2021-2040 System & Resource Outlook I compare the installed capacity for Scoping Plan and the Resource Outlook in the next table. For this post I am only concerned with the total generation projections.
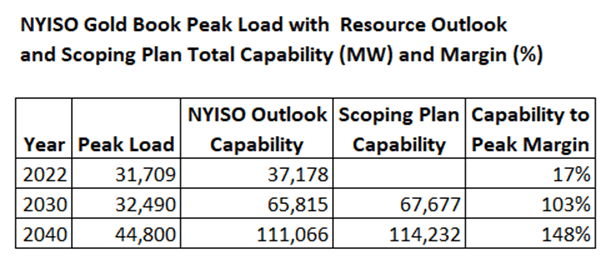
In 2022 the peak observed load was 31,709 MW and the installed summer capability 37,178 MW. In 2030 the NYISO Gold Book baseline predicted summer peak load is 32,490 MW and 36,930 MW in 2040. The peak winter load is 28,970 in 2030 and 44,800 in 2040. In the following table, I list the maximum capability and peak load data and calculate the capability to peak load margin.
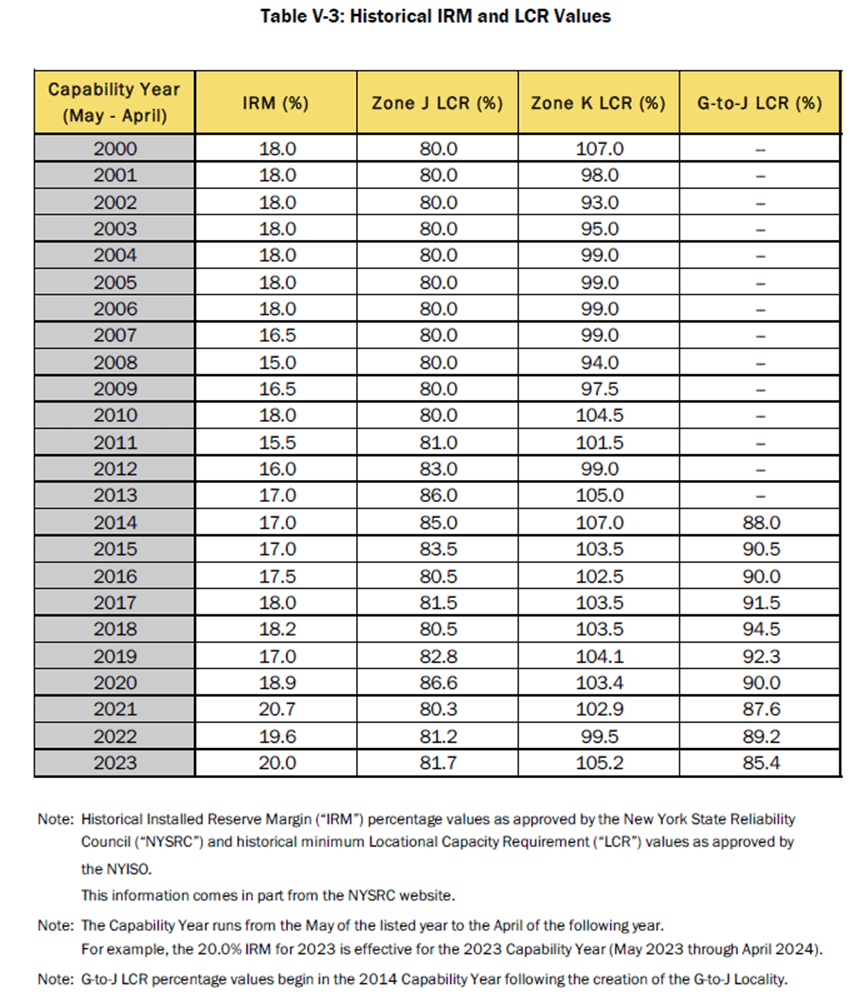
The NISO Gold Book Table V-3 lists the historical Installed Reserve Margin (IRM) values for the New York Control Area and the historical minimum Locational Capacity Requirements (LCRs) approved by the NYISO for Zones G-J, Zone J, and Zone K. The IRM requirements are established each year by the New York State Reliability Council (NYSRC). The IRM represents the minimum level of capacity, beyond the forecasted peak demand, which utilities and other energy providers must procure to serve consumers. This post is not going to address the LCRs.
As shown here New York will require an unprecedented level of new wind and solar development in order to meet the net-zero transition mandates of the Climate Act. Note that the capability to peak margin calculated in the preceding table is not exactly the same as the IRM but the expectation is that the IRM will increase significantly in the future. The reason for this IRM shift is that wind and solar are intermittent and overbuilding those resources is necessary to address that intermittency. While overbuilding is suggested as the solution for the best energy plan the question is how much is enough and whether it is a solution that eliminates the need for any new resources.
One Third on Average
I am convinced that overbuilding is not as viable a solution as its proponents claim. However, trying to explain the reasons why is complicated so I have been looking for a more-easily understood graphical explanation. Michel Opdbe wrting at the at Trust, yet verify blog has just such a graphic.
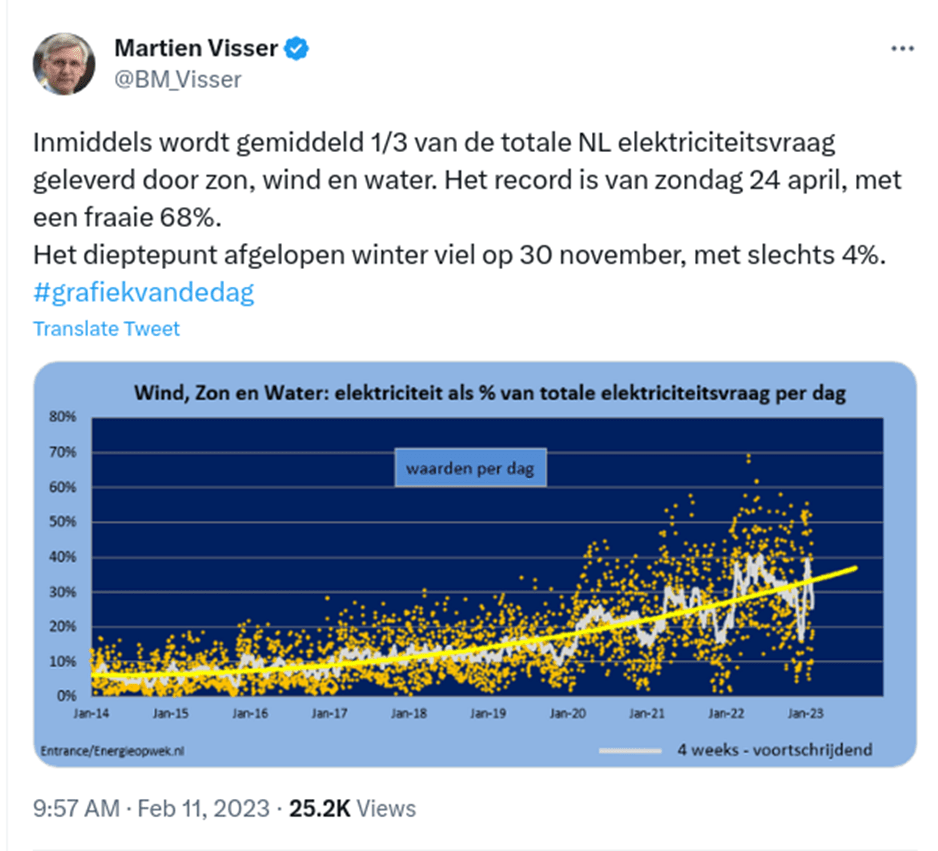
Opdbe lives in Belgium and writes about renewable energy policies in Belgium and adjoining countries. His recent post addressed a claim that on average of 1/3 of the total electricity demand in the Netherlands is now supplied by sun, wind and water. The post was based on a tweet with this message (translated from Dutch):
An average of 1/3 of the total electricity demand in the Netherlands is now supplied by sun, wind and water. The record is from Sunday 24 April, with a nice 68%. The low of last winter was on November 30, with only 4%. #graphoftheday
It was accompanied by a graph showing the daily energy production by solar, wind and water as percent of total demand of the Netherlands:
He explains:
The thick yellow line is the four weeks moving average and, indeed, it ends up at roughly one third of demand at the beginning of 2023. That is however only part of the story, as also hinted by the two values that are mentioned in the text of the tweet.
Although the average ends up around one third of demand, it is derived from a incredibly wide range. According to the tweet, solar and wind together with water produced between 4% and 68% of total demand in 2022 in the Netherlands.
There is also something in this graph that drew my attention, but it is not that clear from that graph. Unfortunately, I don’t have the data from the Netherlands. Luckily, this dynamic is not unique to the Netherlands, it is exactly the same in Belgium and the Belgian data is readily available.
In my opinion this dynamic is universal across all jurisdictions that are moving to a reliance on wind and solar.
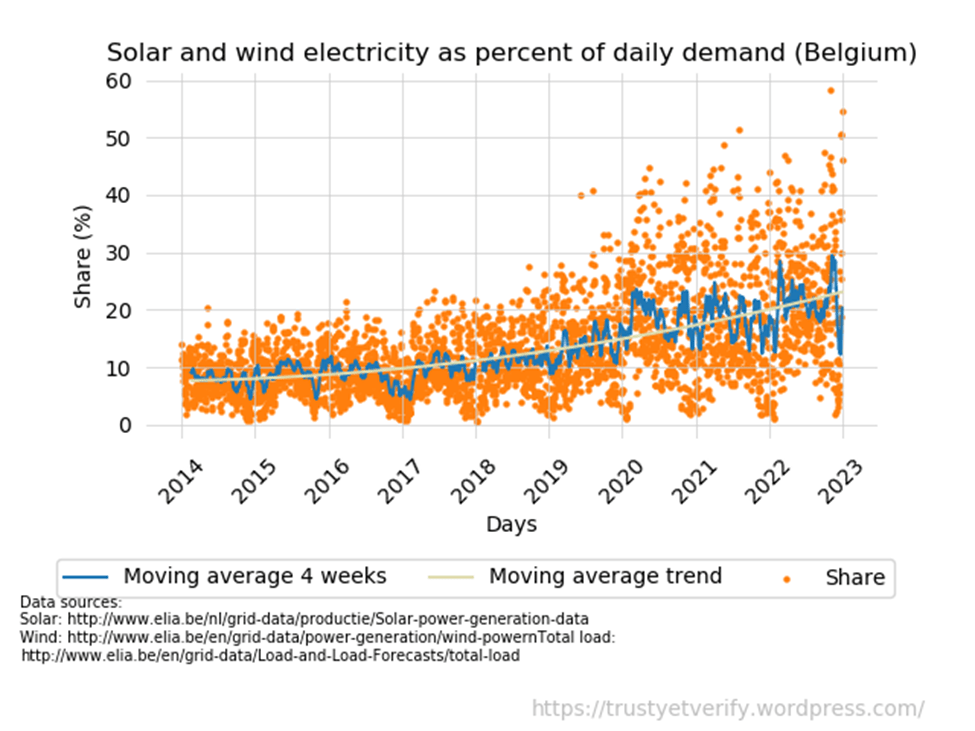
This is a recreation of that graph using the Belgian data (only solar and wind, water power in Belgium is negligible):
The Belgian figures are close to that of the Netherlands, albeit a bit lower. The average share of Belgian solar and wind as percent of demand is roughly one fourth (compared to one third of the Netherlands). The range of the Belgian data is also somewhat smaller (between 1 and 58%) compared to the Netherlands (between 4 and 68%). The overall shape is however similar. There is the same funnel shape that is widening the more capacity is added.
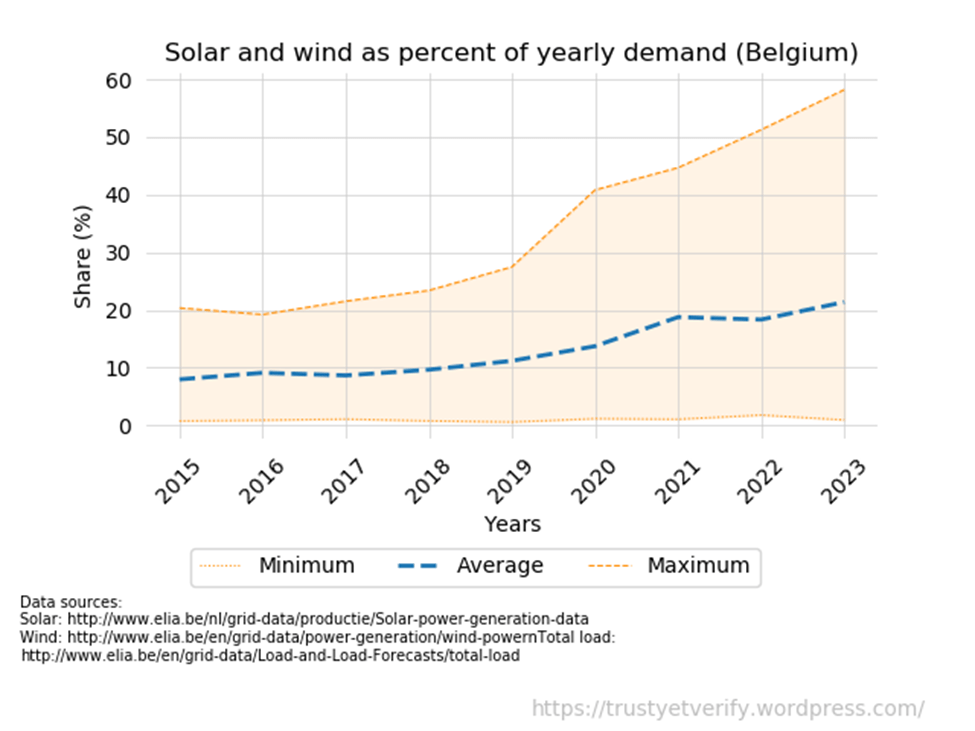
The following graphic illustrates the problem well.
Now it is easier to highlight a bit more the wide range that this average is derived from. These are the minimum and maximum values of the share of solar and wind in demand of each year:
It is clear that the lower and upper boundaries don’t increase in the same way The lower boundary is hardly budging, it keeps close to the x-axis over the entire period. In 2022, the lowest daily share supplied by solar and wind was only about 1% of total demand. This didn’t change much over the years: it was roughly between 0.7% and 1.8% of demand between 2014 and 2022. This tells us that a lot of dispatchable capacity will still be needed at specific times of the year (in this case, pretty close to the expected demand and, looking at its shallow slope, that might be the case for quite a while).
The upper boundary behaves different. It shoots up exponentially. In 2022, the highest daily share supplied by solar and wind was 58% of total demand, coming from around 20% in 2014.
Meaning that the difference between the lower and upper boundary will keep increasing over time. Basically, electricity production by solar and wind will at times start to exceed demand, while the need for backup at specific times of the year will stay high.
The key point illustrated in this graph is that over building wind and solar does not help much for those periods when wind and solar resources are low due to the weather.
Some people also seem to recognize this type of dynamic. Already the first comment below the tweet nails it (translated from Dutch):
If we now just install three times as much, then we have more than twice too much at the peak and are almost 90% short at the lowest point.
I couldn’t have said it better.
Discussion
Based on every study of intermittent wind and solar that I have seen, the difference between the lower and upper boundary of wind and solar output will keep increasing over time as these resources are added to any electric system. New York is not as bad as Belgium and Netherlands but it is the reason that the New York IRM will increase from around 20% to on the order of 150% in 2040. The reason for this universal truth is that meteorological conditions that cause light winds are geographically large. When the wind is light at one site in New York it is very likely that winds are light across the state. Data from Australia shows a similar effect across that entire continent.
There are a couple of ramifications. First, overbuilding is not a complete solution. Grid operators must always match load with generation. Therefore, resource adequacy planning must have a solution even at the minimum wind and solar generation output. If the overall state-wide wind generation capacity is only 10% you would need to overbuild by a factor of ten to provide power at night. Aside from the cost I believe that amount of wind development exceeds the expected wind resource availability in New York. In order to address this a new technology is needed. The New York State Public Service Commission (PSC) recently initiated an “Order initiating a process regarding the zero-emissions target” that will “identify innovative technologies to ensure reliability of a zero-emissions electric grid” for this reason.
The other part of the problem is that when wind and solar resources are over-built there will be more and more periods when their output exceeds demand. When that happens the electricity market has issues. Many wind and solar contracts are written such that the operators are paid whether or not the energy produced is needed. For example, the Ontario Independent Electricity System Operator must get rid of the unneeded power by selling it to neighboring control areas at below market costs. New York is a big purchaser of this cheap power. While those purchases drive costs down for ratepayers it also adversely affects the viability of in-state generating facilities. On the other hand, during the light wind conditions in-state generating facilities are needed so it may reach the point that they have to be subsidized to be available. Eventually New York will be in a similar position to Ontario. It turns out that the low- price sales are subsidized by Ontario ratepayers. When everyone has over-built I also wonder where the excess power will be dumped.
Conclusion
The graph of solar and wind generation resources as a fraction of the total resources shows a characteristic shape that proves that over building wind and solar generation does not help always fulfill load requirements. Electric grid operators must match the output of generating resources at all times so this means the problem has to be addressed. Further compounding the problem is the fact that peak loads are associated with temperature extremes that are linked to high-pressure systems that also create light winds. In other words the over-building effect is most pronounced when energy demand peaks exacerbating the risks to reliability when electricity is needed most.
At least one commenter understands the problem when he said “If we now just install three times as much, then we have more than twice too much at the peak and are almost 90% short at the lowest point”. I agree with Opdbe – I couldn’t have said it better.
The unanswered questions are how will the Climate Act implementation address this problem, what will it cost, and will it be able to maintain current standards of reliability.
I am a meteorologist (BS and MS degrees), was certified as a consulting meteorologist and have worked in the air quality industry for over 40 years. I author two blogs. Environmental staff in any industry have to be pragmatic balancing risks and benefits and (https://pragmaticenvironmentalistofnewyork.blog/) reflects that outlook. The second blog addresses the New York State Reforming the Energy Vision initiative (https://reformingtheenergyvisioninconvenienttruths.wordpress.com). Any of my comments on the web or posts on my blogs are my opinion only. In no way do they reflect the position of any of my past employers or any company I was associated with.
View all posts by rogercaiazza
4 thoughts on “The Problem with Overbuilding Wind and Solar”
The ramifications you describe in the discussion section are really interesting. Meteorological conditions can indeed be geographically large. We experienced this numerous times in the past. When Belgium experiences a lot of sun and wind, then also the Netherlands and Germany (and other neighboring countries) will likely experience the same conditions. For example, the current strategy of Germany is to export excess electricity abroad at cheap to negative prices when there is plenty of sun and wind, but when all/most neighboring countries going for solar and wind, then they all will encounter the same problem at the same time and this strategy will become problematic.
The reverse is also true. If there is not much sun and wind in Belgium, chances are that there is not much sun and wind in our neighboring countries. If we all focus on solar and wind, where do we get all our electricity from in case of a dunkelflaute over a large part of West Europe? That is the consequence of that lower part of the graph that doesn’t grown that much over the years. Such periods of dunkelflautes might last just a couple days to a couple weeks, but at that moment enough dispatchable capacity needs to be available. Unfortunately, we are in the process of dismantling this capacity in favor of intermittent capacity.
On a different note, opdbe is not my name. It is something that was concocted by my previous email provider and initially I was not aware that WordPress had it incorporated in my account when I used that email address to set up my account. It doesn’t mean anything, also not in Dutch, and therefor it is a bit amusing to see it used as my name. My actual name is longer than that and most probably pretty difficult to pronounce by non-Dutch speakers. Just call me Michel, most people do so.
LikeLike