

I have been meaning to write this article for several months. In September Parker Gallant noted that industrial wind turbines (IWT) in Ontario “show up at the party, almost always, after everyone has left” in a post that described poor performance of the province’s wind turbines over a five day period in September. I looked at New York data, found that wind data was also poor in the state at the same time, and planned to do a post. Other issues came up but a recent Dunkelflaute wind lull in Germany has spurred me to complete the post. Better late than never, here it is.
I have followed the Climate Leadership & Community Protection Act (Climate Act) since it was first proposed, submitted comments on the Climate Act implementation plan, and have written over 470 articles about New York’s net-zero transition. The opinions expressed in this article do not reflect the position of any of my previous employers or any other organization I have been associated with, these comments are mine alone.
Overview
The Climate Act established a New York “Net Zero” target (85% reduction in GHG emissions and 15% offset of emissions) by 2050. It includes an interim 2030 reduction target of a 40% GHG reduction by 2030. Two targets address the electric sector: 70% of the electricity must come from renewable energy by 2030 and all electricity must be generated by “zero-emissions” resources by 2040. The Climate Action Council (CAC) was responsible for preparing the Scoping Plan that outlined how to “achieve the State’s bold clean energy and climate agenda.” The Integration Analysis prepared by the New York State Energy Research and Development Authority (NYSERDA) and its consultants quantified the impact of the electrification strategies. That material was used to develop the Draft Scoping Plan outline of strategies. After a year-long review, the Scoping Plan was finalized at the end of 2022. Since then, the State has been trying to implement the Scoping Plan recommendations through regulations, proceedings, and legislation. Unfortunately implementation efforts to date have short-changed addressing issues that have been identified.
Dunkelflaute
The German description of a wind and solar resource lull is Dunkelflaute. Iowa Climate Science Education explains that the term refers to “dark doldrums”. A large high pressure system has recently affected wind and solar resources in Europe. Daniel Wetzel notes that:
At 5 p.m. on Wednesday, solar power was only supplying a single megawatt hour. The 1602 offshore wind turbines in the North and Baltic Seas – each one the size of the Eiffel Tower – were at a complete standstill. Zero electricity production.
Earlier in the week the British electric system faced a similar situation.
Ontario Dunkelflaute
Parker Gallant’s article provided a great example:
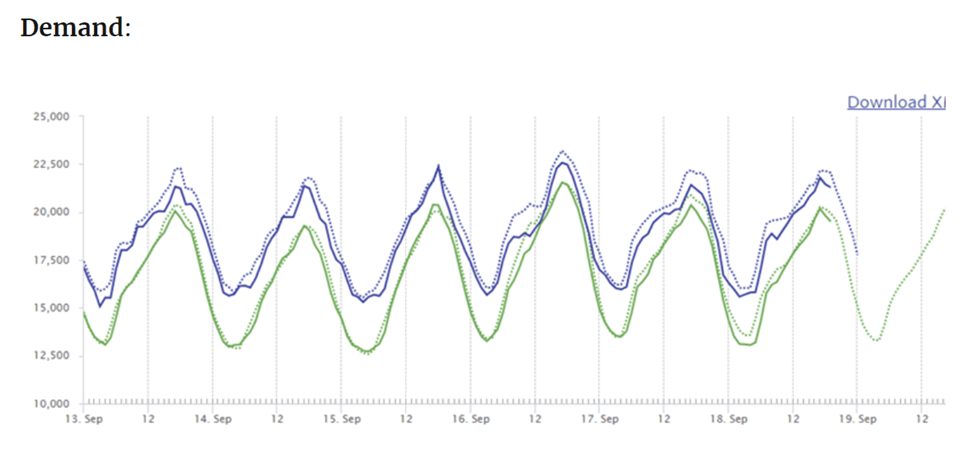
Looking at the following IESO Power data chart from September 13th to late in the day on September 18th it is evident Ontario Demand (solid green line) clearly demonstrates the daily swings in Ontario demand during those “summery” days. It is evident, demand fluctuates by almost 6,000 MW from the middle of the night to later in the day! Those swings in demand are even higher when you examine the data in respect to “market demand” (blue line) which reflects our imports and exports via our intertie connections with our neighbours.
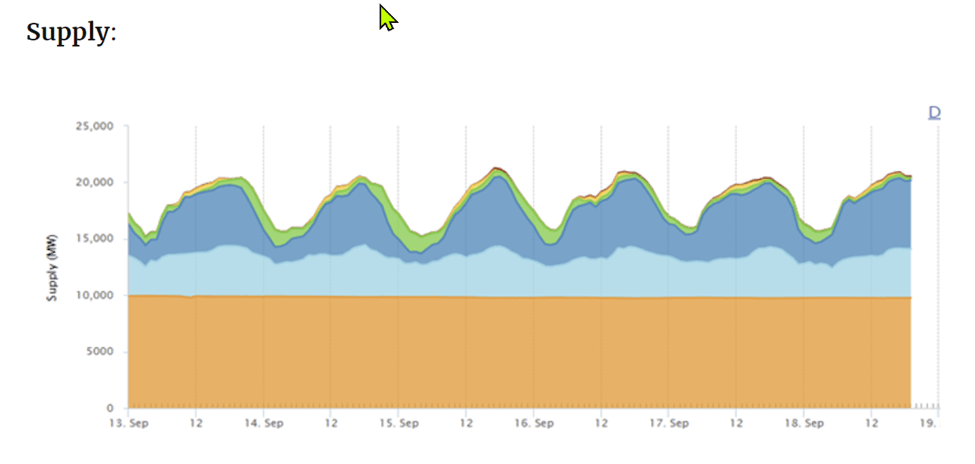
From the top of the chart: the tiny “red” represents biofuel generation and “yellow” represents generation supplied by solar panels. The “green” tells us what those industrial wind turbines are generating hourly! The “dark blue” is generation from our natural gas plants and the “light blue” is power being supplied by our hydro generation stations some of which are classified as “baseload”! The solid unwavering “orange” represents what our baseload nuclear plants provide us with!
He describes the charts:
Looking at the six days illustrated, the highest peak demand occurred September 16th reaching 21,547 MW at Hour 17 (hour ending at 5 PM) and the lowest peak demand was September 14th reaching 19,288 MW at Hour 17! Interestingly Hour 17 was the peak hour on all six days.
As the Supply chart clearly demonstrates those natural gas plants (dark blue) fluctuated widely as needed to ensure we were able to avoid blackouts each and every day by either ramping up or ramping down as required! Hydro generation also played a role by also modestly, ramping up or down in addition to supplying some of the baseload.
Gallant went on to describe how the IWT performed:
Well, the high for generation by those IWT occurred at Hour 24 (ending at midnight) September 14th when they generated 2,199 MWh or 44.8% of their capacity and the low generation occurred at Hour 11 on September 13th when they only managed to generate 22 MWh or 0.5% of their capacity. Interestingly at Hour 24 on September 14th IESO reported our net-exports were 2,956 MWh at the low price of $24.07/MWh so we apparently didn’t need that power and were forced to sell it off for a cheap price! Also IWT over the six days hit their peak generation at Hours 23, 24 or Hour 1 when peak demand is always near its lowest for each and every day! Coincidently their low generation over the same 6 days occurred at either Hours 10 or 11 when demand is accelerating!
New York Wind Data
I attempted to access the Ontario IESO generation data for the period but could not find it. On the other hand, the New York Independent System Operator (NYISO) provides access to their data. New York fuel-mix load available at the NYISO Real-Time Dashboard where there is a link to historical data.
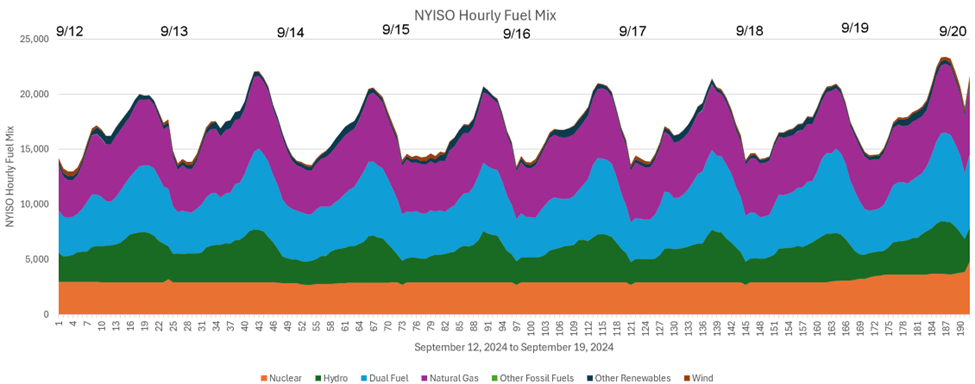
The Real-Time Fuel Mix panel includes links to current and historical five-minute generation (MW) for energy generated in New York State. I processed that data to calculate hourly averages. The generator types include “Hydro” that includes pumped storage hydro; “Wind”, mostly land-based wind but does include 136 MW of offshore wind; “Other Renewables” that covers solar energy (394 MW of “front-of-the-meter solar”), energy storage resources (63 MW), methane, refuse, or wood; “Other Fossil Fuels” is oil; “Nuclear”; “Natural Gas”; and “Dual Fuel” which are units that burn both natural gas and oil. As an aside, oil capability is maintained as a reliability measure.
The following graph shows the hourly fuel type generation throughout the period. Note that there are similarities with the Ontario data. New York does not have as much nuclear, but both control areas use it as solid, unwavering baseload power. New York hydro has more diurnal variation because there are pumped storage hydro facilities used for load following. In both control areas natural gas is relied on to provide power when needed. New York has dual-fuel units that probably burned natural gas during this period.
The focus of this article is the Dunkelflaute, so the wind data are of most interest. The following figure lists the wind data only. Because I could not combine data sets, we can only consider a qualitative comparison between New York and Ontario. The wind output is the similar – low when needed most and picking up when demand drops.
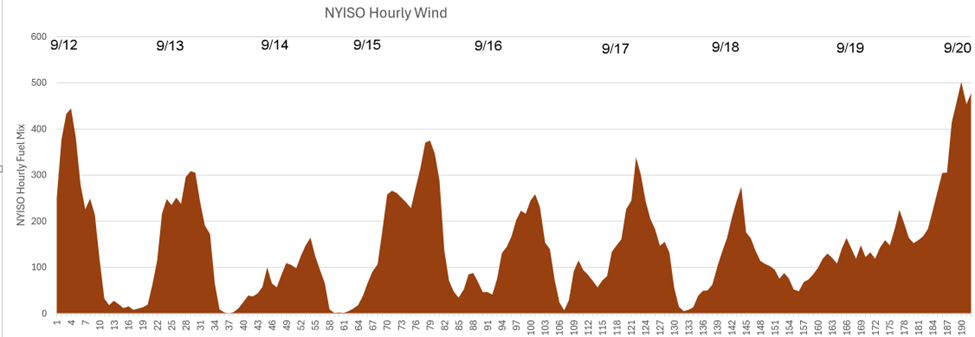
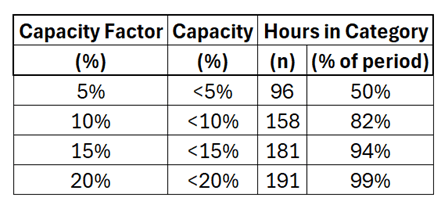
Because I have access to the actual data, I can summarize just how bad the wind was over this 192-hour period. New York has 2,454 MW of wind capacity. The maximum wind capacity occurred on 19 September at hour 21 when 502 MW of wind power was generated, an unimpressive 20.5% of the total capacity. The minimum wind capacity occurred on 13 September at hour 12 when 0.2 MW of wind power was generated. I summarized the hourly totals by category in Table 1. There were 96 hours representing half the period when the capacity of all the wind generation in New York was less than 5%. All but one of the hours had a capacity factor of less than 20%.
Table 1: Categorial Hourly Totals for New York State Wind Power from 12 September 2024 hour 0000 to 19 September 2024 hour 2300
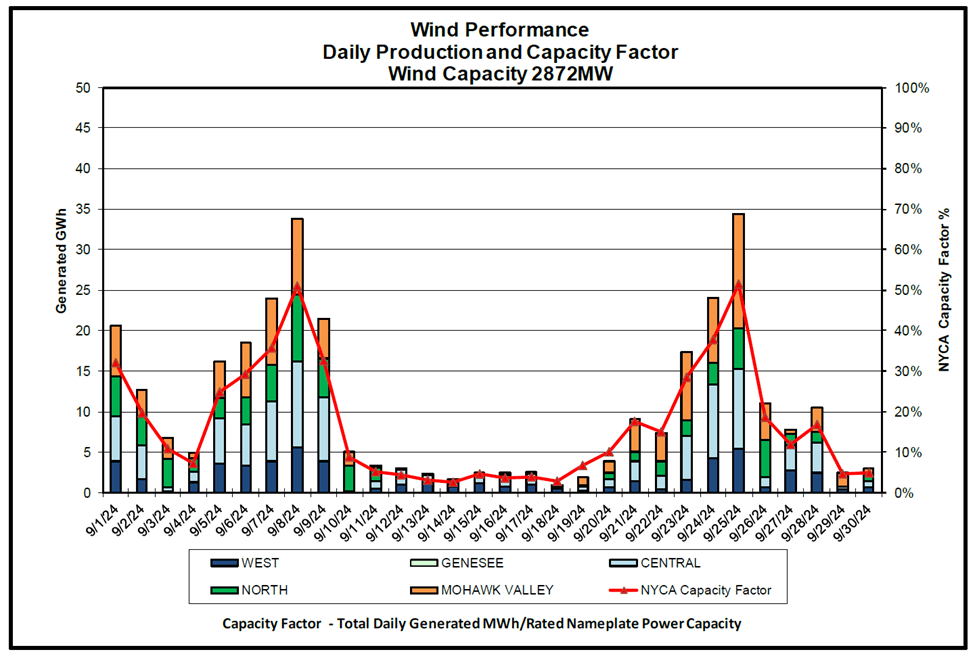
The NYISO Operations Report for September 2024 Wind Performance Figure shows daily wind production over the entire month. Those data show that the daily capacity factor was less than 10% from 9/10/24 to 9/20/24.
Discussion
In my opinion, climate scientists tend to over-emphasize potential global warming drivers when explaining weather observations. For example, I saw a news segment where a climate scientist claimed that warmer temperatures associated with global warming increased the rainfall associated with Hurricane Helene in western North Carolina by 15 to 20% exacerbating the flooding. Baloney, I say. The supposed rationale is that warmer weather increases the amount of moisture that the atmosphere can hold and climate change models are used provide numbers for these attribution statements. I addressed the Helene hype claims earlier. Given that there was a storm in 1916 that produced higher flood levels I don’t think that moisture content was the primary driver for the flood. Instead, I believe that an unusual weather pattern caused the storm to stall over the region. Even if there was some greater water capacity effect, it was small relative to the weather pattern impact.
My whole diatribe was a lead-in to make a point about weather patterns and the observed data in September 2024. Light winds over 11 days are only possible if there is a large, slow-moving high-pressure system. I have never seen any observational analyses claiming that they are trends in this kind of weather pattern.
More importantly, there are implications of these observations relative to the Climate Act transition to an electric system that relies on wind, solar, and energy storage capacity. The fact that all of the New York wind generation only produced 0.2 MW during one hour must mean that the stagnant high pressure system was at least as big as New York including the offshore wind facility south of Long Island. It is hard to conclusively pick out the Ontario wind generation during the worst hour but it appears that there is very little wind generation at that time. I maintain that to fully understand the geographical implications that a detailed analysis of meteorological data and expected wind and solar generation for New York and all the adjoining electric system control areas is necessary. Lastly, I believe that the weather pattern that caused this wind lull could occur at any time of the year. It may be more likely during certain times of the year but there is no reason that similar conditions could occur anytime. This exacerbates the problem because the high-pressure systems that cause light winds often are accompanied by the most extreme temperatures which are when the observed peak loads occur.
My primary reliability concern is the challenge of providing electric energy during these periods of extended low wind and solar resource availability. This period perfectly exemplifies this kind of extended wind lull period. To address this problem the organizations responsible for New York State electric system reliability agree that a new Dispatchable Emissions-Free Resource (DEFR) is need as described here. In addition to the geographical considerations noted above, planning for must evaluate as long a period as possible. That work must consider when wind and solar can charge energy storage capacity and when short-term energy storage must be discharged to meet system requirements. The challenge of that analysis is obvious when looking at these wind output graphs.
Conclusion
The Dunkelflaute wind lull phenomenon occurs worldwide. The comparison of Ontario and New York data shows that these conditions can cover both jurisdictions. The New York data show the severity of the wind lull. It is essential that electric system planners consider the impacts of the Dunkelflaute. I believe that New York is addressing this issue. However, I will only feel comfortable that they have considered the worst-case situation when they assess a longer period of data covering adjacent electric system control areas.
Unfortunately, clean energy advocates continue to dismiss the extent of the problem. Even worse, some do not acknowledge that wind, solar, and energy storage cannot be relied on during those periods and that when the power is needed the most it is most likely to be in a resource lull. These advocates are simply wrong and should be ignored.

Great analysis and demonstrates how when that wind lull hits it often affects a large area. To make it even more concerning Ontario and New York have intertie lines that allow us to either buy or sell power from each other but when the Dunkelflaute hits neither Ontario or New York can be counted on to help out our neighbours!
LikeLiked by 1 person
Sorry I missed putting my name before hitting reply. It is Parker Gallant!
LikeLiked by 1 person