

Note – Table 2 was corrected on May 25, 2025 at 21:30 EDT
Last year I published an article describing the New York Independent System Operator (NYISO) Load & Capacity Data Report (also known as the “Gold Book”) and how I used it. This post uses the latest edition to determine the wind and solar capacity factors last year.
I am convinced that implementation of the Climate Act net-zero mandates will do more harm than good because the energy density of wind and solar energy is too low and the resource intermittency too variable to ever support a reliable electric system relying on those resources. I have followed the Climate Act since it was first proposed, submitted comments on the Climate Act implementation plan, and have written over 500 articles about New York’s net-zero transition. The opinions expressed in this article do not reflect the position of any of my previous employers or any other organization I have been associated with, these comments are mine alone.
Overview
The Climate Act established a New York “Net Zero” target (85% reduction in GHG emissions and 15% offset of emissions) by 2050. It includes an interim reduction target of a 40% GHG reduction by 2030 and a mandate for zero-emissions electricity by 2040. The Climate Action Council (CAC) was responsible for preparing the Scoping Plan that outlined how to “achieve the State’s bold clean energy and climate agenda.” After a year-long review, the Scoping Plan was finalized at the end of 2022. Since then, the State has been trying to implement the Scoping Plan recommendations through regulations, proceedings, and legislation.
.
Capacity Factor
The capacity factor is a useful metric to understand electric generation resources. The annual capacity factor for a generator equals the actual observed generation (MWh) divided by maximum possible generation (capacity in MW times the hours in a year). Projections for the amount of future wind and solar generation capacity needed for the Climate Act depend on capacity factor assumptions.
Not surprisingly, the aspirational schedule of the Climate Act has proven to be more difficult to implement than planned and many aspects of the transition are falling behind. Worse, there has not been any indication that the Scoping Plan is being refined to incorporate the lessons learned in the years since it was drafted or address any of the issues raised in the comments. The capacity factor assumptions are a prime example of an issue that needs to be addressed.
Wind and Solar Capacity Factor Projections
I have previously summarized future resource projections. The New York Independent System Operator (NYISO) 2021-2040 System & Resource Outlook is part of the NYISO Comprehensive System Planning Process. That analysis included several scenarios for the future grid that includes capacity factor projections. The Integration Analysis also included several scenarios and capacity factor projections. In both instances the capacity factor projections determine how much wind and solar capacity will be needed in the future.
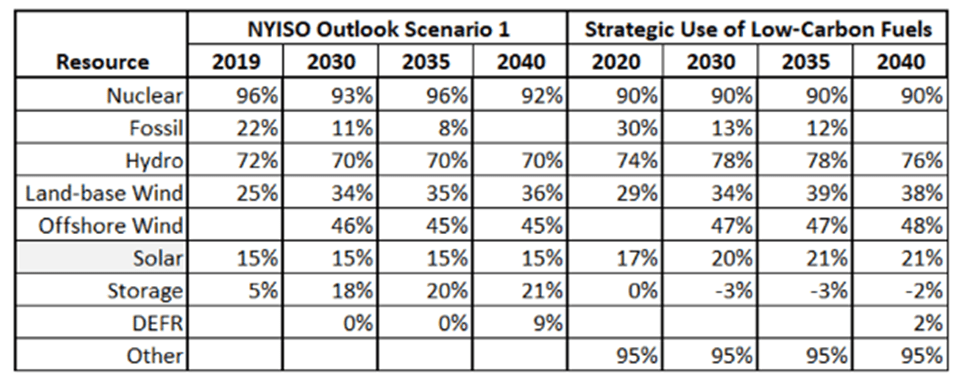
I am not the only one who submitted comments about the Scoping Plan capacity factors. I pointed out that the Integration Analysis land-based wind capacity factors were unrealistically high. The model projected the 2020 generation with a capacity factor of 29% but the 2021 observed capacity factor was only 22%. The Integration Analysis model could not even get the starting year correct. As a result, the Integration Analysis projections for the land-based wind capacity needed to meet the load are too low. It is particularly disturbing that the State has never attempted to reconcile the NYISO projections and assumptions with the Integration Analysis. For all renewable resources the Integration Analysis capacity factors are higher than the NYISO projections as shown in Table 1.
Table 1: Capacity Factors (%) NYISO Outlook Study S-1 and Integration Analysis Mitigation S-2
2024 Wind and Solar Observed Capacity Factors
The New York Independent System Operator (NYISO) 2024 Load & Capacity Data Report (also known as the “Gold Book”) is now available and has been posted on the NYISO website: 2025 Load & Capacity Data Report (Gold Book). Many of the most useful tables are also provided as spreadsheets. The following supplemental materials have also been posted:
- 2025 NYCA Existing Generating Facilities
- 2025 Gold Book Lower Demand Scenario Tables
- 2025 Gold Book Higher Demand Scenario Tables
- 2025 Gold Book Forecast Graphs
- 2025 Gold Book Baseline Forecast Tables
The Existing Generating Facilities spreadsheet was used to calculate New York capacity factors. Table 2 sums the capacities and net energy for all the combinations of primary fuel type and secondary fuel type for all the generators tracked by the NYISO. This includes units that are in the market system as well as others that are not. The nameplate capacity of generating units that use natural gas and can also burn number 2 fuel oil is the largest category in the state.
Table 2: 2025 NYISO Gold Book Tables III – 2a NYISO Market Generators and Table III – 2b Non-Market Generators 2023 Capacity, Energy, and Capacity Factors
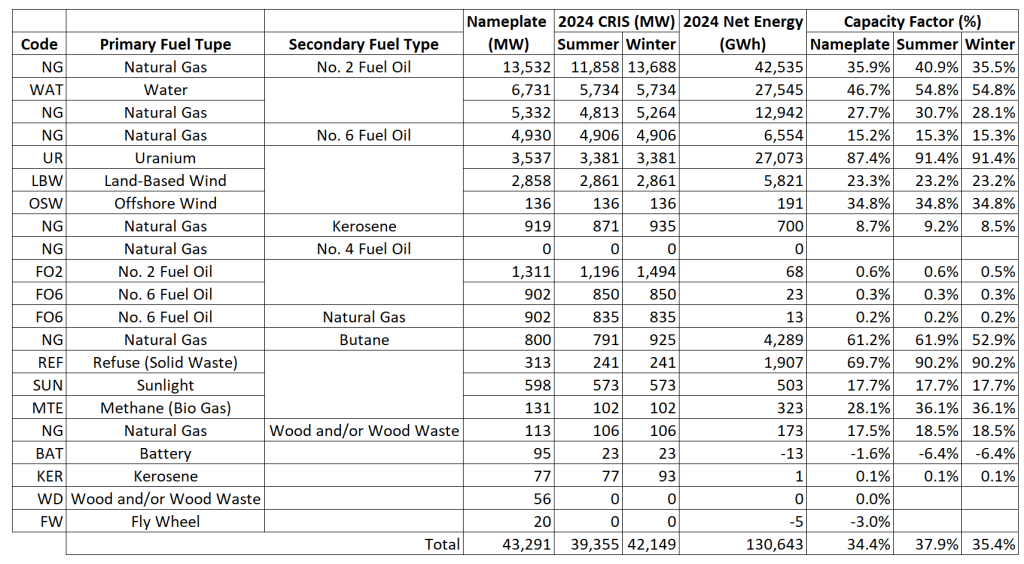
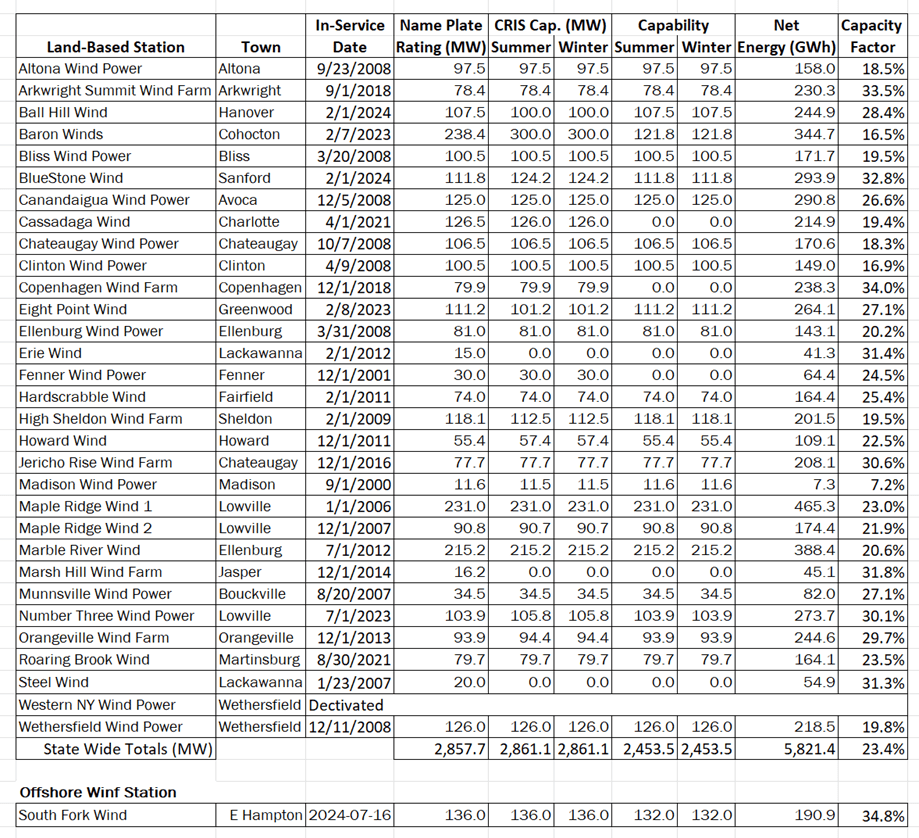
Table 3 lists the capacity data and net energy produced for the wind generating units in New York. Note that the Western NY Wind Power site was deactivated and that the offshore Southfork Wind Farm came on line on July 16, 2024. Using the data, it is possible to calculate the capacity factors for each facility. The NYISO Resource Outlook and the Integration Analysis both assume a land-based 34% capacity factor in 2030. Only one wind farm exceeded 34% and there were seven more that were over 30% capacity of the 30 wind farms in New York. In 2023 two exceeded 34% and three exceeded 30%. The overall capacity factor was up from 21.8% to 23.4%. To achieve the assumed capacity factor for 2030 most of the existing onshore wind farms will have to be replaced. The Integration Analysis does not retire any of the existing wind farms which I suspect is so that the cost estimate does not have to include those costs.
One of the oft-touted benefits of offshore wind is that it will have higher capacity factors. The NYISO Resource Outlook and the Integration Analysis both assume offshore wind capacity factors of at least 45% in 2030. The annual observed capacity factor was only 34.8%. I assumed that the full capacity was available on the in-service date. That might explain why the offshore wind capacity is so low.
Table 3: NY 2024 Wind Facilities in the 2025 Gold Book
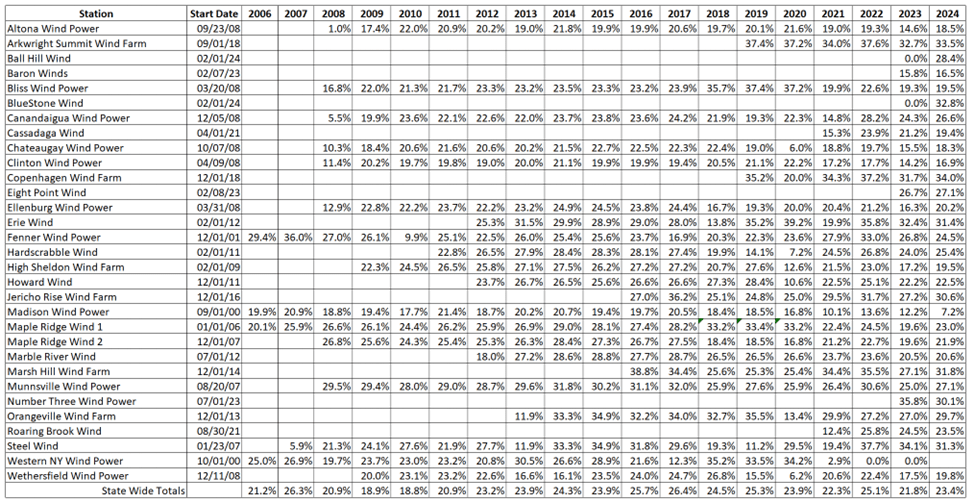
I have been tracking the wind farm capacity factors since 2006 as shown in Table 4. There is nothing to suggest that 2024 was an abnormal year. To meet the 2030 projections these wind farms are going to have to be replaced or a large number of wind farms with much higher capacity factors that will bring the average up will have to be built. The data shown are also interesting as they show large interannual variation by site and the state overall. Finally note that the NYISO wind capacity factor for 2019 was modeled as 25% but the observed capacity factor was 22.3%. The Integration Analysis did not get their first year correct either. It modeled the 2020 capacity factor as 29% but the observed capacity factor was only 23.9%.
Table 4: New York State Onshore Wind Facility Capacity Factors Based on NYISO “Gold Book” Load & Capacity Data Reports Table III-1
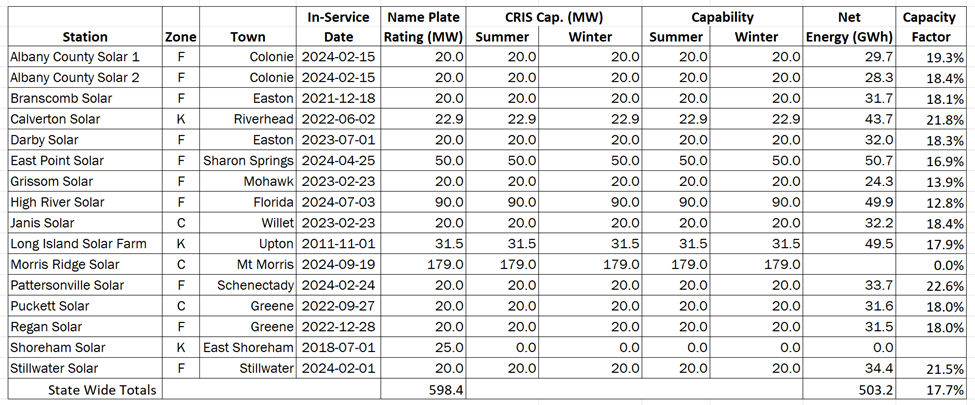
In 2024 the capacity factor of the solar facilities in New York was 17.7%, the highest capacity factor was 22.6% and the lowest capacity factor was 12.8%. The NYISO assumed a capacity factor of 15% from 2019 to 2040. On the other hand, the Integration Analysis assumed a capacity factor of 17% in 2020, increasing to 20% by 2030 so they expected a capacity factor of 18.2% in 2024. The observed capacity is less than the Integration Analysis.
Table 5: NY 2024 Utility-Scale Solar Facilities in the 2025 Gold Book
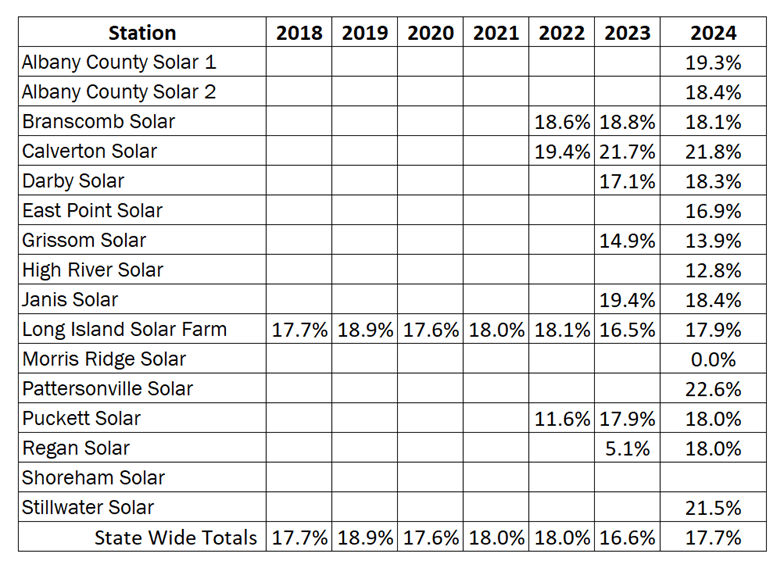
I have been tracking the industrial solar facility capacity factors since 2018 as shown in Table 6 but until 2022 there was only one reporting facility. There is nothing to suggest that 2024 was an abnormal year.
Table 6: New York State Utility-Scale Solar Facility Capacity Factors Based on NYISO “Gold Book” Load & Capacity Data Reports Table III-1
Discussion
The NYISO has interesting generation resource information available in its Gold Book. As shown here, that information can be used to calculate the capacity factors for wind and solar resources in New York. The annual wind capacity factors observed are consistently lower than the values used in the Integration Analysis which is being used to implement the state plan to meet the Climate Act mandates. Solar is better but the statewide capacity factor is less than the Integration Analysis projection in 2024 As a result, The Scoping Plan is underpredicting the wind and solar resources necessary to generate the energy they project will be needed. That means that their cost projections are too low.
It is troubling that the differences shown here between the NYISO capacity factors and the Integration Analysis capacity factors have not been reconciled. Worse, none of the differences between the two sets of projected resource projections have been addressed. This matters not only because the differences affect the projected outcomes and the costs, but also because Integration Analysis projections are being used for the New York Cap-and-Invest (NYCI) Program proposal.A key component of the NYCI plan is the trajectory for allowance allocations. NYCI’s reduction trajectory is based on the Integration Analysis and the overly optimistic capacity factors used means that they are projecting lower emissions than is likely to occur. That imbalance could have significant consequences to the allowance market.
One other point is that these are annual metrics. In order to assure that the electric grid will be able to provide energy when it is needed the most the NYISO must deal with resource availability over shorter periods. Think of it as the capacity factor over the coldest week of the year. That is a much more difficult issue and one that the Scoping Plan did not address and has not been addressed by the Public Service Commission.
Conclusion
This post documents the most recent wind and solar capacity factors observed in New York. It is notable that the wind data show a lot of interannual variation that should be considered when projecting future resource availability. Historical data have not been incorporated into an updated analysis of the generating resources needed to achieve the Climate Act goals.
I have long argued that the State’s plans for implementing the Climate Act mandates must include a feasibility study that could address the observed variability and lower capacity factors. Given the tremendous uncertainties like these shown here, I have recently decided that a feasibility study is not enough. No jurisdiction anywhere has successfully demonstrated an electric grid that depends on wind and solar to the extent that the Scoping Plan does. Before New York goes any further it should prove it can be done with a demonstration project. Anything less risks catastrophic blackouts and enormous costs.

Energy Returned on Energy Invested (ERoEI) shown here or cost benefit analysis – all show nuclear, hydro, and gas are by far the most efficient – plus they do no destroy forest, farmland, wetlands, recreation, home building and quality of life.
LikeLiked by 1 person