

This post describes the latest New York State (NYS) GHG emission inventory report that provides data through 2023. A recent post explained why the Climate Leadership & Community Protection Act (Climate Act) 2030 target for a 40% reduction of greenhouse gas (GHG) emissions from 1990 levels was impossible. It included GHG emissions data through 2022 so this report updates that assessment. It also describes implications of other aspects of the inventory results.
I am convinced that implementation of the New York Climate Act net-zero mandates will do more harm than good if the future electric system relies only on wind, solar, and energy storage because of reliability and affordability risks. I have followed the Climate Act since it was first proposed, submitted comments on the Climate Act implementation plan, and have written over 600 articles about New York’s net-zero transition. The opinions expressed in this article do not reflect the position of any of my previous employers or any other organization I have been associated with, these comments are mine alone.
Overview
The Climate Act established a New York “Net Zero” target (85% reduction in GHG emissions and 15% offset of emissions) by 2050. In addition GHG emissions are supposed to be 40% lower than the 1990 baseline. The Climate Action Council (CAC) was responsible for preparing the Scoping Plan that outlined how to “achieve the State’s bold clean energy and climate agenda.” The Scoping Plan was finalized at the end of 2022. Since then, the State has been trying to implement the Scoping Plan recommendations through regulations, proceedings, and legislation.
NYS GHG Emissions
The New York State Department of Environmental Conservation (DEC) released the 2025 statewide GHG emissions report (2025 GHG Report) at the end of November, a month earlier than recent releases. DEC is required by the Climate Act to follow unique inventory requirements. Four years ago I published an overview post of this greenhouse gas (GHG) inventory that described things that maximize emissions in an apparent attempt to make GHG emissions as large as possible.
The 2025 GHG Report includes the following documents:
- Summary Report (PDF)
- Sectoral Report 1: Energy (PDF)
- Sectoral Report 2: Industrial Processes and Product Use (PDF)
- Sectoral Report 3: Agriculture, Forestry, and Land Use (PDF)
- Sectoral Report 4: Waste (PDF)
The Summary Report for the GHG Inventory gives an overview of the highlights.
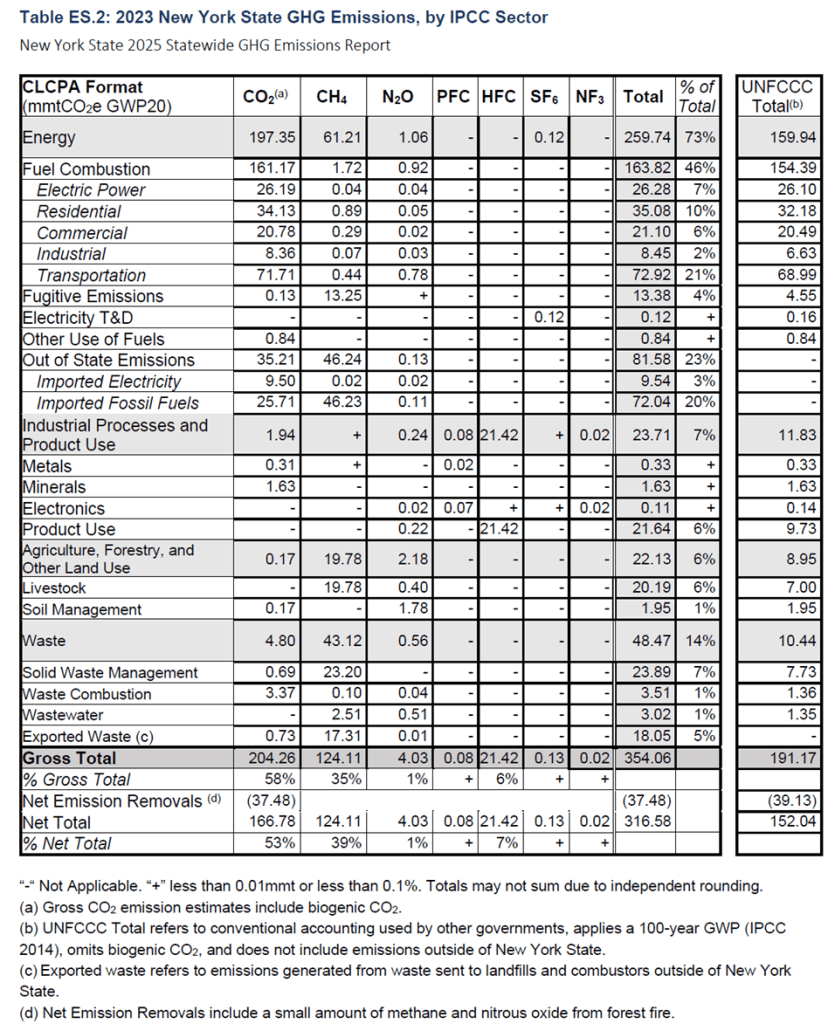
In 2023, statewide gross GHG emissions were 354.06 million metric tons of carbon dioxide equivalent GHGs (mmt CO2e) using CLCPA accounting. Total gross emissions in 2023 were 14.8% lower than the 1990 baseline in this report and 13.6% below the 1990 statewide emission baseline adopted in regulation in 2020. Carbon dioxide (CO2) and methane (CH4) comprised the largest portion of emissions by gas, 58% and 35% respectively, and energy was the largest source of emissions (73%). Net emissions were 316.58 mmt CO2e in 2023, which includes a net 37.48 mmt CO2e removed.
Note that the 1990 total gross emissions calculated in this analysis were different than the those calculated when the 1990 statewide emission baseline was adopted in regulation in 2020. The implications of this will be discussed later in this post. The Summary Report goes on:
Emissions in New York State in 2023 have mostly recovered from the effects of the 2020 COVID-19 pandemic. As noted in the two previous versions of this report, 2020 emissions were not considered representative and were expected to normalize to broader trends in future reports. Annual gross emissions in 2023 were less than 0.1% higher than in 2022 and 4% lower than the pre-pandemic levels in 2019. This trend is primarily the result of energy sector changes. Energy emissions in 2023 were 10% higher than in 2020, and 1% lower than in 2022. Within the energy sector, these trends were driven by the gradual recovery of energy sector subsectors such as transportation and a change in electricity generation sources. Some of the trends in energy emissions are also affected by seasonal weather patterns and interannual differences in the demand for heating or cooling.
When a New York state agency says “change in electricity generation sources” they cannot state the obvious that this is the result of poor energy policy. The changes in sources were caused by the politically motivated decisions to shut down two zero emissions Indian Point nuclear units and reject the permits to repower old and inefficient natural gas fired power plants. The Draft Energy Plan and multiple New York Independent System Operator reports clearly show that both nuclear power and fossil generation resources are needed to maintain electric system reliability.
The Summary Report goes on:
Greenhouse gas emissions from the extraction, processing, and transmission of imported natural gas greatly decreased for years 2020-2022 relative to the 2024 Statewide GHG Emissions Report due to updated data and methodology. This report uses an updated fuel lifecycle analysis model made available by the National Energy Technology Laboratory (NETL 2025) that estimates GHG emissions from natural gas systems based on year 2020 operating conditions. Note that use of the updated model reduced statewide greenhouse gas emission totals for years 2020-2022 compared to the totals included in the 2024 Statewide GHG Emissions Report. More details about the changes to the data and methodology underlying imported natural gas emissions are included in Sectoral Report #1: Energy.
Two points to keep in mind about this paragraph. New York’s unique GHG emission accounting methodology not only includes the use of different global warming potential but also includes upstream emissions. This means that most results cannot be compared to other jurisdictions. The second point is that this inventory relies on emission factors instead of direct emission measurements. As a result, updates to data and methodology mean that emission totals change. This will be discussed below.
2023 GHG Emissions
Table ES.2 in the Summary Report presents emissions for different sectors and different greenhouse gases. There are four Intergovernmental Panel on Climate Change (IPCC) sectors and there are four sectoral reports for energy, industrial processes and product use, agriculture, forestry and land use, and waste. The table also includes United Nations Framework Convention on Climate Change (UNFCCC) totals that use the “conventional accounting used by other governments, applies a 100-year GWP (IPCC 2014), omits biogenic CO2, and does not include emissions outside of New York State.” These are the only data that can be compared to other jurisdictions.
In my recent post I claimed that the 2030 40% emission reduction target was impossible. According to the Final DEC Part 496 regulation, 1990 emissions were 409.78 MMTCO2e. I used DEC’s 2024 Statewide GHG Emissions Report, covering data through 2022, that revealed that New York emissions as of 2022 were 371.08 million metric tons of carbon dioxide equivalent (MMTCO2e) from Table ES.2 in the 2024 report. Using these numbers NYS had only achieved a 9.3% reduction in gross GHG emissions from 1990 levels. Table ES.2 in the 2025 report states that NY emissions were 354.06 MMTCO2e) at the end of 2023.
2030 40% Reduction Mandate
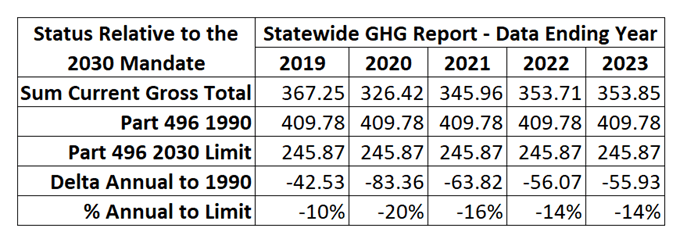
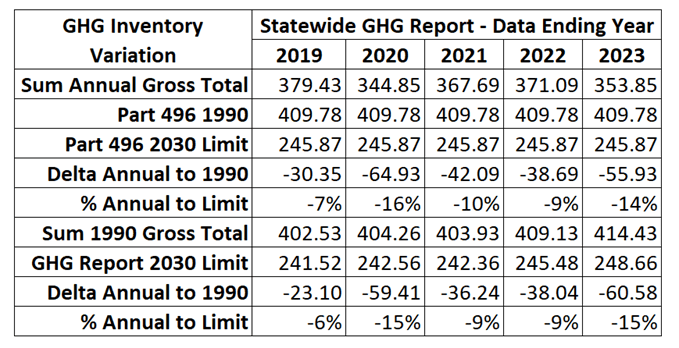
The Climate Act requires a 40% reduction of GHG emissions by 2030. Table 1 compares the current GHG inventories performance relative to th4 40% reduction mandate. At the end of 2023 the reductions since 1990 using the Part 496 state limit were only 14% lower. The fact that 2022 had slightly higher emissions reinforces the observation that the 2030 goal is impossible.
Table 1: Statewide GHG Emission Inventory Report Emissions Relative to Climate Act 2030 Mandate (mmt CO2e GWP20)
Emission Reduction Trend
The 2025 GHG Report describes emission trends:
Total statewide gross emissions in 2023 were 14.8% below 1990 and 24.5% below 2005 levels, when assessed using CLCPA accounting and the most up-to-date methodologies. Figure ES.1 shows overall trends in statewide emissions by gas on an annual basis, including gross and net emission totals, as well as the emission limits for 2030 and 2050 pursuant to ECL § 75-0107 and 6 NYCRR Part 496. Statewide emissions are 13.6% below the 1990 baseline used in the Part 496 regulation. Statewide emissions for 2020 are also described in this report but are not representative of historic nor current conditions due to the impacts of the COVID-19 pandemic.
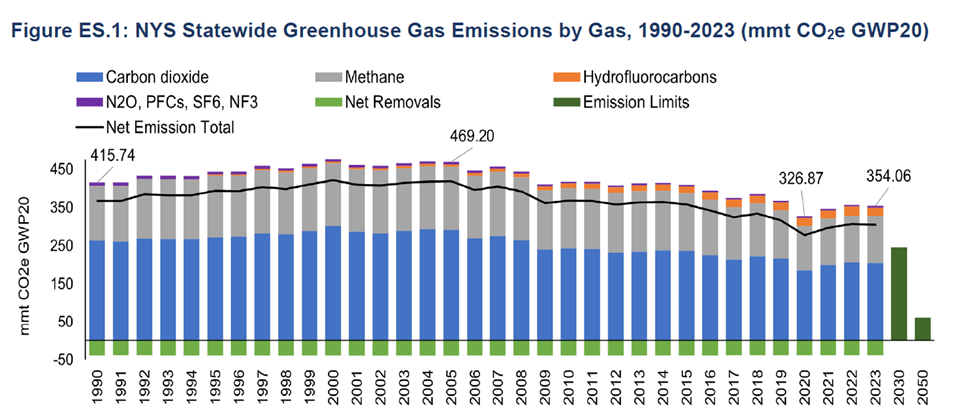
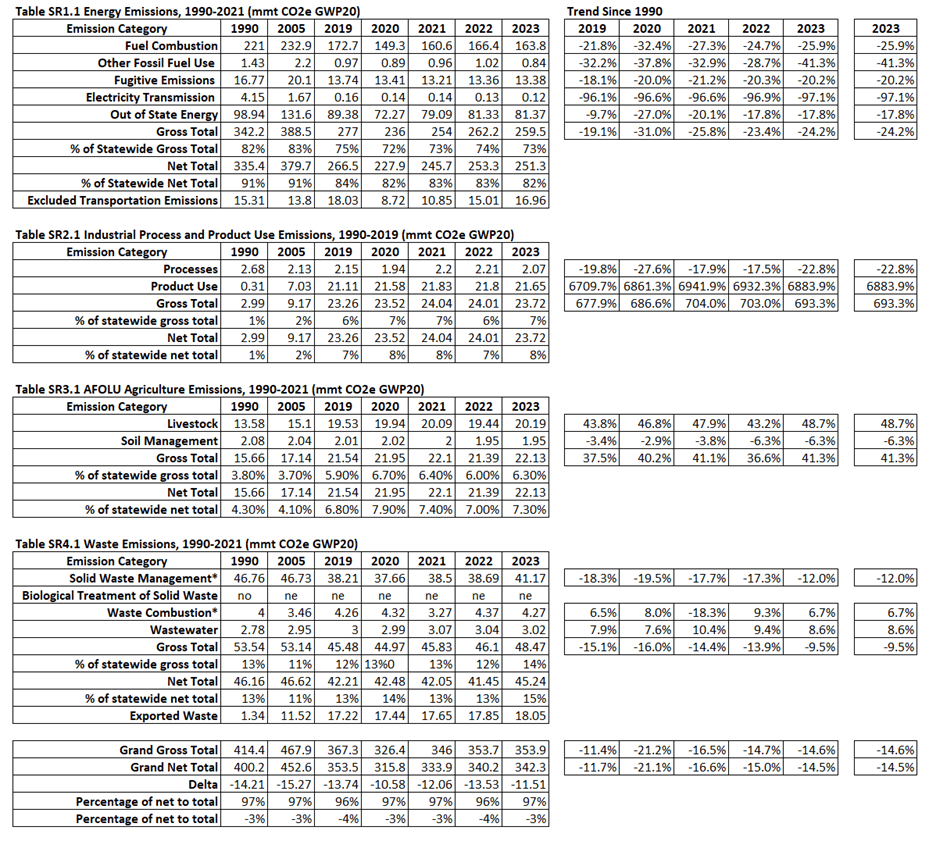
Currently, the data for Figure ES.1 are not available. When it becomes available, I will dive into the trends. In the meantime, Table 3 extracts individual trend tables from each of the sectoral reports for energy, industrial processes and product use, agriculture, forestry and land use, and waste. The only emission categories that have reduced emissions in excess of 40% are the energy “other fossil fuel use” and “electricity transmission” categories but both total only 1% of the inventory. Total emissions increased in the Industrial Process and Product Use Sector “product use” category; the AFOLU Agriculture Emission Sector “livestock” category; and the Waste Sector “waste combustion” and “wastewater” categories. The increases in emissions were in categories that total 14% of the inventory.
Table 3: Summary of Sectoral Emission Trends
Annual Variation of the GHG Emission Inventory
I previously mentioned that 1990 total gross emissions calculated in this analysis were different than the those calculated when the 1990 statewide emission baseline was established by ECL 75-0107 and reflected in 6 NYCRR Part 496. It is important to understand that GHG emission inventories are not based completely on measured emissions. The power plant emissions used in EPA trading programs are based on direct measurements, but the estimates in this inventory are derived using emission factors and estimates of activities such as fuel use or vehicle miles traveled.
Table 3 illustrates how this affects the status relative to the 2030 emission limit. All the emission inventories have estimated a different 1990 value than the regulatory limit in Part 496. The Sum 1990 Gross Total row lists the different numbers. The rest of the table shows how these differences affect the comparison of current emissions to the 2030 limit.
Table 3: Annual Statewide GHG Emission Inventory Report Emissions Relative to Climate Act 2030 Mandate (mmt CO2e GWP20)
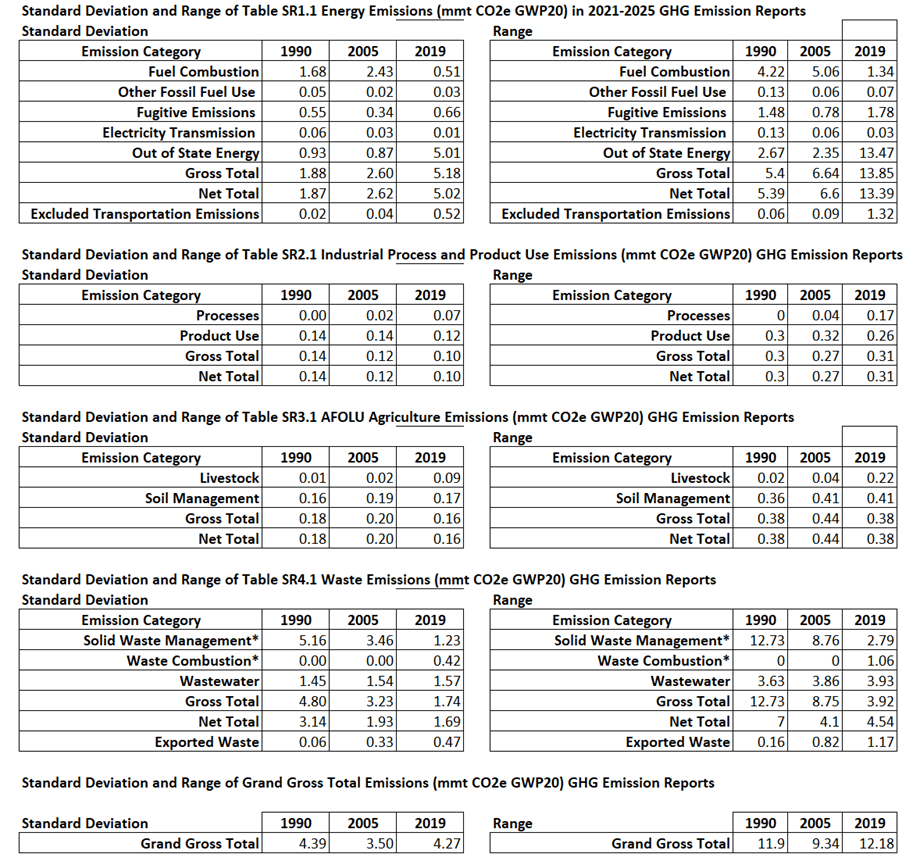
The variation in the emissions estimates is significant. The sectoral GHG emission reports list data for 1990, 2005, and the last five years. Table 4 presents the standard deviation and range of observed data for 1990, 2005, and 2019 for the last five reports for different sector emission categories. Note that the total range of variation for 2019 emissions is 12.18 million metric tons of CO2e. In this report the total 2019 emissions were 367.25 million metric tons of CO2e so variations in methodology are about 3% of the total estimated emissions.
If you take the time to dive into the details of Table 4 one thing stands out. The main driver of the observed variation range is the estimate for the “out of state energy” category in the energy sector. The 2019 variation range was 13.47 million metric tons of CO2e.
Table 4: Standard Deviation and Range of Observed Emissions from Last Five GHG Emission Reports
Implications Discussion
There are several implications for the GHG inventory. Most important relates to the Climate Act target for a 40% reduction of greenhouse gas (GHG) emissions from 1990 levels by 2030. In 2023 statewide emissions were only 14% lower than 1990 and there is no suggestion that the rate is increasing so this confirms that the achieving the 2030 goal is impossible.
This article quantifies the variation of emissions estimates. This emission inventory relies on emission factors instead of direct emission measurements, so future variations are to be expected. Changes due to reporting sources and improvement of the emission factors used will be a feature of program going forward. The question is how it gets handled. The report notes “The 6 NYCRR Part 496 regulation may be revised at a later date using updated information.” For any affected source trying to determine their control strategy this uncertainty complicates planning. Worse, in the face of changing numbers, New York Cap-and-Invest Program compliance will be more challenging. Finally, when there is a price on carbon, say $10 per ton, the methodology changes will affect millions of dollars of costs.
Finally, I want to emphasize that this report illustrates that New York “follows the science” when it is convenient but ignores the consensus when politically expedient. In particular, the GHG emissions accounting is inconsistent with the UNFCCC. Note that the largest driver of the observed variation in emission estimates across reports is the “out of state energy” category in the energy sector. There are reasons that the UNFCCC methodology does not include upstream emissions and one of them is the challenge of estimating those emissions consistently.
Conclusion
The 2025 GHG emission inventory reports is another warning regarding Climate Act implementation. It is clear that the 2030 GHG emission reduction target cannot be met. There are unacknowledged challenges inherent in the emission inventory approach that will make the Cap-and-Invest program implementation more challenging.

2 thoughts on “Implications of New York State 2025 GHG Emissions Inventory”