Balancing the risks and benefits of environmental initiatives
Author: rogercaiazza
I am a meteorologist (BS and MS degrees), was certified as a consulting meteorologist and have worked in the air quality industry for over 40 years. I author two blogs. Environmental staff in any industry have to be pragmatic balancing risks and benefits and (https://pragmaticenvironmentalistofnewyork.blog/) reflects that outlook. The second blog addresses the New York State Reforming the Energy Vision initiative (https://reformingtheenergyvisioninconvenienttruths.wordpress.com). Any of my comments on the web or posts on my blogs are my opinion only. In no way do they reflect the position of any of my past employers or any company I was associated with.
I was prompted to prepare this post while reading the White Paper on Clean Energy Standard Procurements to Implement New York’s Climate Leadership and Community Protection Act (white paper) prepared by the New York Department of Public Service (DPS) and the New York State Energy Research and Development Authority (NYSERDA) because that document claims a “net benefit of around $7.7 billion” over the lifetime of projects they believe are required to meet the goal that 70% of electric energy will be produced by renewable energy by 2030 (70 by 30). Although I have written about the approach used by the State before I believe it is necessary to re-iterate my concerns in the current context.
I am a retired electric utility meteorologist with nearly 40-years experience analyzing the effects of meteorology on electric operations. I believe that gives me a relatively unique background to consider the potential quantitative effects of energy policies based on doing something about climate change. The opinions expressed in this post do not reflect the position of any of my previous employers or any other company I have been associated with, these comments are mine alone.
Background
In the summer of 2019 the Governor Cuomo and the New York State Legislature passed the Climate Leadership and Community Protection Act (Climate Act) which was described as the most ambitious and comprehensive climate and clean energy legislation in the country when Cuomo signed the legislation.
The legislation includes not only the 70 by 30 requirement but also a mandate to eliminate all fossil fuel use in the electricity sector by 2040. I have written a series of posts on the feasibility, implications and consequences of this aspect of the law based on evaluation of data.
Unfortunately, the politicians that passed the Climate Act never bothered to figure out how it could be done. Among problems to resolve are development of a plan for renewable resources and an implementation plan to pay for those resources. The DPS has a mandate to establish a program whereby jurisdictional load serving entities (today’s jargon for what used to be called the electric utilities) secure renewable energy resources to serve the 70 by 30 target. The white paper explains how they propose to do this. It includes the following:
Description of the key provisions in the Climate Act relating to the 70 by 30, including the role of jurisdictional LSEs and the definition of renewable energy systems;
Projection of the quantity of renewable energy that must be deployed to achieve 70 by 30;
Establishes average annual procurement targets for different tiers in the existing procurement process;
Proposal for a new tier for the procurement process; and
Cost and benefit analysis.
The following quote from the cost and benefit analysis sparked my interest:
“NYSERDA estimates that the proposed Tier 1 procurements, as set out in Section II.c.1 below, – from 2021 to 2026 – would lead to a levelized impact on electricity bills of less than 0.5% (or $0.35 per month for the typical residential customer). Taking into account the value of the avoided carbon emissions, these procurements are estimated to yield a net benefit of around $7.7 billion over the lifetime of the projects.”
This post will show the fallacies in this benefit claim.
Social Cost of Carbon
It is New York State policy to calculate benefits of greenhouse gas emission reductions using the Social Cost of Carbon (SCC). The SCC is the present-day value of projected future net damages from emitting a ton of CO2 today. In order to estimate the impact of today’s emissions it is necessary to estimate total CO2 emissions, model the purported impacts of those emissions and then assess the global economic damage from those impacts. The projected global economic damage is then discounted to the present value. Finally, the future damage is allocated to present day emissions on a per ton basis to get the SCC value.
I have previously argued that there are several technical reasons that the single value the State of New York has thus far relied on should not be used exclusively. It is more appropriate to consider a range of values because of the massive uncertainties associated with this metric. The comments on the SCC prepared by Dr. Richard Tol in a Minnesota Public Utilities Commission hearing on that state’s use of the SCC better explain potential problems with the SCC.
Dr. Tol is Professor of the Economics of Climate Change at Vrije Universiteit Amsterdam and a Professor of Economics at the University of Sussex and has direct experience estimating the social cost of carbon. In his testimony, Tol explains that there are differences between SCC and traditional damages cost methodologies: “The causal chain for the social cost of carbon is rather long, complex and contingent. In this way it is different from the traditional damages cost methodology for a pollutant like mercury or lead.” He uses a couple of examples to explain that the many interactions between purported changes to the environment from a changed in the greenhouse effect due to a ton of CO2 depend upon assumptions every step of the way which makes it “rather difficult to the climate effects of CO2 emissions.” He concludes: “In sum, the causal chain from carbon dioxide emission to social cost of carbon is long, complex and contingent on human decisions that are at least partly unrelated to climate policy. The social cost of carbon is, at least in part, also the social cost of underinvestment in infectious disease, the social cost of institutional failure in coastal countries, and so on.”
My biggest concern is that tweaking any one of many inputs to the SCC calculation radically change the results. New York uses the SCC values developed by the Obama administration. In 2017, President Trump signed Executive Order 13783 which modified two aspects of the calculation: only considering damages occurring within the United States and employing discount rates of 3 percent and 7 percent for the use of this parameter in regulatory policy. The Obama values used global damage numbers and discount rates of 2.5 percent, 3 percent, and 5 percent. The difference between those two assumptions results in a SCC for domestic economic impacts at a 7 percent discount rate would be $2.20 in the year 2050, while the SCC for global economic impacts at a 2.5 percent discount rate would be $100.62. These changes reflect economic and policy judgements without advising the public what is happening. When the costs hit the consumers, someone is going to have a lot of explaining to do.
Lifetime Benefits
Despite these issues, New York State uses the SCC without conditions to claim benefits from their proposed investments. The white paper states “Taking into account the value of the avoided carbon emissions, these procurements are estimated to yield a net benefit of around $7.7 billion over the lifetime of the projects.” NYSERDA regularly calculates benefits based on the lifetime of their projects. This is a different approach than that used in air pollution control regulation cost reduction calculations. In the Environmental Protection Agency’s Reasonably Available Control Technology rule when you calculate the cost effectiveness of a control program, the cost of the control system is divided by the annual emissions reduction to get the dollars per ton reduced. There is no consideration of lifetimes.
If you are interested in the cost of the Climate Act, you need to know the annual reductions possible from technologies implemented to reduce emissions. The Climate Act specifies reductions from 1990 annual emissions so the apples to apples comparison is the annual reduction. On the other hand, in a NYSERDA energy efficiency program, the avoided energy saved by the efficiency program equates to money saved. It seems reasonable to count the total savings to the ratepayer.
When it comes to the SCC, I believed that it was inappropriate to consider lifetime savings but could not find anything specific in the literature to validate my belief. I contacted Dr. Tol and asked the following question:
There is a current proceeding where NYSERDA is claiming that their investments are cost-effective but they use life-time benefits. I concede that the ratepayer cost-benefit calculation should consider the life-time avoided costs of energy and can see how that reasoning might also apply to the social cost of carbon. However, in the following definition, SCC is the present-day value of projected future net damages from emitting a ton of CO2 today, I can interpret that to mean that you shouldn’t include the lifetime of the reduction. Am I reading too much into that?
His response explains that the use of life-time savings or costs is inappropriate:
Dear Roger,
Apples with apples.
The Social Cost of Carbon of 2020 is indeed the net present benefit of reducing carbon dioxide emissions by one tonne in 2020.
It should be compared to the costs of reducing emissions in 2020.
The SCC should not be compared to life-time savings or life-time costs (unless the project life is one year).
stay healthy
Richard
Dr. Richard S.J. Tol MAE
Professor
Department of Economics, Room 281, Jubilee Building
University of Sussex, Falmer, Brighton BN1 9SL, UK
Conclusion
I am convinced that the majority of New York State ratepayers are unaware of the ramifications of the Climate Act and even if they know about it, it is unlikely that they know how the state calculates its claims that the costs will be out-weighed by the benefits. In this instance, the quotation: “there are three kinds of falsehoods, lies, damned lies and statistics” could be modified to “there are three kinds of falsehoods, lies, damned lies and climate benefit estimates”.
This post explains that the SCC is a weak tool for climate policy. I am most concerned that the SCC values are not robust because small changes in any of the large number of assumptions give contradictory results. When used in policy making, like the Climate Act, the values chosen are politically expedient rather scientifically based. The costs of the Climate Act will be enormous and I believe it is incumbent upon its advocates to explain their analyses and use of the SCC.
However, this post also shows that even if you accept the SCC as a valid approach and use the values chosen by New York, then the cost benefits claimed by NYSERDA, in general, and the white paper, in particular, are flawed because they rely on life-time benefits. Today’s SCC is the net present benefit of reducing carbon dioxide emissions by one ton this year. The SCC should not be compared to life-time savings or life-time costs. As a result, the claim that the “procurements are estimated to yield a net benefit of around $7.7 billion over the lifetime of the projects” is wrong.
Update July 6, 2020: I looked at the ETP Clean Energy Technology Guide in more detail and found their ratings for anerobic digesters. I have modified the relevant section.
On July 18, 2019, Governor Cuomo signed into law the Climate Leadership and Community Protection Act (Climate Act). It is among the most ambitious climate laws in the world and requires New York to reduce economy-wide greenhouse gas emissions 40 percent by 2030 and eliminate the use of fossil fuel for electricity production by 2040. New York’s politicians were sure that implementing these goals was simply a matter of political will so they offered no plan how it would be done. The International Energy Agency (IEA) recently published “Special Report on Clean Energy Innovation” that directly relates to this implementation effort that I believe should be required reading for New York’s Climate Action Council.
I am following the implementation of the CLCPA closely because its implementation affects my future as a New Yorker. Given the cost impacts for other jurisdictions that have implemented renewable energy resources to meet targets at much less stringent levels I am convinced that the costs in New York will be enormous and my analyses have supported that concern. The opinions expressed in this post do not reflect the position of any of my previous employers or any other company I have been associated with, these comments are mine alone.
On June 24, 2020 Energy plus Environmental Economics (E3) presented results of their emissions reductions pathway analyses to the New York Climate Action Council which gives the first inkling of what the law’s supporters acknowledge will have to be done. I took issue with the presentation’s claim that “Deep decarbonization in New York is feasible using existing technologies” previously and in this post will highlight key points made in their Special Report on Clean Energy Innovation (“EIA Report”) that are relevant to New York’s Climate Act Implementation.
Introduction
New York’s Climate Act requires that the Climate Action Council prepare a plan for “net zero emissions in all sectors of the economy” in the following:
§ 75-0107. Statewide greenhouse gas emissions limits.
1. No later than one year after the effective date of this article, 24 the department shall, pursuant to rules and regulations promulgated after at least one public hearing, establish a statewide greenhouse gas emissions limit as a percentage of 1990 emissions, as estimated pursuant to section 75-0105 of this article, as follows:
a. 2030: 60% of 1990 emissions.
b. 2050: 15% of 1990 emissions.
§ 75-0103. New York state climate action council.
11. The council shall on or before two years of the effective date of this article, prepare and approve a scoping plan outlining the recommendations for attaining the statewide greenhouse gas emissions limits in accordance with the schedule established in section 75-0107 of this article, and for the reduction of emissions beyond eighty-five percent, net zero emissions in all sectors of the economy, which shall inform the state energy planning board’s adoption of a state energy plan in accordance with section 6-104 of the energy law. The first state energy plan issued subsequent to completion of the scoping plan required by this section shall incorporate the recommendations of the council.
The E3 presentation echoes the belief of the supporters of the Climate Act that achieving the net zero goal is essentially just a matter of political will. However, the IEA report suggests that optimism is mis-placed:
“Without a major acceleration in clean energy innovation, net-zero emissions targets will not be achievable. The world has seen a proliferating number of pledges by numerous governments and companies to reach net-zero carbon dioxide (CO2) emissions in the coming decades as part of global efforts to meet long-term sustainability goals, such as the Paris Agreement on climate change. But there is a stark disconnect between these high-profile pledges and the current state of clean energy technology. While the technologies in use today can deliver a large amount of the emissions reductions called for by these goals, they are insufficient on their own to bring the world to net zero while ensuring energy systems remain secure – even with much stronger policies supporting them.”
Analysis
In order to focus my analysis on a manageable component of the Climate Act implementation plan I am going to address one component of the electric sector de-carbonization pathway. E3 and I agree that the biggest problem for a de-carbonized electric system is going to be the winter peak when solar resources are low and the potential for a large high-pressure system could mean that wind resources are near zero for several days. E3 claims the New York winter statewide peak load will be 24 GW in 2020 and in 2050 the peak load will be 35 GW with flex loads and 43 GW without flex loads when the added demands of electrifying transport and heating are added to the system. E3 offered a combination of five options to meet the challenge: large-scale hydro resources, renewable natural gas, synthetic fuels such as hydrogen, Carbon Capture Storage (CCS), and nuclear power. I will look at these technologies with respect to the IEA report and feasibility in New York to determine if the 2040 de-carbonized electric system goal is realistic.
There are two technologies listed that are mature and have long histories of development: large-scale hydro resources and nuclear power. However, New York needs additional resources to meet this demand challenge and I believe it is unlikely that either technology can be counted on in New York. Although nuclear should be considered the fact that the completed nuclear power plant at Shoreham was never operated, the closing of one operational unit at Indian Point in 2020, and the planned closing of the last operational unit at Indian Point in 2021 suggests that new nuclear in New York is extremely unlikely. I am comfortable saying that there are no significant sources of undeveloped hydro available much less permittable in New York. There is a potential for Canadian hydro-power that will likely be considered.
The remaining three technologies are still in the “clean energy innovation pipeline” described in the IEA report. IEA explains:
“Innovation is not the same as invention. After a new idea makes its way from the drawing board to the laboratory and out into the world, there are four key stages in the clean energy innovation pipeline. But this pathway to maturity can be long, and success is not guaranteed:
Prototype: A concept is developed into a design, and then into a prototype for a new device (e.g. a furnace that produces steel with pure hydrogen instead of coal).
Demonstration: The first examples of a new technology are introduced at the size of a full-scale commercial unit (e.g. a system that captures CO2 emissions from cement plants).
Early adoption: At this stage, there is still a cost and performance gap with established technologies, which policy attention must address (e.g. electric and hydrogen-powered cars).
Mature: As deployment progresses, the product moves into the mainstream as a common choice for new purchases (e.g. hydropower turbines).”
The EIA report notes that de-carbonization comes from four main technology approaches. These are the electrification of end-use sectors such as heating and transport; the application of carbon capture, utilization and storage; the use of low-carbon hydrogen and hydrogen-derived fuels; and the use of bioenergy. EIA explains that each of these areas faces challenges in making all parts of the technological application process, what they call the value chain, commercially viable in the sectors where reducing emissions is hardest. The IEA report uses the technology readiness level (TRL) scale (complete description in Box 3.2 on page 67) to assess where a technology is on its journey from initial idea to market use. Their evaluation of the TRL for different de-carbonization technologies is summarized in three figures: Figure 3.2 TRL of technologies along the low-carbon electricity value chain, Figure 3.3 TRL of technologies along the CO2 value chain, and Figure 3.4 TRL of technologies along the low-carbon hydrogen value chain.
Figure 3.2 notes that hydropower and nuclear are mature technologies. While it is straying from my intent to discuss only those technologies proposed for the winter peak, it is interesting that solar PV, solar thermal, wind, and hydrogen from water electrolysis are all listed as an early adoption TRL.
E3 claims that Carbon Capture Storage (CCS) can be used to address the winter peak. The EIA report notes that capture, transport and utilization or storage of CO2 emissions as a successful decarbonization strategy hinges on the commercial availability of technologies at each stage of the process as well as on the development and expansion of CO2 transport and storage networks at a sizeable scale (Figure 3.3). In this instance I assume that E3 is referring to CCS combined with natural gas combustion. According to the EIA report natural gas electricity production coupled with chemical absorption has a demonstration TRL. The feasibility issue in New York may ultimately be storage because there is no oil production to enhance. Storage in saline formations has an early adoption TRL but New York refused to allow propane storage because of its impact on community character so I would imagine this could not be permitted either.
E3 claims that “synthetic fuels such as hydrogen” can be used to address the winter peak. I am going to only consider hydrogen synthetic fuel production and that is covered in Figure 3.4. The EIA report notes:
“The value chain for low-carbon hydrogen is not completely developed at commercial scale today. It comprises many technologies that are necessary to produce, transport, store and consume low-carbon hydrogen, each of them at a different stage of maturity and facing specific technical challenges (Figure 3.4)”.
The pathway report only mentions the use of hydrogen but not how it would be used for the winter peak. I assume that E3 proposes to use hydrogen production from electrolysis and that has an early adoption TRL. In order to have it available for use during the winter peaks it will need to be shipped and stored. The hydrogen infrastructure for pipelines and tanks are both rated as mature technologies. If the hydrogen is supposed to be used for heating hydrogen boilers and fuel cells have an early adoption TRL but hydrogen-driven fuel cells only have a large prototype TRL. If the hydrogen is supposed to be used to generate electricity then high-temperature fuel cells have an early adoption TRL and hydrogen-fired gas turbines have a large prototype TRL.
Updated July 6, 2020: E3 also proposes to use renewable natural gas from anerobic digesters to address the winter peak problem. I could not find a category in these three figures that I think fits this technology in the EIA report. The poster version of the technology guide rates biogas from a non-algae feedstock as “Commercial Operation In Relevant Environment – Solution is commercially available, needs evolutionary improvement to stay competitive”. There are questions about the collection and storage infrastructure needed to transport and store it for the winter peak demand as well as how much gas is available relative to the need for the winter peak.
Conclusion
I believe that this report underscores my belief that the statement “Deep decarbonization in New York is feasible using existing technologies” mis-characterizes the actual situation. As EIA points out feasibility depends upon making all parts of the technological application process, what they call the value chain, commercially viable. The fact is that for the technologies proposed to address the winter peak problem, one or more aspects of commercial viability, availability limitations, or public perception make the E3 recommendations risky bets for future reliability and affordability.
I suggest that it would be better for the State to take a measured approach rather than the all-in approach currently envisioned. The fact is that we don’t know what will work best for New York so it would be better to have a plan that could be adjusted as necessary. The IEA proposes five innovation principles that I think would be appropriate for New York to incorporate in their Climate Act implementation process.
For governments aiming to achieve net-zero emissions goals while maintaining energy security, these principles primarily address national policy challenges in the context of global needs, but are relevant to all policy makers and strategists concerned with energy technologies and transitions:
Prioritise, track and adjust. Review the processes for selecting technology portfolios for public support to ensure that they are rigorous, collective, flexible and aligned with local advantages.
Raise public R&D and market-led private innovation. Use a range of tools – from public research and development to market incentives – to expand funding according to the different technologies.
Address all links in the value chain. Look at the bigger picture to ensure that all components of key value chains are advancing evenly towards the next market application and exploiting spillovers.
Build enabling infrastructure. Mobilise private finance to help bridge the “valley of death” by sharing the investment risks of network enhancements and commercial-scale demonstrators.
Work globally for regional success. Co-operate to share best practices, experiences and resources to tackle urgent and global technology challenges, including via existing multilateral platforms.
On July 18, 2019, Governor Cuomo signed into law the Climate Leadership and Community Protection Act (Climate Act). It is among the most ambitious climate laws in the world and requires New York to reduce economy-wide greenhouse gas emissions 40 percent by 2030 and eliminate the use of fossil fuel for electricity production by 2040. New York’s politicians were sure that implementing these goals was simply a matter of political will so they offered no plan how it would be done. On June 24, 2020 Energy plus Environmental Economics (E3) presented results of their emissions reductions pathway analyses to the New York Climate Action Council which gives the first inkling of what the law may suggest will be done. This post is an overview summary of that report concentrating on the presentation summary of the draft findings.
I am following the implementation of the CLCPA closely because its implementation affects my future as a New Yorker. Given the cost impacts for other jurisdictions that have implemented renewable energy resources to meet targets at much less stringent levels I am convinced that the costs in New York will be enormous and my analyses have supported that concern. The opinions expressed in this post do not reflect the position of any of my previous employers or any other company I have been associated with, these comments are mine alone.
I think the best way to summarize the report is to simply reproduce the conclusions in section 5 of the presentation and then discuss the points made:
This report presents E3’s initial strategic analysis to inform New York’s future decisions for meeting GHG goals under the CLCPA. Based on our detailed assessment of pathways to deep decarbonization in New York State, we find the following:
Deep decarbonization in New York is feasible using existing technologies. This reinforces the conclusion of many other studies. All needed technologies currently exist and can safely be assumed to realize incremental improvements resulting from significant deployment. A high level of innovation will make the transition easier, but the transition is already technically feasible.
There are different pathways to a carbon neutral future. A 30-year transition demands action now across all sectors of the State’s economy but affords some optionality. All scenarios that achieve carbon neutrality show significant progress across the “four pillars” of decarbonization: energy efficiency and conservation, decarbonizing the electricity supply, switching to low-carbon fuels, and negative emissions.
Continued research, development, and demonstration is key to advancing a full portfolio of options. Some studies and scenarios rely on technologies that have only been demonstrated in a limited number of applications and require further progress before commercial readiness.
Consumer decision-making drives the pace of decarbonization, particularly in buildings and on-road transportation. By 2030, key technologies like plug-in electric vehicles, electric heat pump heating and hot water systems, and other electric appliances in the home (e.g., stoves, clothes dryers) will need to become normalized, meeting or exceeding half of new sales with accelerating adoption through midcentury.
Flexibility along multiple dimensions is key to maintaining reliability and reducing cost of a 100% zero-emission electricity system. In the electricity sector, several forms of flexibility are necessary for balancing a 100% zero-emissions grid. Flexible end-use loads and battery storage can provide sufficient short-term (intraday) flexibility to balance high levels of variable renewable output. The more difficult challenge is during winter periods with high heating loads and very low renewable energy production, which can occur over several days. This long-duration (interday) challenge can be solved through a combination of large-scale hydro resources, renewable natural gas (RNG) or synthetic fuels such as hydrogen, Carbon Capture Storage (CCS), and nuclear power.
Managed electrification can help mitigate the risk of very high winter peaks. In addition to efficiency and end-use load flexibility, investments in a balanced mix of electric heating system configurations and investment in research and development to continue the improvement in cold climate heat pump performance can help to mitigate potential risk associated with unintended consequences of unmanaged electrification.
Background
The New York State Energy Research and Development Authority (NYSERDA) hired E3 to conduct the strategic analysis of New York’s decarbonization opportunities. It is strategic in the sense that they worked backwards from the targets and put together measures that would be needed to reach them.
The report notes that:
The CLCPA requires additional reporting of emissions associated with “extraction and transmission of fossil fuels imported into the state,” as well as the adoption of a 20-year global warming potential, a metric that emphasizes the near-term climate impacts of short-lived climate pollutants such as methane. The calculation of a 1990 baseline that includes these new requirements is currently underway.
This report is based on the existing inventory of 1990 emission that uses the 100-year global warming potential commonly used elsewhere. New York’s irrational[1] war on natural gas includes the 20-year global warming potential in order to maximize the effect of natural gas and methane reductions relative to the targets.
Feasibility
The report claims that “Deep decarbonization in New York is feasible using existing technologies”. Their definition of feasibility apparently means somewhere, someplace, someone has successfully applied the technology. Using their criteria I am surprised they did not include nuclear fusion as a technology. After all fusion plasma has been maintained in a stable state for 70 seconds. Using their rosy projections surely this technology will be available for use in 2050.
Reality is only two paragraphs away: “Continued research, development, and demonstration is key to advancing a full portfolio of options. Some studies and scenarios rely on technologies that have only been demonstrated in a limited number of applications and require further progress before commercial readiness”. When the report claims “All needed technologies currently exist and can safely be assumed to realize incremental improvements resulting from significant deployment. A high level of innovation will make the transition easier, but the transition is already technically feasible”, there is a serious effort to stretch feasibility that most people would accept in this context.
I agree with the report’s conclusion that winter periods with high heating loads and very low renewable energy production is going to be a big challenge. The report claims that this can be solved through “a combination of large-scale hydro resources, renewable natural gas (RNG) or synthetic fuels such as hydrogen, Carbon Capture Storage (CCS), and nuclear power”. I do not agree that RNG and synthetic fuels such as hydrogen are necessarily feasible at the scale necessary to keep the lights on when New Yorkers need the power the most once heating and transportation are electrified.
One final feasibility comment. The report notes that “investment in research and development to continue the improvement in cold climate heat pump performance can help to mitigate potential risk associated with unintended consequences of unmanaged electrification”. This refers to the very real problem that air source heat pumps become much less efficient when temperatures go below 20 deg F. Their study assumes “that a balanced portfolio of electric space heating systems – including cold climate air-source heat pumps with and without onsite combustion backup as well as ground-source heat pumps – would be deployed”. Heat pumps are very efficient because they move heat/energy rather than produce it when they provide heating. Ground-source heat pumps always have energy to move. The problem that air-source heat pumps have is there isn’t enough energy to provide the heat needed when temperatures are cold. Absent a repeal of the laws of thermodynamics, it is not clear what additional R&D is going to be able to do for air-source heat pump performance when there is no energy to convert.
De-Carbonization Pillars
The pathways proposed to achieve carbon neutrality show “significant progress across the “four pillars” of decarbonization: energy efficiency and conservation, decarbonizing the electricity supply, switching to low-carbon fuels, and negative emissions”. I address each pillar below.
While I believe that energy efficiency and conservation are the most effective tools for emission reductions, I also believe that there are limits to what can be practically achieved. New York is already among the most energy efficient states in the country so future progress will likely be difficult.
My primary concern is decarbonizing the electricity supply because all the analyses that show the availability of renewable resources have to date failed to consider small-scale solar variability. During winter periods with high heating loads the report notes that very low renewable energy production over several days could be expected but their analysis did not use the NY Mesonet data available from every county to refine their projection. Given the significant effect that the Great Lakes have on precipitation and cloudiness across much of Upstate New York that is a serious deficiency in their solar resources projections.
The report explains that “Advanced low-carbon liquid and gaseous fuels are key to decarbonizing sectors where electrification is challenging, such as freight transportation, aviation, marine, and high-temperature industrial applications”. Their fuels analysis includes hydrogen produced from electricity produced by renewables. The thought is that when all the renewables are built there will be many times when we don’t need the electricity so instead of curtailing production, they will use it to create hydrogen that can be stored for use when the wind doesn’t blow at night. This may or may not be feasible in my mind and because no jurisdiction has employed this technology in a similar application I tend to think it may not be feasible.
There is another little tidbit related to bio-fuels that needs to be recognized. The report notes that “the pathways modeled in our analysis can achieve deep decarbonization using available in-state biomass feedstocks that are assumed to be converted to advanced renewable natural gas and renewable petroleum products. We also assume that a small amount of wood consumption remains in 2050 to serve a variety of needs, including residential wood usage in the North Country”. In this instance does North refer to anything north of New York City? More importantly, their pathways “retain approximately 16 TBtu of wood consumption statewide in 2050; Compare to 2016 residential wood usage in the North Country of about 3 TBtu”. I personally don’t think that increasing residential wood usage five times over current use is a “small” amount.
Negative emissions strategies including both natural and working lands and negative emissions technologies make up the fourth pillar. The report defines “negative emissions” as “the removal of CO2 directly from the atmosphere or from the emission stream of renewable biogenic feedstock combustion (where the carbon emitted was first captured from the atmosphere in the photosynthesis process, resulting in a net decrease in atmospheric carbon)”. The report states that “With nearly 20 million acres of forest, New York State’s natural and working lands sink is projected to sequester between 23 to 33 MMT CO2e”. The obvious question that comes up is that given a five-fold increase in residential wood usage isn’t that going to cut down the sequestration potential?
Customer Choice
There are two aspects of this that most New Yorkers do not realize are coming soon to their lives: customer choice and customer energy use. The report explains that “Consumer decision-making drives the pace of decarbonization, particularly in buildings and on-road transportation. By 2030, key technologies like plug-in electric vehicles, electric heat pump heating and hot water systems, and other electric appliances in the home (e.g., stoves, clothes dryers) will need to become normalized, meeting or exceeding half of new sales with accelerating adoption through midcentury.” What that translates to is you will only have a fifty-fifty chance to buy fossil-fueled appliances or cars in ten years even if the performance that the report admits has to improve has not reached the level needed for your application. That does not even begin to consider personal preferences for the capability and reliability of on-site fossil fuels. I have yet to see an explanation of what will happen when there is an ice storm after everything is electrified. I value the capability to have heat even when the power is down as a very nice benefit of natural gas.
In order to reduce the amount of energy and storage needed it is necessary to shave the peak load as much as possible. The report notes that “Flexible end-use loads and battery storage can provide sufficient short-term (intraday) flexibility to balance high levels of variable renewable output”. I believe that flexible end-use load translates to eventual remote control of customer power use. The theory is that smart meters can provide enough detailed information that they can be used to charge customers higher rates when the load gets high providing a signal for customers to shift usage. One of the unintended consequences of heating electrification and the expected change to the annual peak load moving to the winter is that shifting heating load is much less of an option. In the early morning when temperatures are coldest and people warm up their houses what load can be shifted? If it is a choice between a blackout or a brownout across the system or limiting power use by individual customers it is not a stretch to think that smart meters will limit usage.
Conclusion
Given the enormity of the challenge to meet the Climate Act targets and the composition of the Climate Action Council membership I suppose it was too much to expect unbiased, fact-based implementation pathways. However, the exaggerated feasibility claims and internal inconsistencies of this document worry me. The first key takeaway “deep decarbonization is feasible using existing technologies” is only true with a liberal definition of feasible and existing technologies.
The biggest problem is going to be the winter peak when it is likely that there will be insufficient renewable energy available for multiple days. E3 offered a combination of five options to meet the challenge: large-scale hydro resources, renewable natural gas, synthetic fuels such as hydrogen, Carbon Capture Storage (CCS), and nuclear power. Note that New York needs additional resources to meet this new challenge and while large-scale hydro resources and nuclear power are possible sources to think that they can be developed in New York is very unlikely. Renewable natural gas from anerobic digesters is a proven technology but is it feasible to collect and store enough to meet the winter peak demand. Synthetic fuel production hasn’t even proven itself as a technology that can be deployed at scale much less meet the collection and storage requirements. CCS is another technology that has “only been demonstrated in a limited number of applications and requires further progress before commercial readiness” but even if the technology works the bigger issue is where are you going to put the collected CO2. In order to safely store CO2, you need a particular geological formation and that may mean that this technology cannot be used where it is needed in New York.
The conclusion that “Deep decarbonization in New York is feasible using existing technologies” coupled with the conclusion “Continued research, development, and demonstration is key to advancing a full portfolio of options” is a glaring inconsistency. Two pathways include a “small” amount of wood consumption in 2050 but it turns out that level is five times the existing level. Furthermore, that consumption is at odds with the negative emissions needed from forest sequestration.
Based on this, I fear that the scoping plan will not be scrutinized in sufficient detail to maintain reliability and affordability. The Climate Action Council will merely pay lip service to their responsibilities to the citizens of the State and the result will be disastrously high energy costs and impacts to reliability.
I believe that it is only a matter of time until the Iron Law of Climate, “while people are often willing to pay some price for achieving climate objectives, that willingness has its limits” catches up to the Climate Act. It is not only the enormous costs but it is also the changes in lifestyles that will precipitate public demand to repeal the law. I believe that is in the best interest of the State to get this over as quickly as possible so I think the time has come to accelerate implementation of New York’s Climate Leadership and Community Protection Act. In order to meet the requirement for an 85% emission reduction economy-wide by 2050 we should immediately stop all investments in fossil fuel infrastructure. New Yorkers will have to purchase electric vehicles and stop purchasing gas and oil furnaces, gas stoves and gas hot water systems at some point to meet these goals. According to the advocates the technology is feasible, available, affordable, and necessary. Let’s test the willingness of the citizens of the State to meet these goals now and get this over sooner rather than later.
[1] I consider New York’s policies to ban hydraulic fracturing and not permit new natural gas infrastructure irrational because the lower prices that resulted from that technology have been responsible for the majority of the emission reductions observed in New York’s electric sector since 2010.
On July 18, 2019, Governor Cuomo signed into law the Climate Leadership and Community Protection Act (Climate Act). It is among the most ambitious climate laws in the world and requires New York to reduce economy-wide greenhouse gas emissions 40 percent by 2030 and no less than 85 percent by 2050 from 1990 levels. The law creates a Climate Action Council charged with developing a scoping plan of recommendations to meet these targets. This post summarizes the second meeting of the Council.
I am following the implementation of the CLCPA closely because its implementation affects my future as a New Yorker. Given the cost impacts for other jurisdictions that have implemented renewable energy resources to meet targets at much less stringent levels I am convinced that the costs in New York will be enormous and my analyses have supported that concern. The opinions expressed in this post do not reflect the position of any of my previous employers or any other company I have been associated with, these comments are mine alone.
According to the Climate Action Council website: “The New York State Climate Action Council (Council) is a 22-member committee that will prepare a Scoping Plan to achieve the State’s bold clean energy and climate agenda”. The co-chairs and ten of the members are representatives of state agencies and authorities. The remaining ten members were chosen by politicians. Advisory panels and the Just Transition Working Group will help develop the scoping plan. As of this meeting only the working group has been set up. No word on the six initial panels: transportation; energy efficiency and housing; agriculture and forestry; power generation; energy intensive and trade-exposed industries; and land-use and local government.
June 24, 2020 Climate Action Council Meeting
The meetings and materials web page for the Council lists the meeting materials, a link to a meeting video, and additional resources. This meeting was originally scheduled in April but due to the pandemic was postponed. Moreover, it has had significant impacts to programs at the agencies because staff have been diverted away from Council activities to assist in the emergency response. As a result, not much has happened to this effort for several months.
There is a video link but I watched the meeting webinar. Not listed in the posted agenda was the item co-chair remarks that was long and added nothing to the substance of the meeting. Skip the first 45 to 50 minutes to get too the presentation by E3 and you will miss nothing The agenda consisted of the following topics:
Consideration of Minutes
Presentation by Consultants: Emissions Reduction Pathways Analysis, Energy and Environmental Economics, Inc. (E3)
Discussion of Working Groups and Scopes of Work for Advisory Panels
Updates on NYS Implementation from DEC: Greenhouse Gas Emission Limits, Value of Carbon Reduction
Next Steps
One of the points of emphasis during the meeting was the allegation that there are disparate impacts of the pandemic and of climate change to Environmental Justice (EJ) communities. The Climate Act (§ 75-0117 Investment of funds) has specific requirements on funding for EJ communities:
State agencies, authorities and entities, in consultation with the environmental justice working group and the climate action council, shall, to the extent practicable, invest or direct available and relevant programmatic resources in a manner designed to achieve a goal for disadvantaged communities to receive forty percent of overall benefits of spending on clean energy and energy efficiency programs, projects or investments in the areas of housing, workforce development, pollution reduction, low income energy assistance, energy, transportation and economic development, provided however, that disadvantaged communities shall receive no less than thirty-five percent of the overall benefits of spending on clean energy and energy efficiency programs, projects or investments and provided further that this section shall not alter funds already contracted or committed as of the effective date of this section.
Commissioner Seggos explained the direction of 40% of overall benefits to EJ communities is only a goal and the Council should aim for a higher value. There also is a requirement for ambient air monitoring in EJ communities. Presumably DEC’s air quality monitoring programs in four EJ communities counts towards that requirement.
The NYSERDA consultant, E3, presented results of their emissions reductions pathway analyses by sector. This is the first tangible product that describes what will be required to meet the Climate Act. The summary notes that “there is no single pathway to a decarbonized economy, all scenarios that achieve carbon neutrality share significant progress in the following four pillars:
Energy efficiency, conservation and end use electrification
Switching to low carbon fuels
Decarbonizing the electricity supply
Negative emissions measures and carbon capture technologies”.
The presentation noted that results are intended to inform the Council discussion not make specific recommendations. I intend to devote a post to this report in the future.
The “Just Transition” workgroup candidates have been identified and they will likely meet in a month or so. No information was provided on filling the other workgroups or panels.
There has been progress on the Department of Environmental Conservation (DEC) implementation. DEC is working on two rulemakings:
The Climate Act requires them to establishing emissions limits for 2030 and for 2050 and because the targets are based on 1990 emissions, they have to finalize that as well. There will be a proposal released for public comment in August (end of comments in October). Emissions limits will be finalized by January 1, 2021.
DEC also has to identify the value of carbon as an aid for agency decision making (not for regulatory use). DEC is considering two options: environmental damages and marginal cost of abatement. DEC will evaluate a range of discount rates including zero, the social cost of carbon used in other jurisdictions and will provide values for non-CO2 GHG. A stakeholder conference will be held in July; public comment on the agency guidance document will occur from August – September with a final release in January, 2021
The Climate Act includes a definition of “Carbon dioxide equivalent” or as it is more commonly known global warming potential, that complicates these rule-makings. The law specifies that that carbon dioxide equivalent “means the amount of carbon dioxide by mass that would produce the same global warming impact as a given mass of another greenhouse gas over an integrated twenty-year time frame after emission”. The Contribution of Working Group I to the Fifth Assessment Report of the Intergovernmental Panel on Climate Change section on Anthropogenic and Natural Radiative Forcing uses a 100-year time frame but admits that there is no scientific basis to choose that over other time frames. The problem is that New York’s requirement for a 20-year time frame means that you cannot compare New York’s emission inventories and costs of carbon to everyone else, including earlier New York work who uses the 100-year time frame. Consequently, this means more work for DEC to generate numbers consistent with the Climate Act.
Conclusion
There is a long way to go with the Climate Action Council and its charge to develop a scoping plan. Although the de-carbonization pathways presentation claimed that their initial pathways were feasible, they also admitted that the scale of the transformation was unprecedented. I will be posting on the pathways and DEC rulemakings in future articles.
One final note. The membership of the Climate Action Council and the likely makeup of all the working groups and advisory panels is over-whelming convinced not only that there is an existential climate threat but that implementation of the Climate Act is only a matter of political will. Even the title scoping plan as opposed to feasibility plan suggests there is no question this can be done. In that light, it is not clear if any evidence contrary to their pre-conceived notions could engender change. However, as Robert Louis Stevenson said: “Sooner or later everyone sits down to a banquet of consequences”.
New York State energy and environmental policy is more about optics than facts. Nowhere is this more apparent than the recent spate of opinion pieces, reports, and even policy proposals related to peaking power plants. I evaluated the basis of these items in a series of three posts but because they are very technical I have elected to summarize this issue in this post.
I think this is an important because the vilification of peaking power plants is getting all sorts of undeserved attention. Although the peaking plants are alleged to be a primary driver of the environmental burden in neighboring environmental justice communities that is unlikely to be the case. Combine that with the enormous costs of energy storage and the difficulty siting enough renewables within the city to replace these plants that means that a clean energy “solution” is likely not in the best interests of society, particularly in the admittedly over-burdened environmental justice communities.
I am a retired electric utility meteorologist with nearly 40 years-experience analyzing the effects of meteorology on electric operations. I have been involved with the peaking power plants in particular for over 20 years both from a compliance reporting standpoint and also evaluation of impacts and options for these sources. This background served me well preparing this post. The opinions expressed in this post do not reflect the position of any of my previous employers or any other company I have been associated with, these comments are mine alone.
The Problem
There are two drivers for peaking power plant issues. In order to provide electricity to everyone who needs it when they need it, the New York Independent System Operator (NYISO) has to balance power availability with the load on the system. NYISO is responsible not only for the real-time deliver of power but also for reliability planning. If the load did not vary this would be much less difficult, but the reality is that load varies diurnally and seasonally. Most important is meeting demand when loads are highest in the summer and winter when it is necessary to provide electricity to maintain the health and well-being of customers. Ultimately the problem boils down to the fact that there are short periods when so much load is needed that there are units dedicated by intent or circumstances to provide just that load during the year. This is expensive and inefficient but is, in my opinion, a problem with no easy solution.
The second driver for this issue is that the hot and humid conditions that cause the high energy use in the summer peak are also the conditions conducive to ozone formation and higher levels of PM2.5. New York State has been working on the issue of emissions and air quality on high electric demand days specifically since at least 2006. While there is an undeniable link between high energy demand and the high emissions that create peak ozone levels there is on over-riding requirement to keep the power on when it is needed most.
The reports both suggested that the payments for the peaking power were unreasonable. The PEAK Coalition believes that these plants “receive exorbitant payments from utilities and other energy service providers just for the plants to exist”. This is not my area of expertise but based on the turnover of ownership and other factors, I don’t believe that they are the profit centers the PEAK Coalition believes they are. Importantly, the units do run when power is needed most so there is a reason for them to exist.
The Analysis
I found that the basis for the technical aspects of the PEAK Coalition report is work by Physicians, Scientists, and Engineers (PSE) for Healthy Energy. PSE evaluated Federal data peaking power plants across the country based on fuel type, capacity, technology and how much they ran. This is a blunt approach that cannot address any of the nuances that have resulted in some units running for short times. In New York for example, there are simple cycle turbines in New York City that were built specifically to provide peaking power. There also are some large oil-fired units that run little because their fuel costs are so high. Off the top of my head I also note that there are units that burn oil and run only when needed due to natural gas supply constraints, but there certainly could be other reasons some units run so little. As a result the simplistic proposal for replacement is only valid for some of the facilities at best.
In order to prove the need for a clean energy alternative, PSE combined the peaking power plant data with ambient air quality data to show that the peaking plants often run at the same time that there are National Ambient Air Quality Standard exceedances. That is a well-known fact. PSE also developed a “cumulative vulnerability index that integrates data on health burdens (asthma, heart attacks, premature birth rates); environmental burdens (ozone, particulate matter, toxics, traffic proximity, lead paint, and hazardous facilities); and demographic indicators (low-income, minority, linguistically isolated, and non-high school-educated populations)”. All of these data were combined to make the claim that these plants need to be replaced.
However, I don’t think that the PSE approach made a convincing case that the peaking power plants are a primary driver of environmental burdens on neighboring communities. Their vulnerability index lists other factors but makes no attempt to attribute impacts to each factor. The ultimate problem with this approach is that the peak unit justification relies on environmental burdens from ozone and particulate matter air quality impacts. However, ozone is a secondary air pollutant and the vast majority of ambient PM2.5 from power plants is also a secondary pollutant. As a result, there is enough of a lag between the time emissions are released and creation of either ozone or PM2.5 that the impact is felt far away from the adjacent communities. That means that the accused peaking power plants do not create the air quality impact problems alleged to occur to the environmental justice communities located near the plants. In fact, because NOx scavenges ozone, the peaker plants reduce local ozone if they have any effect at all.
The Solution
Dirty Energy, Big Money states “Experts have found—and real-world examples have proven—that battery storage and renewable generation may be less expensive to develop and manage than the rarely used but heavily polluting fossil fuel power plants, while also meeting or exceeding the same performance standards”. This statement is just plain wrong as I showed in detail. As soon as energy storage is added to the renewable “solution” the projected costs rise exponentially and there are no real-world examples supporting this as a proven policy approach. Moreover, the difficulties and cost of siting enough renewable energy within New York City to meet the in-city generation requirements also suggest enormous costs.
New York’s irrational war on natural gas continues in this vilification of peaking power plants. I do not dispute that there is a New York City peaker problem where old, inefficient combustion turbines designed to provide peak power are being used to provide critically needed power when needed most. In order to force their replacement the New York State Department of Environmental Conservation (DEC_promulgated new limits for the simple cycle turbines such that they will be required to install controls or shut down. They should be replaced and probably should have been replaced long ago so the question is why hasn’t this happened.
In my opinion the continued operation of the old simple cycle turbines in New York City is the result of New York’s de-regulated market place. I am absolutely sure that in a regulated environment the responsible utility would have made a case to the Department of Public Service that replacement with cleaner, more efficient generation was needed, the Department would have agreed and after it was approved the utility would have built the replacements units and been guaranteed a reasonable return on their investment. However, in the de-regulated market there wasn’t a strong enough financial incentive to replace the old units. Before I retired in 2010, I worked on two separate permit applications for new, efficient, and cleaner replacement power for one set of the old combustion turbines. In both instances the permits were approved but the replacements were never built, apparently because the company decided that the business case was not strong enough to warrant the investment.
According to the plans submitted to comply with DEC’s peaking power plant rule only one company is planning to build replacement peaking power. I fear that in today’s political climate that the proposed re-powering of Gowanus will not be permitted because it is new fossil fuel infrastructure. However, it is fundamentally different inasmuch as the proposed plant is on a barge. If New York’s aspirational climate agenda works out then it won’t be needed and it can simply be moved away to another location to serve as a bridge source of energy elsewhere. However, I am unconvinced that the clean energy alternatives proposed will work, much less be affordable. Therefore, this proposed project is invaluable insurance for reliability and affordability.
Conclusion
The claims that peaking power plants are dangers to neighboring environmental justice communities are based on emotion. In the evaluation I did of the PSE analysis and the PEAK Coalition report, I found that the alleged impacts of the existing peaking power plants over-estimates impact on local communities relative to other sources. The existing simple cycle peaking turbines in New York City are old, inefficient and much dirtier than a new facility and clearly should be replaced. However, they reliably produce affordable power when needed most. In order to maintain that affordability and reliability I think it is best to rely on a proven solution such as the proposed Gowanus re-powering project. The solar plus energy storage approach advocated by PSE and the PEAK Coalition will likely increase costs significantly if it works. I cannot over-emphasize the fact that it may not work because solar and energy storage is not a proven technology on the scale necessary to provide New York City’s peaking power requirements. Sadly in the rush to prove politically correct credentials this unproven technology may be chosen despite the risks to power reliability.
I am a retired electric utility meteorologist with nearly 40 years-experience analyzing the effects of meteorology on electric operations. I have been involved with New York peaking power plants in particular for over 20 years from a compliance reporting and operations standpoint and also evaluated impacts and options for this kind of source. This background served me well preparing this post. The opinions expressed in this post do not reflect the position of any of my previous employers or any other company I have been associated with, these comments are mine alone.
The United States relies on more than 1,000 natural gas- and oil-fired peaker power plants across the country to meet infrequent peaks in electricity demand. These peaker plants tend to be more expensive and inefficient to run for every megawatt-hour generated than baseload natural gas plants and emit higher rates of carbon dioxide and health-harming criteria air pollutants. Peaker plants are also typically disproportionately located in disadvantaged communities, where vulnerable populations already experience high levels of health and environmental burdens.
The text for the New York specific report describes the problem similarly:
Across New York, 49 oil- and gas-fired peaker power plants and peaking units at larger plants help meet statewide peak electric demand. These include both combustion turbines designed to ramp quickly to meet peak demand, and aging steam turbines now used infrequently to meet peak needs. More than a third of New York’s peaker plants burn primarily oil, and three-quarters are over 30 years old resulting in numerous inefficient plants with high rates of greenhouse gas and criteria pollutant emissions for every unit of electricity generated. Some of these plants are in very urban areas: ten plants have more than a million people living within three miles. One-third of the plants are located in areas the state considers to be environmental justice communities, where vulnerable populations typically already experience high levels of health and environmental burdens. New York has set energy storage targets and recently designed peaker plant emission reduction targets, providing an opportunity to replace inefficient, high-emitting peaker plants in vulnerable communities throughout the state with energy storage and solar.
Their proposed solution:
Renewable energy and energy storage systems are beginning to emerge as competitive replacements for this fossil fuel infrastructure. Simultaneously, numerous states across the country are designing incentives and targets to support energy storage deployment. Together, these developments provide a unique opportunity to use energy storage to strategically displace some of the most polluting peaker power plants on the grid.
In the Energy Storage Peaker Plant Replacement Project PSE did a screening analysis across nine states that identified peaker power plants that “may be prime candidates for replacement based on operational and grid characteristics, and whose replacement may yield the greatest health, environment and equity co-benefits”. They claim that their approach “aligns state efforts to adopt energy storage with environmental and societal goals”.
The following section is the summary of the report. Based on my review of the New York State-specific results I believe further study is needed to actually determine if all the peaker units identified can actually be considered candidates for replacement with energy storage and solar. I also worry that the PSE analysis is mis-leading inasmuch as it does not address the fact that peaker plants fulfill niche operational backup roles that vary widely across the country. I am familiar with New York State peaker plants and will show why that is important in New York.
“The majority of New York’s peaker plants are located in densely urban areas in New York City and Manhattan, a region that is in non-attainment for federal ozone standards. These include old, inefficient and oil-burning units near populations that experience high cumulative environmental health and socioeconomic burdens. The state’s new emission reduction standards for nitrogen oxides, along with its energy storage deployment goals, provide a clear opportunity to target inefficient and polluting facilities for replacement with cleaner alternatives, particularly in urban areas. In the attached table, we provide operational, environmental and demographic data for New York peakers and nearby populations. Indicators such as nearby population, emission rates, heat rate (a measure of efifciency), operation on poor air quality days, capacity factor, typical run hours, and location in an environmental justice community or in an import-constrained load zones downstate can help inform whether a given plant might be a good target for replacement with storage, solar+storage, demand response, or other clean energy alternatives. These data should be accompanied by engagement with accompanied by engagement with affected communities to determine replacement priorities and strategies.”
The New York report has four sections: New York State Policy and Regulatory Environment, New York State Peaker Plants, Nearby Populations, and Emissions and the Environment. I will address those sections in the following.
New York State Policy and Regulatory Environment
There isn’t much to comment on in this section. The PSE report only describes New York’s climate initiatives. Although the summary notes that New York has new emission reduction standards for nitrogen oxides, it does not highlight the fact that the regulation was specifically intended to address emissions from the old, inefficient simple cycle combustion turbines in New York City. I described New York’s specific initiatives in my background post on the PEAK Coalition Dirty Energy, Big Money report.
New York State Peaker Plants
This analysis and report were intended to provide background information to support “clean energy alternatives” for peaker plants. A primary component of that information is identification of peaker plants. The technical documentation describes peaker power plants and the selection criteria used in their screening analysis. PSE states “The phrase peaker plant commonly refers to fossil fuel-burning power generation used to meet peak demand on the electric grid, but the term itself does not have a precise definition”. Actually, for EPA reporting purposes there is an exact, regulatory definition. 40 CFR Part 75 §72.2, states that a combustion unit is a peaking unit if it has an average annual capacity factor of 10.0 percent or less over the past three years and an annual capacity factor of 20.0 percent or less in each of those three years.
PSE chose to select peaking power plants based on the following criteria: fuel type: oil & natural gas; Capacity: ≥ 5 MW; capacity factor: ≤15% (3-yr. avg.); unit technology type: simple cycle combustion turbine, steam turbine & internal combustion; application: entire peaker plants & peaking units at larger plants; and status: existing and proposed units. Relative to the peaking power plants subject to EPA reporting requirements, the biggest difference is that the PSE criteria selects small units between 5 and 15 MW that are so small that their emissions and impacts are generally considered insignificant. Those facilities do not report continuous emissions monitoring data that the units >15 MW do.
Briefly, PSE collected data from EPA and EIA then screened it with their criteria to identify peaking units. They calculated operational and emissions data. Then they compared operational data with ambient monitoring data and found periods when the peaking units operated during periods of high ambient levels. This is a straight-forward number crunching exercise and I have no comments on the methodology.
The technical and policy documentation for the Energy Storage peaker plant replacement project includes a section titled “Grid requirements: transmission constraints and capacity needs” that includes a discussion of New York. For the most part PSE relied on the New York Independent System Operator analyses of the peaker plants. They note that the impacts of removing capacity is highly location dependent quoting NYISO reports: “lower amounts of capacity removal are likely to result in reliability issues at specific transmission locations” and that NYISO did not “attempt to assess a comprehensive set of potential scenarios that might arise from specific unit retirements”. Despite the fact that NYISO cannot make specific recommendations PSE goes ahead and makes recommendations for five plants in New York City and five plants on Long Island that are “replacement opportunities” in PSE Peaker Documentation Table 5.3.
While I am certainly no expert on New York City reliability requirements I believe that there are ramifications not considered by PSE. The NYISO Gold Book Data for Table 5.3 Replacement Opportunities table provides additional data for the PSE opportunities. First note that PSE did not identify peaking units that operate at facilities with other units. There is a combustion turbine at Northport and Arthur Kill that operates with the capacity factor listed. PSE apparently does not understand that the primary purpose of those units is for black starts, that is to say when they provide power necessary to start the steam turbine units when there is no off-site power available. In theory battery storage could be used for that but because of reliability considerations the battery would have to always be kept with enough energy to start the plant for the very rare occasion when there is a blackout. There is no way that could be cost-effective. My table also lists the fuel burned and it is instructive that all but one of the units listed can burn kerosene or number 2 fuel oil. There are specific requirements for minimum oil burning when there is a possibility that the gas supply could be cut off. Because this is not the standard peaking power plant replacement scenario, I am not sure whether battery storage would be cost-effective for this requirement.
Advocates for “clean energy alternatives” point out that New York has a law that requires that no electricity will be generated by fossil fuels in 2040. Until such time that the State has a plan to meet that goal that explains how reliability and affordability can be maintained, then I will continue to believe that meeting that aspirational goal is more than simply a matter of political will. For example, the Gowanus power plant has a nameplate capacity of around 540 MW. For all the Article Ten solar energy applications currently in the queue 5.4 acres per MW was the lowest spatial requirement. That means that solar panels totaling at least 4.6 square miles will be needed to replace this source of in-city generation. While that may be possible, there are a host of logistical issues starting with the need to provide the power where it is needed when it is needed. New York City is a load pocket relative to the rest of the grid but there are numerous smaller load pockets within the city.
Nearby Populations
The report notes that “Ten of the New York peaker plants each have more than a million people living within a three-mile radius. The most urban plants tend to also be in relatively low-income, minority communities, due to both the location of some facilities in low-income, environmentally overburdened communities of color.” In my background post on the PEAK Coalition Dirty Energy, Big Money report I described the environmental justice concept of dis-proportionate impacts. I do not know how to deal with dis-proportionate impacts when the location of some facilities impact rich communities at the same time they impact low-income communities.
PSE developed a “cumulative vulnerability index that integrates data on health burdens (asthma, heart attacks, premature birth rates); environmental burdens (ozone, particulate matter, toxics, traffic proximity, lead paint, and hazardous facilities); and demographic indicators (low-income, minority, linguistically isolated, and non-high school-educated populations)”. It is vital to determine the effect of the peaker power plants relative to all the other impacts on the admittedly over-burdened environmental justice communities.
Emissions and the Environment – Air Quality Impacts
In order to determine the relative impact of peak power plants we have to consider their air quality impacts. In order to be permitted to operate, all power plants have to evaluate the potential impacts of their emissions relative to the National Ambient Air Quality Standards (NAAQS). There are two types of standards. Primary standards provide public health protection, including protecting the health of “sensitive” populations such as asthmatics, children, and the elderly. Secondary standards provide public welfare protection, including protection against decreased visibility and damage to animals, crops, vegetation, and buildings. Air quality models combine information about the emissions, operating characteristics, and meteorological conditions to estimate the ambient concentrations from the power plants and those estimates are compared to the NAAQS. If the contribution from the facility directly causes an exceedance of any NAAQS limit then the plant cannot operate until changes are made to reduce the impact. If nothing can be done to reduce the impacts lower than the limits then it cannot be permitted to operate.
The air quality modeling used to permit a power plant to operate considers pollutants like sulfur dioxide and nitrogen dioxide that are directly emitted by the plant. Power plants also emit pollutants that are precursors to other pollutants that form in secondary reactions. Modeling secondary pollutants is more complicated and ascribing the impacts of particular facilities on air quality is more difficult. Permit conditions for secondary pollutants such as ozone and inhalable particulate matter can also limit emissions of the precursor pollutants.
In my opinion the most difficult air quality issue today is ozone attainment because the emission source characteristics and meteorological conditions are not only complex and difficult to understand but also because making the reductions necessary are costly and impactful. Ground-level ozone is created by chemical reactions between oxides of nitrogen (NOx) and volatile organic compounds (VOC). Those pollutants are emitted by cars, power plants, industrial boilers, refineries, chemical plants, natural sources and other man-made sources and when they chemically react in the presence of sunlight, they create ozone. Ozone is most likely to reach unhealthy levels on hot sunny days in urban environments but because NOx and VOC as well as ozone can be transported long distances by wind, rural areas are affected and urban areas are affected by sources far upwind.
It has been observed that when widespread transportation restrictions are implemented (e.g. during the Atlanta Olympics) that there is a marked improvement in ozone levels. However, the fact is that there is little societal desire to maintain the draconian restrictions of automobile use that produce those improvements. For peaking power plants, the problem is that the conditions most conducive to create ozone are also the hot and muggy conditions that increase electricity demand for cooling, so the peak load of electric generation produces the most emissions at the worst time. However, in order to provide the power necessary to keep the lights on when people really want and need it, the existing power grid has peaking facilities. In my second post on the PEAK coalition report I described the process used to determine if these units are needed and why I think they have not been replaced yet.
Recall that PSE developed a cumulative vulnerability index that integrates data on environmental burdens including ozone and particulate matter. The point of this entire discussion is that ozone is a secondary air pollutant and the vast majority of ambient PM2.5 from power plants is also a secondary pollutant. In other words, there is a lag between the time of relevant emissions and creation of either ozone or PM2.5. As a result, the accused peaking power plants do not create the air quality impact problems alleged to occur to the environmental justice communities near the peaking power plants. In fact, because NOx scavenges ozone the peaker plants reduce local ozone if they have any effect at all.
Conclusion
The PSE report notes that “These data should be accompanied by engagement with accompanied by engagement with affected communities to determine replacement priorities and strategies.” I do not want anyone to misunderstand that I am not arguing that something should not be done about New York City’s simple cycle combustion turbine peaking power plants. They are old, inefficient and relatively dirty. However, in order to do the right thing, we need to understand all the background information. The PSE analyses and the PEAK Coalition vilification of fossil-fired power plants only tells one side of the story and, inasmuch as most of the alleged environmental impacts are based on ozone and PM2.5 impacts, they misleadingly imply much more of an environmental benefit to the affected communities than will actually occur if the existing power plants are replaced by the latest generation of natural-gas fired power plants.
As noted in my post on the feasibility of the “clean energy alternative”, I have reservations about that proposed solution. Even though the cost for developing renewable energy resources is allegedly cheaper than the cost of equivalent fossil-fired energy resources, the cost to ensure that electricity is available when and where it is needed for the two resources are not even close. Because renewable energy is intermittent energy storage is required and my feasibility post demonstrated those costs are immense and would have to drop by an order of magnitude to make the solar+storage option comparable in cost.
Post Script
The PSE report Opportunities for Replacing Peaker Plants with Energy Storage in New York State includes a table that lists all the power plants in New York State that meet their screening criteria defining a peak plant. The title of the report suggests that this list contains facilities that could be replaced by energy storage. However, it includes steam turbine units that burn residual oil. Because those units burn an expensive fuel, they don’t run much but because their operating costs are relatively low, they can be kept available for the rare occasions when they are needed. I was working at one of the named Upstate plants, Oswego, when the 2003 Northeast blackout occurred. When the transmission system lost power, three nuclear units nine miles east of the plant had to shut down. In order to bring the system back on-line, both of Oswego’s 850 MW units were turned on, ran for a combined 231 hours and generated 71,684 MWh. I cannot think of any scenario where it would be in the best interest of New York to build enough energy storage to replace the Oswego power plant for this type of incident.
Update June 30, 2020: I wrote a layman’s summary on this issue here.
New York State energy and environmental policy is more about optics than results. Nowhere is this more apparent than the recent spate of opinion pieces, reports, and even policy proposals related to peaking power plants. In May 2020, the PEAK Coalition released a report entitled: “Dirty Energy, Big Money”. The focus of the study is the “peaker” power plants that operate when energy demand in New York City spikes above normal levels. Because I have been involved with this issue and these plants for over 20 years, I want to review the report.
This is my second post on this topic. The first post provided information on the primary air quality problem associated with these facilities, the organizations behind the report, the State’s response to date, the underlying issue of environmental justice and address the motivation for the analysis. This post addresses the rationale and feasibility of the proposed plan relative to environmental effects, affordability, and reliability.
I am a retired electric utility meteorologist with nearly 40 years-experience analyzing the effects of meteorology on electric operations. I have been involved with the peaking power plants in particular for over 20 years both from a compliance reporting standpoint and also evaluation of impacts and options for these sources. This background served me well preparing this post. The opinions expressed in this post do not reflect the position of any of my previous employers or any other company I have been associated with, these comments are mine alone.
Background
The Physicians, Scientists, and Engineers (PSE) for Healthy Energy is a multidisciplinary, nonprofit research institute that studies the way energy production and use impact public health and the environment. Their report Opportunities for Replacing Peaker Plants with Energy Storage in New York State formed much of the technical basis for this PEAK Coalition analysis. I discuss that report here.
The full title of Dirty Energy, Big Money includes: “How Private Companies Make Billions from Polluting Fossil Fuel Peaker Plants in New York City’s Environmental Justice Communities—and How to Create a Cleaner, More Just Alternative Public Health Impacts”. The table of contents includes sections on public health impacts, New York’s reliability process and payments, clean energy alternatives and the benefits of the PEAK Coalition proposed alternative. I will address each of these topics.
The report has a table of Peaker Power Plants Operating in New York City which is based on a Physicians, Scientists, and Engineers for Healthy Energy report: Opportunities for Replacing Peaker Plants with Energy Storage in New York State. The peaking units included in that report cover not only small combustion turbines with nameplate capacities down to 16 MW but also steam turbine boilers such as Ravenswood ST03 with a nameplate capacity of 1,027 MW. The problem with using that overview analysis in this instance is that the impacts and alternatives for such widely different power plants are completely different. Unfortunately, the report does not address the differences and suffers as a result.
Public Health Impacts
The PEAK coalition description of air quality public health impacts claims that “When New York’s gas-fired peaker plants are operating, they can account for over one-third of New York’s daily power plant NOx emissions,” but the citation is from a press release so I could not track down the basis for that claim. This is one example of the problem resulting from the broad definition of peaker plants that considers both steam turbine boilers and combustion turbines. Because steam turbine boilers have relatively tall stacks and hot plumes there are very few direct impacts on local neighborhoods from their emissions simply because there is no opportunity for the plume to reach the ground so close. The press release is apparently referring to the older simple cycle combustion turbines that either have to retire or install controls by May 1, 2023. More importantly, the discussion of health impacts focuses on PM2.5 (particulate matter with a diameter of 2.5 microns or less that is small enough to be inhaled deep into the lung) and ozone. Neither of those pollutants is associated with local impacts from natural gas and oil-fired power plants because they are primarily a result of secondary pollutant effects meaning that they result from reactions with other directly emitted pollutants. Those reactions take time and by the time they occur the air mass has moved away from the local neighborhoods.
The primary public health reference was the New York City Department of Health and Mental Hygiene’s (DOHMH) Air Pollution and the Health of New Yorkers report. The PEAK Coalition quotes the conclusion from that report: “each year, PM2.5 pollution in [New York City] causes more than 3,000 deaths, 2,000 hospital admissions for lung and heart conditions, and approximately 6,000 emergency department visits for asthma in children and adults.” Each year they claim exposures to ozone concentrations above background levels cause an estimated “400 premature deaths, 850 hospitalizations for asthma and 4,500 emergency department visits for asthma.” What is not made clear is that these conclusions are for total air pollution in NYC and are based on air quality conditions from 2005-2007.
The DOHMOH report describes PM2.5 and its sources:
Fine Particles (PM2.5) are small, airborne particles with a diameter of 2.5 micrometers or less. Major sources of PM2.5 include on-road vehicles (trucks, buses and cars); fossil fuel combustion for generating electric power and heating residential and commercial buildings; off-road vehicles (such as construction equipment); and commercial cooking (U.S. Environmental Protection Agency, National Emissions Inventory). Fine particles can also become airborne from mechanical processes such as construction or demolition, industrial metal fabrication, or when traffic or wind stirs up road dust.
An article entitled Fine Particulate Matter Constituents Associated with Cardiovascular Hospitalizations and Mortality in New York City by Ito et al., 2011 concludes that “Local combustion sources, including traffic and residual oil burning, may play a year round role in the associations between air pollution and cardiovascular disease outcomes, but transported aerosols may explain the seasonal variation in associations shown by PM2.5 mass”. Residual oil burning at the PEAK coalition peaker power plants is a backup fuel source used when there is a scarcity of natural gas or there are transmission constraint requirements that require a minimum oil burn. Because of the fuel use characteristics, the tall stacks, and the conversion time between SO2 emissions and sulfate aerosols it is unlikely that these power plants have neighborhood impacts. It is more likely that traffic sources are a larger contributor to EJ communities near the power plants.
There is one more aspect of the DOHMOH PM2.5 report that needs to be addressed. The report specified four scenarios for comparisons (DOHMOH Figure 4) and calculated health events that it attributed to citywide PM2.5 (DOHMOH Table 5). Based on their results the report notes that:
Even a feasible, modest reduction (10%) in PM2.5 concentrations could prevent more than 300 premature deaths, 200 hospital admissions and 600 emergency department visits. Achieving the PlaNYC goal of “cleanest air of any big city” would result in even more substantial public health benefits.
It is important to note how the air quality has improved since the time of this analysis. The NYS DEC air quality monitoring system has operated a PM2.5 monitor at the Botanical Garden in New York city since 1999 so I compared the data from that site for the same period as this analysis relative to today (Data from Figure 4. Baseline annual average PM2.5 levels in New York City). The Botanical Garden site had an annual average PM2.5 level of 13 ug/m3 for the same period as the report’s 13.9 ug/m3 “current conditions” city-wide average (my estimate based on their graph). The important thing to note is that the latest available average (2016-2018) for a comparable three-year average at the Botanical Garden is 8.1 ug/m3 which represents a 38% decrease which is substantially lower than the PlaNYC goal of “cleanest air of any big city”.
The DOHMOH analysis used a linear no-threshold health impact analysis. As a result, it is possible to estimate the air quality health effects of the observed decrease in PM2.5 using their model (Modified Table 5. Annual health events attributable to citywide PM2 5 level). Note that in DOHMOH Table 5 the annual health events for the 10% reduction and “cleanest” city scenarios are shown as changes not as the total number of events listed for the current levels. My modified table converts those estimates to totals so that the numbers are directly comparable. I excluded the confidence interval information because I don’t know how it would be modified. I tested the linear hypothesis by scaling the “current level” scenario number of events to the proportion of the PM 2.5 concentrations for the “current level” and the other two scenarios. My estimated health impacts were all within 1% which demonstrates that is all the DOHMOH analysis did. Therefore, I could estimate the health impact improvements due to the observed reductions in PM2.5 as shown in my modified table.
I do not believe that the linear no-threshold air quality health impact model is correct. I could be convinced, however, if the DOHMOH could demonstrate that the observed health impacts improved as predicted by the model. Until such time as someone validates the performance of this kind of model I recommend caution in these results.
The DOHMOH report also describes ozone:
Ozone is not emitted directly from fuel combustion; it is produced by chemical reactions involving nitrogen oxides (NOx)—a mixture including nitric oxide (NO) and nitrogen dioxide (NO2)—volatile organic compounds and sunlight. O3 concentrations typically peak in the afternoon and are highest in the summer, when daylight hours are long and temperatures are high. Although NOx emissions from vehicles contribute to higher ozone in urban areas, in city locations where fresh NOx emissions are concentrated, NO reacts with, and removes, ozone from the atmosphere in a reaction known as ozone “scavenging.” As a result, concentrations in urban areas with an abundance of NOx from traffic sources tend to have somewhat lower concentrations of ozone than more suburban locations downwind from the city center.
For the purposes of this evaluation of localized neighborhood impacts from the peaker plants note two things. Because ozone is a secondary pollutant the emissions from the peaker plants do not create ozone that affects neighbors. The reason the DEC put controls on the peaking turbines last year was because of their impact on ozone levels downwind in Connecticut. Moreover, as the DOHMOH report explains if there is any effect of these power plants on the neighborhoods it would be a reduction in ozone because of “scavenging”.
New York’s Reliability Process and Payments
The description of New York’s energy reliability process provides a good overview and appropriately stresses the importance of reliable energy to prevent blackouts and brownouts. It describes the process which determines the energy mandates, procurement process and specifies energy needed for peak energy demand. Despite apparently understanding the process and the importance of having power available for peak demands, the capacity market is vilified as unwarranted “big money”. The de-regulated market needs a mechanism to pay the power plant owners for their services. If the load did not vary diurnally, seasonally, and was not subject to high energy demands, payments would be simple.
However, because it is not simple, the market mechanism includes both payments for electricity provided but also for capacity. The report states “This means that all peaker plants in New York City collect millions of dollars every year just to be “on standby” to produce very little energy —sometimes for only a few days each year.” That is true but it neglects the obvious point that if they were not available for those few days each year there would not be enough energy and brownouts and blackouts would be the result.
I do not dispute that there is a New York City peaker problem where old, inefficient combustion turbines are being used to provide critically needed power when needed most. In order to force their replacement the New York State Department of Environmental Conservation promulgated new limits for the simple cycle turbines such that they will be required to install controls or shut down. The compliance date for that regulation is May 2023 and the state may grant a two-year compliance extension to peaker plants deemed a “reliability resource by the NYISO or transmission owner”.
In my opinion the New York City peaker problem is the result of New York’s de-regulated market place. I am absolutely sure that in a regulated environment the responsible utility would have made a case to the Department of Public Service that replacement with more efficient generation was needed and after it was approved the utility would have been guaranteed a reasonable return on their investment. However, in the de-regulated market there wasn’t a strong enough signal to replace the old units. Before I retired in 2010, I worked on two separate permit applications for new efficient and cleaner replacement power for one set of the old combustion turbines. In both instances the permits were approved but the replacements were never built, apparently because the company decided that the business case was not strong enough to warrant the investment.
The PEAK Coalition apparently believes that there are problems with payments for the existing generators. I have neither the background or time to evaluate those claims in detail so I cannot comment on them. The fact that there has been a lot of turnover in ownership for New York’s peaking units suggests that no one is making great profits under the existing system. Moreover, it should be kept in mind that in the de-regulated market, generation owners have no obligation to serve. If they cannot make money they will just shut down.
Clean Energy Alternatives
This report proposes replacing peaker plants with “renewable and clean energy alternatives”. It states:
However, solar and wind power alone cannot replace peaker plants, because the power they produce cannot be dispatched on command, and they have limitations on when they generate energy (e.g., solar photovoltaic (PV) systems can only generate optimal energy amounts on sunny days). For this reason, wind and solar energy systems are known as variable renewable energy sources. Combining battery storage technologies with renewables can address this limitation. Replacing peaker plants with batteries has now become a viable and profitable solution, due to the rapidly declining cost of energy storage systems. Ideally, the batteries replacing peaker plants would be charged with local, renewable energy resources.
The motivation for the PSE peaker project that provides the technical basis of this report appears to support the use of batteries as a clean energy alternative to fossil-fired power plants. By motivation I mean the likely source of funding for their analysis. As a result, it is no surprise that batteries are touted as the solution. Unfortunately, the PEAK coalition report fails to temper the enthusiasm of the battery “solution”. Statements such as “Experts have found—and real-world examples have proven—that battery storage and renewable generation may be less expensive to develop and manage than the rarely used but heavily polluting fossil fuel power plants, while also meeting or exceeding the same performance standards” are suspect at best.
For example, I will consider options to build new generation to replace the energy produced at the Astoria Gas Turbine, Gowanus Generating Station, and Narrows Generating Station peaking plants on a typical high-load day – June 18, 2018. All three plants operate simple-cycle combustion turbines that can burn natural gas or kerosene. All three facilities are on the order of 50 years old and, in my opinion, should be replaced.
The peak hourly load in this example was 752 MW so I used US Energy Information Administration (EIA) construction cost data for electric generators installed in 2017 information to estimate costs. The report provides $/kW estimates for different technologies, locations and configurations. I estimated the cost of a new combined cycle power plant similar to the one proposed to re-power Gowanus and Narrows and what was proposed for the two permit applications for re-powering the Astoria gas turbine facility. According to EIA the average construction cost ($/kilowatt of installed nameplate capacity) of a combined cycle unit was $829 so a replacement facility would cost $674 million. The average construction cost ($/kilowatt of installed nameplate capacity) of a utility-scale solar PV facility using crystalline silicon, axis-based tracking panels is $2,135 so a replacement facility would cost $1,606 million or nearly twice as much. The average construction cost ($/kilowatt of installed nameplate capacity) of a land-based wind turbine facility (plant size 200-500 MW) is $1,526 so a replacement facility would cost $1,148 million. It is often said that renewable energy is cheaper than fossil-fired energy but these numbers from 2017 clearly are refute that presumption.
The bigger problem, and one that should always be kept in mind that even if the cost of a solar and wind are equal to or a little less than the cost of a new fossil-fired plant, renewable energy is not dispatchable. In this example I will only address the storage needed to handle the output for the existing peaking turbines but because renewable energy is diffuse transmission lines are needed. Fossil-fired units provide grid support services but solar and wind generators do not. Those support services are not considered in this example.
My interpretation of the PSE proposed alternative and the PEAK Coalition plan is to rely on energy storage to replace the output of the existing combustion turbines. The Calculated Cost Breakdown for a U.S. Li-ion Standalone Storage System for June 18 2018 Example Peak provides the information necessary to estimate the energy storage batteries necessary to replace the turbines as well as the estimated battery requirements. I simply estimated battery configurations needed by picking a capacity to cover the minimum needed for as long a period as possible and then repeated the process until the storage capacity met the observed load. For example, at Astoria there were six hours of load and a battery with 280 MW capacity operating for six hours combined with a battery with 200 MW operating for one hour could completely cover the generation at that facility. This simplistic approach also does not include energy losses due to charging and discharging.
It turns out that assumption is wrong because the second NREL report abstract notes that “The lifetime of these batteries will vary depending on their thermal environment and how they are charged and discharged. Optimal utilization of a battery over its lifetime requires characterization of its performance degradation under different storage and cycling conditions.” The report concludes: “Without active thermal management, 7 years lifetime is possible provided the battery is cycled within a restricted 47% DOD operating range. With active thermal management, 10 years lifetime is possible provided the battery is cycled within a restricted 54% operating range.” Because of the high cost of the batteries I assume that it would be best to extend the lifetime as much as possible. When the 54% operating range constraint is added, more batteries are required and cost to replace the power produced by these three peaking plants on June 18, 2018 would be $3,651 million. One other thing needs to be pointed out. If we assume that the life expectancy of the combustion turbines, solar arrays and wind turbines is 30 years that means that the battery storage for the renewable power would have to be replaced twice over the lifetime of the facilities.
Furthermore, the energy storage estimates in this example have no real-world counter parts. According to the Hornsdale Power Reserve website “At 100MW/129MWh, the Hornsdale Power Reserve is the largest lithium-ion battery in the world, and provides network security services to South Australian electricity consumers in concert with the South Australian Government and the Australian Energy Market Operator (AEMO)”. According to the PEAK coalition report “In October 2019, the New York Public Service Commission (PSC) approved the development of a 316-MW, 8-hour-duration battery at the Ravenswood Generating Station in Long Island City”.
Dirty Energy, Big Money states “Experts have found—and real-world examples have proven—that battery storage and renewable generation may be less expensive to develop and manage than the rarely used but heavily polluting fossil fuel power plants, while also meeting or exceeding the same performance standards”. This statement is just plain wrong. As soon as energy storage is added to the renewable “solution” the projected costs rise exponentially and there are no real-world examples for policy decisions.
Benefits of the PEAK Coalition Proposed Alternative
The report claims that “Replacing peaker plants with renewable energy and battery storage, if done right, brings a host of benefits in addition to efficient, clean, dispatchable electricity.” The report does not explain how a “done right” replacement with renewable energy and battery storage could be accomplished. For example, there is no apparent recognition that the NYISO currently requires that at least 80% of New York City’s electric generating capacity needs be met through in‐City generation. My impression is that the presumption is that the PEAK Coalition believes that solar can be used in the city. However, I think the space requirements make that unlikely. For ten Article Ten solar energy applications currently in the queue, 5.4 acres per MW was the lowest spatial requirement. For my example of 752 MW of peaking power, 602 MW would have to be produced in the city and at 5.4 acres per MW that means that there would have to be five square miles of solar panels. I am sure that there are no open areas that size so the panels will have to be installed on buildings. That would add to the costs substantially.
The lack of any kind of plan is not the only issue with proposed alternative. The benefits listed are as superficial and innumerate. Consider the discussion on resiliency per: “A transition toward renewable energy and energy storage technologies can provide energy resiliency, backup power, and other benefits at the local level”. I do not consider an energy system resilient when it is unavailable half the time like solar or is subject to the vagaries of weather like the wind. The current emphasis is on the summer peak but New York’s aspirational climate targets will require electrification of heating a necessity which means the winter peak will become much more of an issue. As a result, the worst-case load situation may not be the annual peak peak but could be a combination of high load and low renewable energy inputs. That is not the sign of a resilient system. It gets worse when the report states “Resiliency planning is particularly important for critical facilities throughout the five boroughs, including hospitals, evacuation centers, cooling centers, and food distributions hubs” and gives an example of a solar array on a school that serves as an evacuation center during emergencies. If the facility is critical then redundant energy supplies not based on intermittent renewables are needed. If there is an ice storm and the power lines go down then what? The obvious, but politically incorrect solution, is to have a natural gas fired turbine generate the power needed by the micro-grid.
Another benefit claimed is reduced air pollution and resulting health improvements. The report states “Using renewable energy to charge batteries eliminates greenhouse gas emissions. Statewide, it is estimated that adding 1,500 MW of energy storage would avoid one million tons of CO2 emissions”. In order to get the one million ton reduction the addition of 1,500 MW would have to displace the large steam boilers PSE includes in their peaker category. Those are not candidates for battery storage replacement. The report claims: “With over 1.2 million New Yorkers living within a one-mile radius of a fossil fuel peaker plant, the reduction of air pollutants from peaker plants would have a significant impact on the health and quality of life of people living in the five boroughs of New York City”. As previously explained in this post, that claim is very unlikely to be true.
Another benefit claimed would address the energy burden on under-resourced communities. The report explains that energy poverty is a serious issue in New York City and goes on to claim that a significant portion of utility bills is directly related to payments for the “outdated fossil fuel peaker plants”. I do not understand how environmental and social justice organizations can support the idea that the renewable and energy storage transition will lead to lower costs when every jurisdiction that has tried to implement those resources has seen marked increases in prices. I am convinced that New York’s climate aspirations will result in much higher prices and the communities that these organizations purport to serve will be impacted the most.
The final benefit claimed is that the proposed transition will mean that “Instead of capacity payments going to private hedge funds or equity firms that own fossil fuel peaker plants, billions of dollars in ratepayer funds could instead be used to invest locally in publicly-owned and community-owned, distributed renewable and battery storage alternatives in New York City.” The numbers shown in this report suggest that the transition will be far more expensive that investing in a natural-gas fired combined cycle power plant. According to EIA the power plant that could provide the energy produced by three old peaking power facilities on June 18, 2018 would cost $674 million and would last at least 30 years. If in-city solar were built it would cost $1,606 million and could also last 30 years. The fatal flaw in the economic argument is the need for energy storage. I estimate that, based on NREL estimates, energy storage would cost $3,651 but would only last ten years. It is very unlikely that energy storage can come down significantly from the $10.953 million 30-year cost.
Policies to Advance the Transition
I only have one comment on this section. The report notes that “New York City, strict fire safety rules make it very challenging to install energy storage batteries in most buildings, though there are clear guidelines for siting these batteries outdoors.” There is a reason for those strict fire safety rules, namely that if the batteries are operated improperly, they can catch fire. The health impacts of the toxic pollutants emitted during a battery fire are a real concern that cannot be overlooked.
Conclusion
I will conclude this post by addressing one paragraph:
“Fossil peaker plants in New York City are perhaps the most egregious energy-related example of what environmental injustice means today. Throughout one of the most diverse and technologically developed cities in the world, numerous polluting oil and gas peaker plants in the City are sited in low income communities and communities of color. These environmental justice communities continue to bear the brunt of the harmful impacts from dirty energy and industrial infrastructure that pose significant public health and environmental hazards. At the same time, private companies receive billions of dollars to keep this polluting infrastructure in place.”
As shown here, the evidence presented for the egregious environmental injustice claim is more rhetoric than fact. There is no benign way to make electricity but affordable and reliable electricity is a necessity for public safety, health and welfare. Today’s question is whether New York City can risk reliability on unproven technology at the scale needed for its needs and can afford the costs needed to make intermittent and diffuse renewable energy available when and where it is needed. I do not dispute that there is a problem with peaker power plants in New York City but this study over-estimates the effects of the existing plants and under-estimates the difficulty replacing them with anything other than fossil fuels.
Update June 30, 2020: I wrote a layman’s summary on this issue here.
New York State energy and environmental policy is more about optics than results. Nowhere is this more apparent than the recent spate of opinion pieces, reports, and even policy proposals related to peaking power plants. In May 2020, the PEAK Coalition released a report entitled: “Dirty Energy, Big Money”. The focus of the study is the “peaker” power plants that operate when energy demand in New York City spikes above normal levels. Because I have been involved with this issue and these plants for over 20 years, I want to review this report.
At first glance there are enough technical issues for a blog essay but when I started to research the article, I realized that I needed to do a background post on the primary air quality problem associated with these facilities, the organizations behind the report, the State’s response to date, the underlying issue of environmental justice and address the motivation for the analysis. This post addresses those aspects of the report and will be followed up by a post on technical issues and another post on the analysis that was the basis of the technical claims.
I am a retired electric utility meteorologist with nearly 40 years-experience analyzing the effects of meteorology on electric operations. I have been involved with the peaking power plants in particular for over 20 years both from a compliance reporting standpoint and also evaluation of impacts and options for these sources. This background served me well preparing this post. The opinions expressed in this post do not reflect the position of any of my previous employers or any other company I have been associated with, these comments are mine alone.
Air Quality Background
In my opinion the most difficult air quality issue today is ozone attainment. Ground-level ozone is created by chemical reactions between oxides of nitrogen (NOx) and volatile organic compounds (VOC). Those pollutants are emitted by cars, power plants, industrial boilers, refineries, chemical plants, natural sources and other man-made sources and when they chemically react in the presence of sunlight, they create ozone. Ozone is most likely to reach unhealthy levels on hot sunny days in urban environments but because NOx and VOC as well as ozone can be transported long distances by wind rural areas are affected and urban areas are affected by sources far upwind. Ultimately the problem is that the conditions most conducive to create ozone are also the conditions that increase electricity demand for cooling so the peak load of electric generation produces the most emissions. In order to provide the power necessary to keep the lights on when people really want and need it, the existing power grid has facilities that were designed to operate infrequently. In New York City that capability is exemplified by 86 simple-cycle turbines currently operating.
The PEAK Coalition defines their problem with the existing situation as follows:
“On days with extreme weather, like heat waves or sub-zero temperatures, residents consume more energy to stay cool and warm, which puts excessive demand on the grid. In response to this increased demand in electricity, highly polluting power plants known as “peakers” fire up in the South Bronx, Sunset Park, and other communities of color throughout New York City. These inefficient peakers spew harmful emissions into neighborhoods already overburdened by pollution, exacerbating widespread health problems. Peaker plants are a prime example of how low-income communities and communities of color bear the brunt of a host of energy and industrial infrastructure that poses significant public health and environmental hazards.”
Note that the Coalition quite rightly points out that these power plants also operate in the winter when energy demand also increases. As New York State implements its aspirational greenhouse gas emission reduction goals natural gas and oil heating will have to be replaced by electric heating so demand will be further increased.
State Response
The air quality problem in the Northeast is so complicated that the Clean Air Act created the Ozone Transport Commission (OTC) specifically to with EPA on transport issues and for developing and implementing regional solutions to the ground-level ozone problem in the Northeast and Mid-Atlantic regions. New York State has been actively involved with this organization since its inception. The first related presentation that I could find that specifically addressed emissions and air quality on high electric demand days was in 2006. While there is an undeniable link between high energy demand and the high emissions that create peak ozone levels there is on over-riding requirement to keep the lights on.
DEC worked for years with other agencies, the New York Independent System Operator and other stakeholders to address this aspect of the peaking units. Ultimately in late 2019 they promulgated new limits for the simple cycle turbines such that they will be required to install controls or shut down. The compliance date for that regulation is May 2023 and the state may grant a two-year compliance extension to peaker plants deemed a “reliability resource by the NYISO or transmission owner”. The reliability analyses and expected responses are evolving at this time.
Advocates believe that EJ communities are New York City’s most climate-vulnerable people. New York State recently enacted the Climate Leadership and Community Protection Act (CLCPA) that establishes Statewide GHG emission reduction requirements and renewable and clean energy generation targets. The CLCPA also includes “multiple provisions that recognize that historically disadvantaged communities often suffer disproportionate and inequitable impacts from climate change”. The DEC is currently revising its proposing revisions to 6 NYCRR Part 242, “CO2 Budget Trading Program” that implement regulations for the Regional Greenhouse Gas Initiative (RGGI). The proposed revisions expand its applicability to include certain smaller sources that are also named in this report.
PEAK Coalition
The PEAK Coalition has been organized to “end the long-standing pollution burden from power plants” in New York City’s environmental justice communities. According to their overview the following organizations are in the PEAK Coalition: UPROSE, THE POINT CDC, New York City Environmental Justice Alliance (NYC-EJA), New York Lawyers for the Public Interest (NYLPI), and Clean Energy Group (CEG). UPROSE promotes “sustainability and resiliency in Brooklyn’s Sunset Park neighborhood through community organizing, education, indigenous and youth leadership development, and cultural/artistic expression”. THE POINT Community Development Corporation is “dedicated to youth development and the cultural and economic revitalization of the Hunts Point section of the South Bronx”. NYC-EJA is a “non-profit, city-wide membership network linking grassroots organizations from low-income neighborhoods and communities of color in their struggle for environmental justice”. NYLPI has “fought for more than 40 years to protect civil rights and achieve lived equality for communities in need”. CEG is a “leading national, nonprofit advocacy organization working on innovative policy, technology, and finance strategies in the areas of clean energy and climate change”.
Report Acknowledgements
The following is the text from the report’s acknowledgement section:
Dirty Energy, Big Money was prepared by the PEAK Coalition and produced in collaboration with a national network of research partners. This report would not have been possible without the help of many dedicated people. We want to thank the exceptionally hard working and talented teams at Strategen Consulting and at Physicians, Scientists, and Engineers for Healthy Energy for their assistance.
The authors would also like to thank the New York State Energy Research and Development Authority, New York Power Authority, and New York City Council member Costa Constantinides for their continued support in helping advance the transition to a cleaner and more equitable energy system.
Finally, PEAK also thanks the numerous individuals and organizations that provided constructive technical feedback during the stakeholder review period. These efforts dramatically improved the quality of the final product.
This report was made possible through the generous support of the Scherman Foundation’s Rosin Fund. The views reflected in the report are entirely those of the authors.
Environmental Justice
This section provides an overview of environmental justice as background to the report. EPA defines environmental justice as “the fair treatment and meaningful involvement of all people regardless of race, color, national origin, or income, with respect to the development, implementation, and enforcement of environmental laws, regulations, and policies”. They state that this goal will be achieved “when everyone enjoys: the same degree of protection from environmental and health hazards, and equal access to the decision-making process to have a healthy environment in which to live, learn, and work”.
The New York State Department of Environmental Conservation (DEC) defines environmental justice as the “fair and meaningful treatment of all people, regardless of race, income, national origin or color, with respect to the development, implementation, and enforcement of environmental laws, regulations and policies. Environmental Justice allows for disproportionately impacted residents to access the tools to address environmental concerns across all of DEC’s operations”.
Ultimately environmental justice (EJ) is another way of expressing the Golden Rule and I fully support the concept and intent of incorporating specific requirements to address this in environmental decision-making. So far so good. However, I am a numbers guy and have had trouble figuring out how this should be applied in practice. New York State’s Article 10 permitting process for siting major electric generating facilities references the DEC regulation Part 487 “Analyzing Environmental Justice Issues in Siting of Major Electric Generating Facilities Pursuant to Public Service Law Article 10”. In my opinion, New York’s approach to environmental justice is keyed to disproportionate impacts.
The definition of disproportionate is critical to the ramifications of New York EJ regulation. However, the definition is so vague that interpretation is a problem. Disproportionate impact analysis requires comparison between the EJ community and a “Comparison Area”. The Comparison Area is defined as a community in the same county and adjacent to the EJ community. Section 487.9 Comprehensive Demographic, Economic and Physical Descriptions (d)(2) defines the measures used for the comparison:
In evaluating the significance of any adverse environmental and public health impacts of the proposed facility, the applicant shall measure the impacts against regulatory thresholds or standards, as applicable, and shall also consider the following:
scope, magnitude, frequency, and duration of the impacts on the environment, public health, and quality of life in the Impact Study Area;
nature of the impacts on sensitive populations including children and the elderly;
degree of increased risk in the event of natural or man-made disasters; and
any other information necessary to evaluate significance of the adverse impacts.
For the purposes of illustrating the potential difficulties defining disproportionate impacts, consider the following example for the air quality impacts of a facility on three communities. In all the examples, the total impact is less than the National Ambient Air Quality Standard so the concern is whether the effect of the facility is disproportionate. Mediterranean Avenue and Baltic Avenue represent the Environmental Justice Community of Monopoly where the lowest rents are charged. The comparison communities are the adjacent properties of Oriental, Vermont and Connecticut Avenues (grey community) and Park Place and Boardwalk (blue community) where the highest rents are charged.
The Disproportionate Impact Table illustrates the wide range of relative impacts for this simple example. If the EJ community is impacted by the facility and impacted by cumulative impacts while the comparison communities are not affected by either, then the impact is clearly disproportionate. If all the impacts are the same then the impact clearly is proportionate. However, neither situation is likely. Adjacent communities likely have similar direct and cumulative impacts and must have the same background. Even when dealing with a specific numerical limit, interpretation is ambiguous. For example, if the impacts to the EJ community and the grey comparison community are the same, but the blue community has very much lower impacts is that disproportionate to the EJ community?
As previously noted, I support the concept that EJ communities should not be disproportionately impacted by power plants. Assuming that stakeholders can agree on what constitutes a disproportionate impact then we can move forward. The problem that I believe is coming up now is that the EJ advocacy organizations are demanding zero risks in order to redress past injustices. For example, in May 2017 Governor Cuomo announced New Locally Sourced Microgrid to Power the Empire State Plaza but the following February the New York Power Authority announced additional studies for the project in response to intense EJ advocacy efforts. In September 2019 the microgrid plan was cancelled much to the delight of the local EJ advocates. While the microgrid plan did have effects on the local community they represent orders of magnitude less impacts than the original facility but that was not good enough. There is no benign way to generate electricity. I worry that emotional arguments will color future EJ discussions and prevent rational decision-making for cost-effective solutions.
Motivation for the Report
The overview of the report notes that The PEAK coalition will be the “first comprehensive effort in the US to reduce the negative and racially disproportionate health impacts of a city’s peaker plants by replacing them with renewable energy and storage solutions”. Their collaboration brings “technical, legal, public health, and planning expertise to support organizing and advocacy led by communities harmed by peaker plant emissions”. They propose a “system of localized renewable energy generation and battery storage to replace peaker plants”. This is supposed to “reduce greenhouse gas (GHG) emissions, lower energy bills, improve equity and public health, and make the electricity system more resilient in the face of increased storms and climate impacts”. I will address those claims in another post.
As noted, the CLCPA includes specific requirements to address EJ community concerns, DEC has promulgated a law that will shut down 100 of the old and inefficient simple cycle turbines as soon as possible without endangering reliability and the proposed revisions to New York’s RGGI rules expands applicability to many of the sources that are called out in the report. It seems to me that this shows that the Cuomo Administration has delivered on its promises to the EJ community so why did this report come out at this time.
The conclusion of the report suggests that the timing is an example of not letting a crisis go to waste.
“As the nation faces an unprecedented public health crisis with the COVID-19 respiratory virus, the historic and disproportionate environmental burdens imposed on the most vulnerable among us by burning fossil fuels can no longer be ignored as a serious public health threat. COVID-19 has cast a light on the existing health disparities and vulnerability in environmental justice communities. New research links the direct correlation between long-term exposure to air pollution and significantly higher rates of death in people with COVID-19, which we are seeing now in environmental justice communities long-plagued by health disparities and vulnerability due to the exposure to air pollution from peaker plants—nearly always sited in under-resourced communities.”
I believe that this “new research” is referring to a Harvard study that on April 24, 2020 claimed “ that an increase of 1 μg/m3 in PM2.5 is associated with an 8% increase in the COVID-19 death rate (95% confidence interval [CI]: 2%, 15%”. Several days earlier this report was claiming that the increase in death rate was 15%. But a new study from University of Washington and Stanford University researchers reports an inverse relationship between smoking and death from COVID-19 — i.e., countries with higher rates of smoking had lower rates of death from COVID-19. As noted here, smoking is a very intense exposure to PM2.5. In breathing an hour of average US air, you will shallowly inhale less than 9 micrograms of PM2.5. Compare that with smoking a single cigarette during which you will deeply inhale anywhere from 10,000 to 40,000 micrograms of PM2.5. I suggest that it is premature to claim any effect on COVID-19 from air pollution.
Conclusion
While I support the concept of addressing environmental justice concerns, I also suspect that criticizing aspects of their demands is something akin to disparaging mom and apple pie. The primary reason I prepare these analyses is that I believe that cheap and reliable energy, in general, and electricity, in particular, is a basic human right so that should be a primary social and environmental justice concern. I am convinced that that New York State energy policy is going raise the cost of energy significantly and I worry that it will risk electric reliability as well. I intend to follow this background post up with an evaluation of the technical claims and proposed solutions in this report to see how they rate in that context.
The New York State Public Service Commission (PSC) issued an order commencing a proceeding to examine how to reconcile resource adequacy programs and the State’s renewable energy and environmental emission reduction goals. This post summarizes the reply comments I submitted in this proceeding on resource adequacy primarily as an accessible reference. If this topic interests you then I suggest you read my initial comments and my reply comments . I previously summarized my initial comments here.
Materials and information are available in the Department of Public Services (DPS) resource adequacy matters docket Case 19-E-0530. According to the Order Instituting Proceeding and Soliciting Comments, the inquiry is “necessitated by the Commission’s statutory obligations to ensure the provision of safe and adequate service at just and reasonable rates. Costs to consumers are a primary and ultimate consideration, recognizing that the necessary investments in resources must have sound economics.”
Summary
A primary point of emphasis in my comments is that I believe that the Commission’s statutory obligations to ensure the provision of safe and adequate service at just and reasonable rates is not being addressed with respect to the Climate Leadership and Community Protection Act (CLCPA). The fact of the matter is that absent a comprehensive evaluation that assesses historical renewable energy resource availability coupled with historical and projected load, no one knows if a 100% fossil-free electric sector is possible in New York. The legislation that mandated that target naively assumed it was feasible and affordable but those assumptions may violate the laws of physics. It would be far better to determine the consequences of the CLCPA now than to try to muddle through trying to implement something that would have far worse consequences to the citizens of New York than the purported problem.
My reply comments cover several aspects of the comments submitted by others and information that has become available since the initial comment period ended. I address the lack of representation for the residential consumer in the parties commenting on the proceeding. My reply comments do not address specifics of any of the initial comments but I do offer cautionary observations on the comments describing the purported success of the de-regulated market and support for the NYISO carbon pricing initiative.
Since the time the initial comments were submitted other feasibility issues came up. The NYISO had the Analysis Group evaluate winter peak resources for the short-term. In response to a NYISO press release on a record for wind generation I took another look at the historical wind data. The Citizen’s Budget Commission did an analysis of the CLCPA that included an estimate of the future load. I show that all these studies are relevant and underscore the need for the feasibility study.
Finally, I made some recommendations. I re-iterated my plea for a comprehensive feasibility study and cumulative environmental impact study. I suggest that the State provide solar energy facility applicants with a site-specific design year database based on the feasibility study meteorological data to improve their applications. I recommend full payment for renewable resources only if they are dispatchable, i.e., they include energy storage. I also have a suggestion for the future stakeholder process and recommend that this proceeding endorse energy storage R&D.
For the past month or so I have been preparing comments on the New York State Department of Environmental Conservation (DEC) proposed revisions to their Part 242 CO2 Budget Trading Program rule. I submitted the comments on June 26, 2020. In a companion post I addressed the background for the rule revisions and rationale used for the significant rule changes. This post summarizes my comments on the Regulatory Impact State that justifies the proposed revisions.
I submitted comments because I want my family to be able to afford to continue to live in New York State. The proposed rule is consistent with the Climate Leadership and Community Protection Act (“Climate Act”) that will necessarily affect the price of energy in New York and based on results elsewhere I believe those costs will ultimately be unacceptable. I have written a series of posts on the feasibility, implications and consequences of the law. I am a retired electric utility meteorologist with nearly 40 years of experience analyzing the effects of emissions on the environment. The opinions expressed in this post do not reflect the position of any of my previous employers or any other company I have been associated with, these comments are mine alone.
Introduction
I describe the specifics of the proposed revisions and my concerns in the companion post. One of the purported benefits of this regulation is that New York’s climate leadership will entice other jurisdictions to emulate New York by setting an example. However, the justification provided for these revisions provides New York citizens insufficient evidence to support the proposed changes and sets a poor example for others to follow. I analyzed the claims in the Regulatory Impact Statement (RIS) that were used to justify the proposed actions and I will discuss those comments here. The RIS has mandatory discussion items and I will not address my comments on items not related to justification of the proposed actions.
Regulatory Impact Statement
The Regulatory Impact Statement (RIS) is a mandated component of DEC rule-making. It describes the statutory authority and legislative objectives, lists the needs and benefits, estimates costs, changes to paperwork, local government mandates, notes if there is any duplication with other Federal and State regulations, lists alternative, determines if the regulation is consistent with Federal standards and provides a compliance schedule. I wish I could say that the RIS makes a compelling case for the proposed action but I can’t. This is important because one of the purported benefits of this regulation and New York’s climate leadership is that New York will lead the way for others setting an example that they will emulate. However, absent compelling arguments, that benefit will not be realized.
The general approach for current New York energy and environmental rule-making associated with climate change is to unequivocally associate Greenhouse Gas Emissions (GHG) with a litany of climate change impacts that are happening now and will get much worse in the future. I have been planning to spend time addressing this simplistic argument for a long time and this regulation gave me the opportunity to comment. In the following sections using the titles from the RIS, I quote text from sections in the RIS and provide my comments in the following italicized, indented sections.
Introduction
The burning of fossil fuels to generate electricity is a major contributor to climate change because fossil-fuel generators emit large amounts of CO2, the principal greenhouse gas (GHG). Overwhelming scientific evidence confirms that a warming climate poses a serious threat to the environmental resources and public health of New York State – the very same resources and public health the Legislature has charged the Department to preserve and protect. The warming climate threatens the health and well-being of the State’s residents and citizens, the State’s property, and the natural resources held in trust by the State, including, but not limited to, the State’s air quality, water quality, marine and freshwater fisheries, salt and freshwater wetlands, surface and subsurface drinking water supplies, river and stream impoundment infrastructure, and forest species and wildlife habitats. Not only will the proposed Program revisions help to further counter the threat of a warming climate, they will also produce significant environmental co-benefits in the form of improved local air quality, and a more robust, diverse and clean energy supply in the State.
The biggest flaw in the RIS is the failure to quantify the impact of the proposed action on the alleged impacts of a warming climate. Instead there are vague allusions that the proposed revisions will “help to further counter the threat of a warming climate”. In order to properly evaluate the benefits and costs of the proposed revisions the RIS should estimate the global warming potential impacts of the proposed action.
In the absence of such an evaluation I calculated the effect of total elimination of New York’s 1990 218.1[1] million metric ton greenhouse gas emissions on projected global temperature rise. I found there would be a reduction, or a “savings,” of approximately 0.0032°C by the year 2050 and 0.0067°C by the year 2100. To give you an idea of how small this temperature change is consider changes with elevation and latitude. Generally, temperature decreases three (3) degrees Fahrenheit for every 1,000-foot increase in elevation above sea level. The projected temperature difference is the same as going down 27 inches. The general rule is that temperature changes three (3) degrees Fahrenheit for every 300-mile change in latitude at an elevation of sea level. The projected temperature change is the same as going south two thirds of a mile.
Of course, the RIS should project what this particular action will do for global temperature. The RIS Model Rule Policy Case Program Design Assumption description states that CO2 emissions in New York are projected to be 3.41 million tons lower in the Model Rule Policy Case than in the Reference Case in 2031. Using the same methodology as before I found there would be a reduction, or a “savings,” of approximately 0.00005°C by the year 2050 and 0.00009°C by the year 2100. The projected temperature difference is the same as going down 3/8 of an inch and the projected temperature change is the same as going south 50 feet.
New York’s actions should also be considered relative to the rest of the world. According to the China Electricity Council, about 29.9 gigawatts of new coal power capacity was added in 2019 and a further 46 GW of coal-fired power plants are under construction. If you assume that the new coal plants are super-critical units with an efficiency of 44% and have a capacity factor of 80%, the reductions provided by this program will be replaced by the added 2019 Chinese capacity in 16 days or 6 days if the 2019 capacity and the units under construction are combined. Clearly, in the absence of worldwide commitments this proposal has no tangible value to the citizens of New York.
The RIS also claims that the emission reductions will also produce significant environmental co-benefits in the form of improved local air quality, and a more robust, diverse and clean energy supply in the State. I take issue with the environmental co-benefits arguments simply because I have never seen documentation that confirms those benefits relative to the observed air quality improvements in my lifetime (see for example my evaluation of PM 2.5 in New York City). Combining claimed benefits for robust and diverse energy supply with a clean energy supply is unsubstantiated rhetoric. In order for the power supply to be robust it has to be dispatchable whereas wind and solar clean energy is not. In order for the power supply to be diverse it cannot be shut down by a singular event and wind and solar can be shut down by a relatively common singular set of weather conditions at night.
The Greenhouse Effect and the Warming Climate
A naturally occurring greenhouse effect has regulated the earth’s climate system for millions of years. Solar radiation that reaches the surface of the earth is radiated back out into the atmosphere as long wave or infrared radiation. CO2 and other naturally occurring GHG emissions trap heat in our atmosphere, maintaining the average temperature of the planet approximately 60°F above what it would be otherwise. An enhanced greenhouse effect and associated climate change results as large quantities of anthropogenic GHGs, especially CO2 from the burning of fossil fuels, are added to the atmosphere.
There is no question that the greenhouse effect regulates global temperatures, that additional greenhouse gases will enhance that effect, that anthropogenic GHG emissions have added to the observed trend in GHG atmospheric concentrations, that the climate is warming and that the anthropogenic GHG emissions likely contributed to the observed warming. However, given that there are many factors affecting climate change and that an enhanced greenhouse effect impacts not only temperature but also moisture which could have a negative feedback, it is naïve to assume that all the observed warming is caused solely by the greenhouse gas effect.
From 1983 until his retirement in 2013, Dr. Richard Lindzen was Alfred P. Sloan Professor of Meteorology at the Massachusetts Institute of Technology. He published over 200 papers and books and his research is still cited about 600 times per year. He recently published another scientific paper (Lindzen, 2020) that raises some important points relative to the greenhouse effect as it pertains to New York’s energy policies:
Doubling the atmospheric CO2 concentration from 280 ppm to 560 ppm results in just a 1-2% perturbation to the Earth’s 240 W/m² energy budget. This doubled-CO2 effect has less than 1/5th of the impact that the net cloud effect has. And yet we are asked to accept the “implausible” claim that change in one variable, CO2, is predominantly responsible for altering global temperatures.
A causal role for CO2 “cannot be claimed” for the glacial-to-interglacial warming events because CO2 variations follow rather than lead the temperature changes in paleoclimate records and the 100 ppm total increase over thousands of years produce “about 1 W/m²” of total radiative impact.
Since the mid-1700’s, atmospheric concentrations of GHGs have increased substantially due to human activities such as fossil fuel use and land-use change. CO2 has a very long residence time in the atmosphere and, thus, has a lasting effect on the climate. Average atmospheric CO2 concentrations exceeded 407 parts per million in 2018, which according to ice core data, is higher than at any point in the past 800,000 years and the rate of increase is 100 times faster than previous natural increases at the end of the last ice age.
There are two aspects of these claims. If you look at the CO2 data going further back in geologic time, as shown in the following grapch, there is nothing particularly unusual about the record breaking CO2 levels of the past 800,000 years The thing that does stand out however is that we are cooler than in the past.
The second aspect is the rate of increase claim. The problem is that measurement resolution of proxy measurements of CO2 and temperature are not as finely resolved as today’s instrumental data. The only way to directly compare the instrumental data to the pre-industrial proxy data is to filter the instrumental data down to the resolution of the proxy data. This leads to climate reconstructions with “enhanced variability during pre-industrial times” and “result in a redistribution of weight towards the role of natural factors in forcing temperature changes, thereby relatively devaluing the impact of anthropogenic emissions and affecting future predicted scenarios.”[2]
There is clear scientific consensus that anthropogenic emissions of CO2 are contributing to the observed warming of the planet as presented in the Fifth Assessment Report of the Intergovernmental Panel on Climate Change. The large and persuasive body of research demonstrates through unequivocal evidence that the Earth’s lower atmosphere, oceans, and land surfaces are warming; sea level is rising; and snow cover, mountain glaciers, and Greenland and Antarctic ice sheets are shrinking. The Earth’s climate is changing, with adverse consequences already well documented across the globe, in our nation and in the State. Extreme heat events are increasing and intense storms are occurring with greater frequency. Many of the observed climate changes are beyond what can be explained by natural variability of the climate.
This description of the relationship between CO2 emissions and observed warming does not acknowledge that there is any scientific uncertainty about the greenhouse effect and climate change. The reality is that there is debate and New York State ignores the potential ramifications. Dr. Richard S. Lindzen, has summarized the scientific debate as follows:
I will simply try to clarify what the debate over climate change is really about. It most certainly is not about whether climate is changing: it always is. It is not about whether CO2 is increasing: it clearly is. It is not about whether the increase in CO2, by itself, will lead to some warming: it should. The debate is simply over the matter of how much warming the increase in CO2 can lead to, and the connection of such warming to the innumerable claimed catastrophes. The evidence is that the increase in CO2 will lead to very little warming, and that the connection of this minimal warming (or even significant warming) to the purported catastrophes is also minimal. The arguments on which the catastrophic claims are made are extremely weak –and commonly acknowledged as such.
In response to scientific projections of likely severe climate impacts of global average temperatures rise, the U.S. signed the1992 United Nations Convention on Climate Change. In 2016 the United States once again joined 197 countries in ratifying the Paris Climate Agreement, an enhancement to help the implementation of that Convention.
The claim that the United States ratified the Paris Climate Agreement is incorrect. The United States never properly joined the accord. It is a treaty that requires the advice and consent of the Senate. Instead, President Barack Obama chose to “adopt” it with an executive order. The Senate never voted on the treaty.
Impacts from Emissions Already Observed in New York’s Climate
New York’s climate has already begun to change, gradually taking on the characteristics of the climate formerly found in locations south of New York. The need for the reduction of CO2 emissions, including through the reduced emissions cap, budget adjustment, and establishment of the ECR, is clearly supported by numerous direct impacts that have been observed in New York State and presented in the 2011 New York State ClimAID assessment and the 2014 update to ClimAID.
The title of this section exposes a significant error in the understanding of the ClimAID assessments. In particular, those assessments described observed climate trends but did not attempt to attribute how much of the observed trends were linked to GHG emissions, how much were caused by other anthropogenic effects such as land-use changes and the urban heat-island effect, and how much was caused by natural variability. For example, the observed monthly data source for average temperature and precipitation was the United State Historical Climatology Network and page 21 of the 2011 ClimAID document states that “this data product is not specifically adjusted for urbanization”. One of the sites used to describe climate trends was at New York City’s Central Park. Clearly the urban heat-island has a significant effect on temperature at that location. Therefore, the RIS presumption that the only cause of all the observed trends was GHG emissions over-estimates their role in observed climate change trends.
These include:
Temperatures in New York State have risen during the twentieth century, with the greatest warming coming in recent decades – temperatures have risen on average 0.25°F per decade over the past century. This warming includes an increase in the number of extreme hot days (days at or above 90ºF) and a decrease in the number of cold days (days at or below 32ºF).
Because the effect of the urban heat-island is not considered these trends do not represent the trend due solely to the greenhouse effect.
Sea level rise. Sea level in the coastal waters of New York State and up the Hudson River has been steadily rising over the twentieth century, chiefly as a result of thermal expansion of ocean waters, melting of land ice and local changes in the height of land relative to the height of the continental land mass. Tide-gauge observations in New York indicate that rates of relative sea level rise were significantly greater than the global mean, ranging from 0.9 to 1.5 inches per decade.
The fact that New York tidal gauge rates of relative sea level rise are greater than the global mean shows that local changes in the height of land relative to the height of the continental land mass are a significant factor of sea-level rise that no amount of change to the greenhouse effect will affect.
Although the RIS purports to provide current information, consider an alternative assessment of current climate state based on data and not model speculation. Ole Humlum a former Professor of Physical Geography at the University Centre in Svalbard, Norway, and Emeritus Professor of Physical Geography, University of Oslo, reported “The State of the Climate 2019,” that presents ten key facts in the Executive summary:
“1. According to the [surface] instrumental temperature record (since about 1850), 2019 was a very warm year, but cooler than 2016.
In 2019, the average global air temperature was affected by a moderate El Niño episode, interrupting a gradual global air temperature decrease following the strong 2015–16 El Niño.
Since 1979, lower troposphere temperatures have increased over both land and oceans, but more so over land areas. The possible explanations include insolation, cloud cover and land use. {Caiazza note: if the greenhouse effect were the only cause of the temperature increase then there should be no difference over land vs over water.}
The temperature variations recorded in the lowermost troposphere are generally reflected at higher altitudes too. In the stratosphere, however, a temperature ‘pause’ commenced in around 1995, 5–7 years before a similar temperature ‘pause’ began in the lower troposphere near the planet’s surface. The stratospheric temperature ‘pause’ has now persisted for about 25 years.
The 2015–16 oceanographic El Niño was among the strongest since the beginning of the record in 1950. Considering the entire record, however, recent variations between El Niño and La Niña are not unusual.
Since 2004, when detailed recording of ocean temperatures began, the global oceans above 1900 m depth have, on average, warmed somewhat. The strongest warming (between the surface and 200 m depth) mainly affects the oceans near the Equator, where the incoming solar radiation is at its maximum. In contrast, for the North Atlantic, net cooling at the surface has been pronounced since 2004.
Data from tide gauges all over the world suggest an average global sea-level rise of 1–1.5 mm/year, while the satellite record suggests a rise of about 3.2 mm/year, or more. The noticeable difference in rate (a ratio of at least 1:2) between the two data sets still has no broadly accepted explanation.
Since 1979, Arctic and Antarctic sea-ice extents have had opposite trends, decreasing and increasing, respectively. Superimposed on these overall trends, however, variations of shorter duration are also important in understanding year-to-year variations. In the Arctic, a 5.3-year periodic variation is important, while for the Antarctic a variation of about 4.5-years’ duration is seen. Both these variations reached their minima simultaneously in 2016, which explains the simultaneous minimum in global sea-ice extent. This particularly affected Antarctic sea-ice extent in 2016.
Northern Hemisphere snow cover extent undergoes important local and regional variations from year to year. Since 1972, however, snow extent has been largely stable.
Tropical storms and hurricanes have displayed large annual variations in accumulated cyclone energy (ACE) since 1970, but there has been no overall trend towards either lower or higher activity. The same applies for the number of continental hurricane landfalls in the USA, in a record going back to 1851.”
Future Impacts from Emissions Predicted for New York’s Climate
Predictions of future impacts associated with emissions in New York further support the need for a substantial reduction in the CO2 emissions cap as well as the budget adjustment and ECR, as outlined in the proposed revisions to the Program. The 2011 New York State ClimAid assessment and 2014 update also examined how sea level rise, changes in precipitation patterns, and more frequent severe weather conditions will affect New York’s economy, environment, community life and human health. ClimAID used regionalized climate projections to develop adaptation recommendations and is a climate change preparedness resource for planners, policymakers, and the public.
The future impacts assessment in the RIS relies on the 2011 New York State ClimAid assessment and 2014 update that examined how sea level rise, changes in precipitation patterns, and more frequent severe weather conditions will affect New York’s economy, environment, community life and human health. There are three problems with those assessments: reliance on global climate model simulations, the use of Representative Concentration Pathway 8.5, and the use of a regional climate model.
Climate sensitivity
Predictions of substantial global warming assume that the climate is very sensitive to an increase in GHG concentrations. The RIS does not recognize that this is an active debate because of climate feedback in various models and that estimates in peer reviewed studies range from 0.8°C warming to almost 6.0°C warming by 2100. Clearly such a wide range
of uncertainty means climate model temperature projections remain dubious, at best. In my opinion climate sensitivity estimates based on measured data are more likely to be correct than GCM projected estimates and those estimates are invariably on the lower end of the range. The problem with the GCM estimates is cloud formation. For example, “Given current uncertainties in representing convective precipitation microphysics and the current inability to find a clear observational constraint that favors one version of the authors’ model over the others, the implications of this ability to engineer climate sensitivity need to be considered when estimating the uncertainty in climate projections.” To be clear, that means that modelers can conjure up whatever warming amount you want simply by tweaking how clouds form in response to the greenhouse effect.
Emissions RCP 8.5
In order to make a projection for the future it is necessary to not only project the effect of changing GHG concentrations but also project how emissions will change. The ClimAID assessment presents a range of possible projections but the worst-case impacts rely on a future emissions scenario that was not intended to be plausible. In short, the likelihood of the projected impacts that “make the case” for the proposed revisions are based on an unrealistic emissions scenario. While it does make for the scary story needed to justify the proposed action, the fact is that it is inappropriate for use as justification for it.
Regional Climate Model
One problem with a GCM is that in order to calculate the global climate a coarse horizontal grid is needed simply because of computational requirements. In order to account for New York-specific impacts using a finer grid resolution ClimAID developed a regional climate model. I believe they used a statistical technique to estimate regional climate impacts. If that assumption is correct then their results are flawed. In particular, the GCM gird resolution is so coarse that effects of the Great Lakes are not included. However, “These techniques assume that the relationship between large scale climate variables (e.g. grid box rainfall and pressure) and the actual rainfall measured at one particular rain gauge will always be the same.” Given that precipitation downwind of the Great Lakes is strongly influenced by lake-effect snow and rain, the large-scale precipitation estimates that do not include the Great Lakes means that this is clearly not the case.
Future Impacts from Emissions for New York State’s Resource Sectors
I did respond to all the problematic statements in this section. As shown above there are serious concerns with the primary projections of temperature change. The secondary projections of impacts to resource sectors is even more speculative especially because the alleged impacts require specific uncertain climatic outcomes. I highlighted several issues that demonstrate a lack of nuanced understanding of potential climate change impacts.
In the section on Coastal Zones, the RIS states “Superstorm Sandy gained additional strength from unusually warm upper ocean temperatures in the North Atlantic”. The RIS correctly does not attribute Superstorm Sandy to climate change. I do not disagree with the claim that the storm could have gained additional strength from unusually warm temperatures. I do want to point out that these claims point to the most likely long-term impact of anthropogenic climate change, i.e., impacts will be tweaks to the environment and not primary drivers of environmental change.
In the same section the RIS claims that New York’s shoreline will be adversely affected by climate change: “The major contributor to sea level rise is thermal expansion and melting of glaciers and ice sheets.” This section concerns Future Impacts from Emissions and therefore it is incompatible with the Impacts from Emissions Already Observed in New York’s Climate discussion of sea level. As correctly noted in that section “Sea level in the coastal waters of New York State and up the Hudson River has been steadily rising over the twentieth century, chiefly as a result of thermal expansion of ocean waters, melting of land ice and local changes in the height of land relative to the height of the continental land mass. Tide-gauge observations in New York indicate that rates of relative sea level rise were significantly greater than the global mean, ranging from 0.9 to 1.5 inches per decade”. Because New York tidal gauge rates of relative sea level rise are greater than the global mean shows that local changes in the height of land relative to the height of the continental land mass are a significant factor of sea-level rise that no amount of change to emissions will affect.
In the section on agriculture the RIS notes that “increased summer heat stress will negatively affect cool-season crops and livestock unless farmers take adaptive measures such as shifting to more heat-tolerant crop varieties and improving cooling capacity of livestock facilities”. Misleadingly, the section then goes on to say “A loss of milk production efficiency from heat effects could result in the loss of hundreds of millions of dollars annually for New York’s dairy industry” based on the following:
“Dairy farmers will also be impacted since milk production is maximized under cooler conditions ranging from 41°F to 68°F. New York is the third largest producer of milk in the United States, behind California and Wisconsin, with 14.9 billion pounds of milk produced in 2017. During the unusually hot summer in 2005, many New York dairy herds reported declines in milk production of five to 15 pounds of milk per cow per day (an eight to 20 percent decrease).”
The average July temperature in Syracuse is 71, Madison WI is 75, and Sacramento, CA is 77, so two states that produce more milk than New York have higher average temperatures. Additionally, the RIS mistakenly quotes a milk decrease from a weather event to support an alleged climate impact.
In the section on Air Quality and Public Health Benefits the RIS states:
“In addition to contributing to a 50% reduction in CO2 from affected power plants in New York, it is estimated that the RGGI program provided $1.7 billion in avoided public health costs in New York by reducing associated air pollutants. Across the RGGI region, it is estimated that the RGGI program helped avoid 16,000 respiratory illnesses, up to 390 heart attacks, and 300 to 830 deaths. At a more local level, according to a 2002 study, the expected health benefits of urban air pollution reductions from climate change mitigation strategies in the New York City area (assuming that they produce an approximately 10 percent reduction in PM10 and ozone concentrations), would be to avoid approximately 9,400 premature deaths (including infant deaths), 680,000 asthma attacks, and 12 million restricted activity days.”
I showed in my companion post that the primary reason for the emission reductions was fuel switching from coal and residual oil to natural gas. That means that the RGGI contribution to those reductions was on the order of 5% and not 50%. That also means that the avoided health impacts were mostly due to fuel switching and not RGGI.
A couple of points about health impacts in general and the referenced 2002 study and the potential impacts of a 10% reduction in PM10 and ozone concentrations in particular. Between 2000 and 2019 Northeast air quality trends show more improvement than a 10% reduction: PM10 is down 39%, PM2.5 is down 47%, ozone is down 24%, and SO2 is down 86%. Until such time that DEC can reference a study that shows the actual health benefits associated with the observed air quality improvements, I am not confident that their air quality health claim is accurate. Also note that future air quality impacts will be much smaller because the higher polluting coal and residual oil sources have already been reduced. CO2 reductions from natural gas firing will not produce as many reductions in PM and Ozone levels and no change in SO2.
Components of the Proposed Program Revisions
One of the problems with New York’s energy policy is demonstrated by this statement: “The reduction in the CO2 emissions cap to approximately align with current levels represents a critical step to combat the significant challenges presented by climate change and to advance sound energy policies that foster energy efficiency, a reduction in reliance on fossil fuels, and energy independence”. In particular, New York State has not done a holistic analysis of the energy and environmental alternatives proposed to replace fossil fuels. For example, this proposal is supposed to foster energy independence but in 2019 the United States was energy independent. New York’s energy plan proposes to rely on renewable energy which will require battery energy storage. Both technologies rely on rare elements which are not produced in sufficient quantities domestically to cover the requirements of the New York energy transition so we will become less energy independent. Furthermore, the production of these rare elements is environmentally destructive so the State is merely leaking environmental impacts elsewhere.
Benefits from the Proposed Program Revisions
This section notes: “The most recent version of the New York State Regional Greenhouse Gas Initiative-Funded Programs Status Report for the quarter ending December 31, 2018 estimates cumulative annual customer bill savings of $293 million.”
Unfortunately, in my companion post I showed that as a GHG emission reduction mechanism, New York’s RGGI investments fail to make investments that are less than the purported cost of the negative externalities for a ton of CO2 emitted today (the Social Cost of Carbon (SCC)). In fact, the cost per ton removed is an order of magnitude larger than the Obama-era SCC value. Therefore, New York’s investments are woefully cost ineffective which suggests that our resources should be invested in adaptation because we will not be able to afford the costs of mitigation.
There is a paragraph in this section that describes the Climate Act:
Most notably, as described above, the recently-enacted Climate Act establishes Statewide GHG emission reduction requirements and renewable and clean energy generation targets. In particular, ECL Section 75-0107, which was added by the Climate Act, requires a 40 percent reduction in Statewide GHG emissions from 1990 levels by 2030, and an 85 percent reduction from 1990 levels by 2050. Moreover, Public Service Law Section 66-p, which was also added by the Climate Act, establishes a target to generate 70 percent of the State’s electricity from renewable energy sources by 2030, and to generate 100 percent of the State’s electricity from carbon-free sources by 2040. The proposed revisions to the Program, including the additional reduction in the RGGI CO2 emissions cap and the establishment of the ECR, further the objectives of the Climate Act. Finally, the Climate Act also includes multiple provisions that recognize that historically disadvantaged communities often suffer disproportionate and inequitable impacts from climate change. The proposed revisions to the Program to expand its applicability to include certain smaller sources, many of which are located in such communities, are consistent with these provisions of the Climate Act.
This section concludes with claimed benefits of implementing the proposed revisions:
Climate change is a global problem and effective action at the national and international level is necessary in order to stabilize atmospheric GHG concentrations at acceptable levels. Notwithstanding this, particularly given the current federal Administration’s recent actions to slow or rescind various regulatory and other efforts to reduce GHGs nationally, action now at the State and regional level to reduce GHG emissions and to implement the revisions to the Program will benefit and reduce the risk of injury to New York and its citizens and residents from climate change. The risks of injury from a warming climate increase with the rate and magnitude of the warming, and in turn, the rate and magnitude of warming is primarily dependent upon the level of CO2 emissions. In addition, by implementing the proposed revisions to the Program now, New York and the Participating States can:
Reduce the long-term costs of addressing climate change. By acting now, states can avoid the need for more disruptive measures later.
As noted previously there is no quantitative estimate of the potential reduction of climate change costs that will accrue due to the proposed action.
Position the region ahead of competitors. Taking continued action to reduce the region’s carbon-intensity will create a competitive advantage relative to other parts of the country when additional action is taken at the national and international level.
The German attempt to implement a similar but much less ambitious GHG emissions program led to massive price increases: “AGerman online site Stromreportwrites that since the year 2000 the average electricity price for private households has risen from 13.94 to 30.43 euro cents per kilowatt hour (2019)”. If the cost of electricity is so much higher than elsewhere it will be a competitive dis-advantage.
Capture environmental co-benefits. Reducing power sector carbon emissions provides numerous environmental co-benefits, including reduced emissions of other pollutants associated with fossil-based electricity generation. Additionally, co-benefits will continue to be realized by allocating almost 100 percent of the CO2allowances to the EE&CET account to be auctioned by NYSERDA and have the resulting proceeds utilized for the account’s purposes of furthering the GHG emission reduction objectives of the Program.
Future environmental co-benefits will be much smaller than in the past simply because future reductions will be displacing natural gas rather than coal and oil. As shown above, NYSERDA’s investments are not cost-effective relative to the Social Cost of Carbon.
Drive new technology. By attaching tangible financial value to avoided carbon emissions, the proposed Program revisions provide additional market incentive for developing and deploying new technologies that can increase fuel efficiency, utilize non-carbon resources (including renewable technologies such as wind and solar power), and reduce or eliminate carbon emissions from combustion sources. In addition, to the extent that the auctioning of allowances will spur additional investments in clean energy technologies, the auctions drive the deployment of new technologies in the State.
I believe the cost of avoiding carbon emissions is far greater than the cost of RGGI on operations so this will have little effect on new technology.
Promote improved supply-side and demand-side efficiency. The proposed Program revisions create a direct incentive to reduce the fossil fuel inputs required to produce electricity through more efficient generating technologies. This is consistent with the Climate Act’s target to obtain 100 percent of the State’s electricity from carbon-free sources by 2040.
The NYSERDA investments in demand-side efficiency have provided tangible benefits. If DEC wants to claim supply-side efficiency gains then they should provide examples.
Improve the region’s energy security and reduce its exposure to higher energy prices. By creating a market incentive for low-carbon and non-carbon electricity technologies and by promoting increased supply-side and demand-side efficiency, the proposed Program revisions reduce the Northeast’s long-term exposure to high fossil fuel energy prices. Efficiency improvements and advances in new energy technology fostered by the proposed Program revisions can help buffer the region from the considerable economic risks associated with continued dependence on these fuels.
If New York truly wants to reduce exposure to higher energy prices then they should embrace natural gas development which has proven to be the leading cause in decreased prices. In spite of New York’s irrational war on natural gas fracking, that technology has been primarily responsible for the observed emission reductions and associated health benefits in the past decade.
Stimulate economic development. The proposed Program revisions provide a positive stimulus for economic growth in the region by creating incentives for new technologies that could be developed in-region, promoting a more efficient and cleaner electricity generating sector, prompting other activities through its offsets program and improving efficiency. NYSERDA’s investment of proceeds from the auctioning of allowances provides further economic benefits.
The broken window fallacy negates this claim. In the broken window fallacy – money spent on RGGI allowances, for example, is “money that cannot be spent on food, clothing, health care, or other industries. The stimulus felt in one sector of the economy comes at a direct – but hidden – cost to other sectors”.
Conclusion
I recently listened to the June 24 meeting of the New York Climate Action Council Policy in which New York’s climate leaders repeatedly expounded on the importance of science driving New York policy. However, as the implementation of this regulation shows, it is more about rhetoric than science. Science-driven policy should consider all possibilities, make a case for the preferred alternative, and not neglect inconvenient aspects of the proposal. In this instance the RIS claims over-whelming evidence and dismisses legitimate issues. I showed in the companion post that no case was made for the proposed revision to the regulation to include smaller sources. The most egregious problem is that New York has never quantified the potential effect of any of their GHG emission reduction regulations. The suggestion that changing New York’s contributions to global warming due to GHG emissions, even if you accept the consensus science, will have any measurable effect on the list of alleged problems is clearly not likely. At this time of unprecedented budgetary crisis, the RIS does not make a case to support these revisions and it is entirely appropriate to ask why this regulation is necessary.
[2] Esper, J., R.J.S. Wilson, D.C. Frank, A. Moberg, H. Wanner, & J. Luterbacher. 2005. “Climate: past ranges and future changes”. Quaternary Science Reviews 24: 2164-2166.
[1] This was the total for 2015 NYS emissions in NYSERDA Greenhouse Gas Inventory 1990-2015. Subsequent editions have lowered the most recent total so this is a conservative value for impacts.
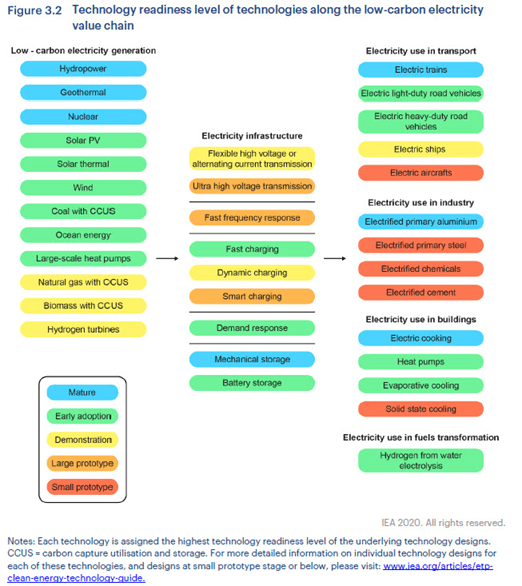
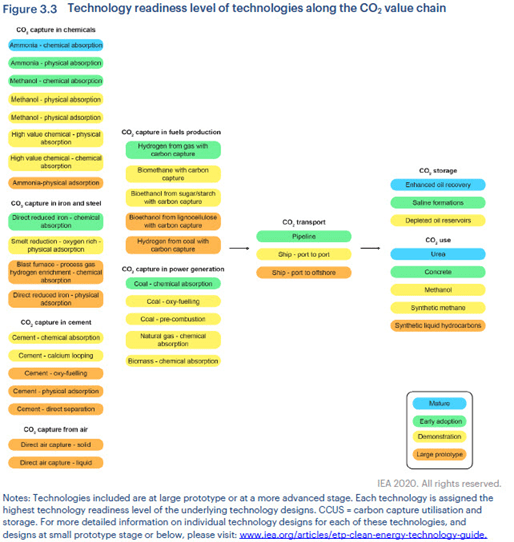


 Pragmatic Environmentalist of New York