In a recent article I noted instances where Governor Hochul and Public Service Commission Chair Rory Christian have raised the possibility for limited changes to the Climate Leadership & Community Protection Act (Climate Act) interim targets primarily because of affordability concerns. This is a real problem and I agree that it needs to be addressed. However, this article explains why I believe the total costs of the Climate Act are far higher than the Administration admits. I believe the total cost will exceed $1 trillion. It’s not that “we don’t know yet” – the Climate Act was built to avoid a real cost number.
I am convinced that implementation of the Climate Act net-zero mandates will do more harm than good if the future electric system relies only on wind, solar, and energy storage because of reliability and affordability risks. The opinions expressed in this article do not reflect the position of any of my previous employers or any other organization I have been associated with, these comments are mine alone. I acknowledge the use of Perplexity AI to generate a draft of this article.
Overview
The Climate Act established a New York “Net Zero” target (85% reduction in GHG emissions and 15% offset of emissions) by 2050. The Climate Action Council (CAC) was responsible for preparing the 2022 Scoping Plan that outlined how to “achieve the State’s bold clean energy and climate agenda.” In 2025, the State Energy Planning Board approved the 2025 Energy Plan that “provides broad program and policy development direction to guide energy-related decision making “. Neither document provided a complete, transparent accounting of the total costs to achieve the Climate Act mandates.
On February 26, 2026 the Hochul Administration “leaked” a New York Energy Research & Development Authority (NYSERDA) memo that said that “full compliance with New York’s 2019 Climate Leadership and Community Protection Act could cost upstate households more than $4,000 a year – on top of what they are already paying today”. A recent article by Emily Pontecorvo summarizes the Green Energy Blob take on affordability. Neither acknowledges the total costs of the Climate Act.
Total Costs
Supporters of the Climate Act often wave away cost questions with a shrug: “We don’t know yet,” “it’s complicated,” or the Scoping Act slogan that “the cost of inaction exceeds the cost of action.” That line would be more believable if the Hochul administration and its agencies were trying to calculate and document a true, all‑in cost.
They are not.
The core problem is not a temporary information gap while plans mature. The problem is that the statute, the implementation machinery, and the official analysis framework are all set up in ways that make a genuine, auditable total cost calculation impossible.
This is a design feature, not a bug.
My Total Cost Guess
Following this section, I will show how the total costs of the Climate Act have been buried. But first I will provide my estimate.
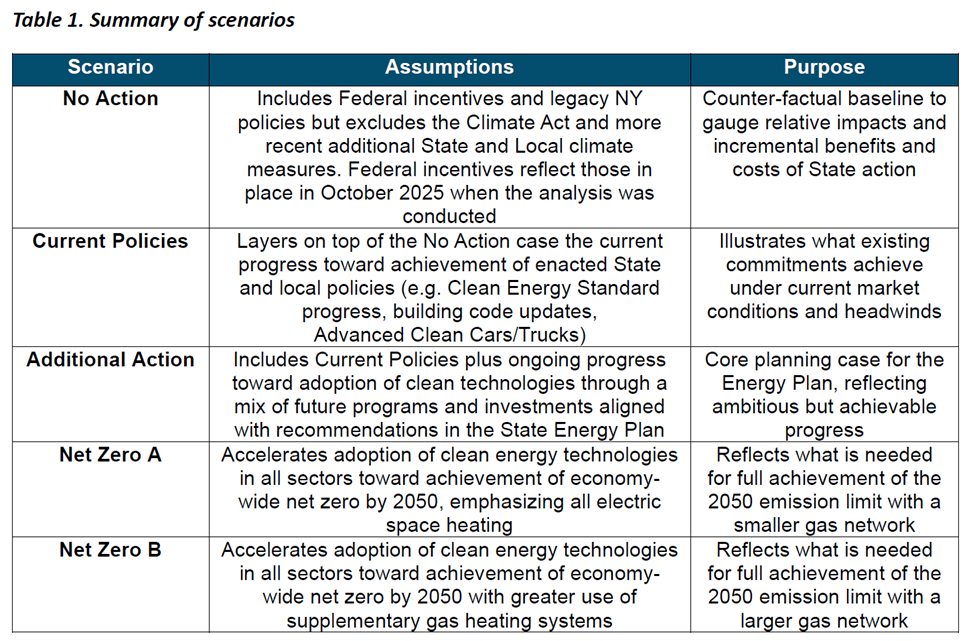
My analysis is exclusively based on State Energy Plan Volume II – Plan Analyses and Impacts Pathways Analysis information. There are five analysis scenarios described in Table 1 on page 3.
On page 62 the text notes that:
Regardless of the specific future pathway for New York’s energy system, continued investment to maintain and modernize existing infrastructure, replace aging equipment, and purchase fuels to meet energy needs will be necessary. The analysis found that the No Action scenario requires annual system-wide spending (including on supply- and demand-side fuel and equipment) of approximately $150 billion (in 2024$) every year through 2040. These funds support replacing end use equipment at end of useful life and constructing new and replacement natural gas generators to meet electricity needs, which are being transformed by new large loads and other needs.
The Hochul Administration has never admitted how much they think the Federal and legacy policies in the “No Action” scenario contribute to meeting the Climate Act mandates. We know the reference “Business as usual plus implemented policies” baseline scenario in Scoping Plan and Energy Plan modeling includes the following legacy programs:
- Growth in housing units, population, commercial square footage, and GDP
- Federal appliance standards
- Economic fuel switching
- New York State bioheat mandate
- Estimate of New Efficiency, New York Energy Efficiency achieved by funded programs: HCR+NYPA, DPS (IOUs), LIPA, NYSERDA CEF (assumes market transformation maintains level of efficiency and electrification post-2025)
- Funded building electrification (4% HP stock share by 2030)
- Corporate Average Fuel Economy (CAFE) standards
- Zero-emission vehicle mandate (8% LDV ZEV stock share by 2030)
- Clean Energy Standard (70×30), including technology carveouts: (6 GW of behind-the-meter solar by 2025, 3 GW of battery storage by 2030, 9 GW of offshore wind by 2035, 1.25 GW of Tier 4 renewables by 2030)
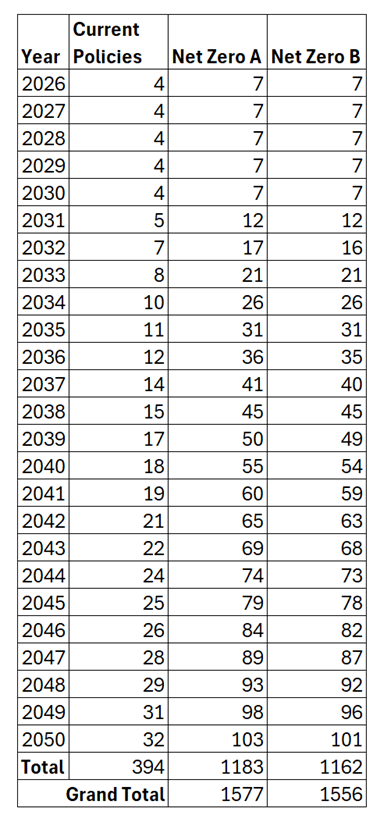
The Societal Costs of the Plan section in the Summary of Findings includes figures 55 and 56 that list the annual net costs and benefits by scenario in (Billion 2024$) for 2030 and 2040. I assumed the “current policies” scenario costs conservatively represent the legacy program costs necessary to achieve Climate Act mandates.
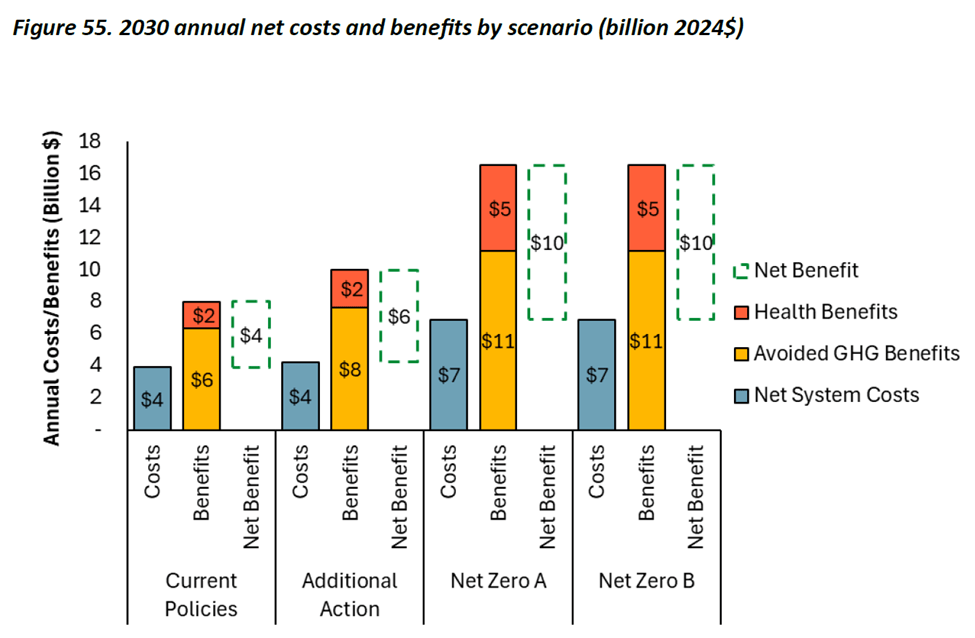
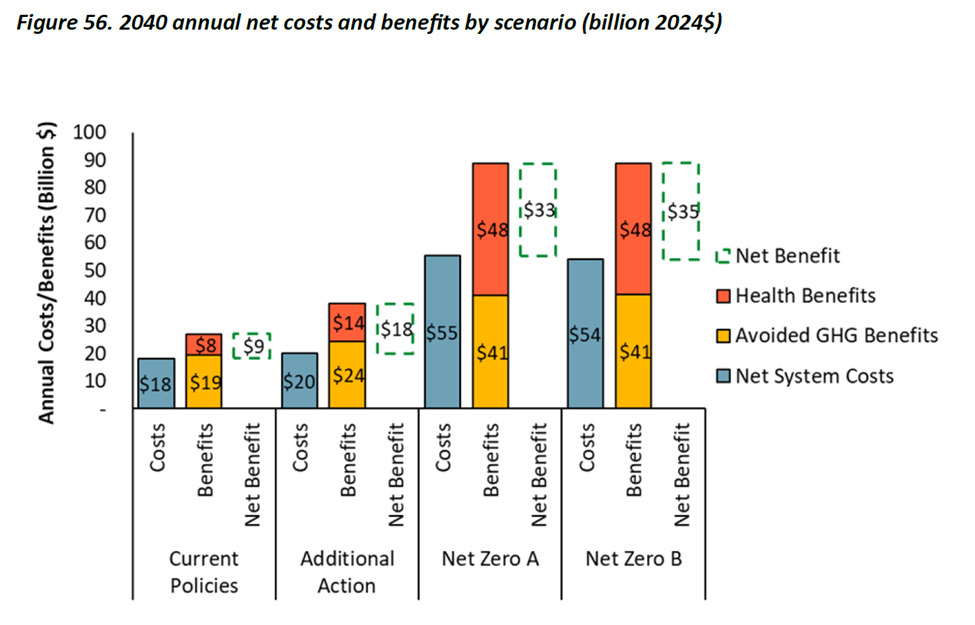
My Table 2 extracts the 2030 and 2040 costs from these figures. I used that range of years to calculate a rate of cost increase that I used to interpolate annual values from 2031 to 2039 and to extrapolate from 2041 to 2050. I assumed that the 2026 to 2029 annual costs were the same as 2030. I assume that the total Climate Act costs equal the current policy scenario (assumed to equal the legacy program costs) plus the Net Zero scenario costs. Summing the net zero scenarios and the “current policy” estimate of legacy program costs over all the years yields a total cost for the Climate Act of 1.58 trillion dollars for the Net Zero A scenario and 1.56 trillion dollars for the Net Zero B scenario.
Table 2: Annual Costs for Pathways Analysis Scenarios
This estimate of the total costs is flawed because it depends on the State Energy Plan modeling that only outlined a control strategy and suffers from other deficiencies as described below.
The Law Sets Targets Without Defining the Work or Its Price
The Climate Act hard‑codes numerical emission‑reduction percentages and deadlines but the Scoping Plan and the State Energy Plan never defined a complete technology pathway for how those goals must be met. That sounds flexible, but it means the actual portfolio of required measures is a just an outline list of potential strategies that their analysis claims will achieve the goals.
Because the plan do not specify which mix of generation, transmission, storage, building electrification, industrial changes, and behavioral mandates should be used, there is no fixed bill of materials to price out. Instead, agencies can continually swap in new mandates, subsidies, and bans, each with its own cost, while still claiming to be “implementing the Climate Act.”
On top of that, the statute’s cost language is soft. Agencies are told to “consider” costs and “minimize” them where practicable, but affordability is not an enforceable constraint in the same way the emission targets are. When goals are legally binding and costs are not, the structure guarantees that hitting the targets will always trump price transparency.
NYSERDA’s Own Memo Admits the Accounting Is Distorted
NYSERDA’s February 2026 memo, leaked finally admits what critics have said for years: the law’s own greenhouse gas accounting system drives up measured “emissions” and, therefore, required actions and costs. The memo acknowledges that:
- The Climate Act’s statutory accounting approach differs from internationally accepted methods and attributes more emissions to the same activities than “accepted science” would.
- Combined with inflexible near‑term targets, that accounting “would yield high costs to New York households and businesses” if carried through as written.
- In other words, the underlying metric that defines “success” is itself under active reconsideration because the costs have become politically explosive. When the rulebook that defines the problem is unstable, any attempt to calculate a final, all‑in cost is building on quicksand.
Popular accounts of the implications of this memo rarely acknowledge that the costs described are only for the economy-wide New York Cap-and-Invest (NYCI) program that only addresses fuel costs.
The Required Cost Evaluation Was Never Properly Documented
The statute requires the Climate Action Council to “evaluate … the total potential costs and potential economic and non‑economic benefits of the plan” and “make such evaluation publicly available” in the Scoping Plan. I showed that never happened in the Scoping Plan in a way that would satisfy any utility commission rate case, let alone a serious public works program.
The Scoping Plan’s integration analysis offers high‑level bar charts and net‑cost ranges, but the underlying calculations are undocumented. There is no public bill of quantities tying specific measures to specific costs and no auditable backup that would allow an outsider to reproduce the results. When costs are summarized in a single bar labeled “net direct cost” with no line‑item breakdown, the intent is concealment, not clarity.
Worse, the benefits side was constructed with a major error: avoided greenhouse gas benefits were counted multiple times, which flipped the analysis from large net costs to large net benefits. Correcting that one mistake alone turns the claimed 90–120 billion dollars in net benefits into tens of billions in net costs. If the “cost of inaction” narrative depends on that kind of numerical sleight of hand, it is not a serious basis for budgeting trillions.
The PSC Admits It Cannot Isolate “Climate Act Costs”
The Scoping Plan is a black box. I hoped that the Department of Public Service (DPS) could have cleared things up in its Climate Act Informational Reports. Those reports were specifically ordered to track what ratepayers are being billed to support Climate Act programs.
However, buried in the Second Informational Report is a remarkable confession: DPS staff state that, “in several instances, [it is] difficult to clearly delineate program costs and outcomes directly related to the Climate Act as there are decades of overlapping programs.” In plain English: the Commission cannot cleanly separate “Climate Act costs” from everything else.
The reports:
- Focus on “direct effects” of Climate Act implementation only, leaving out large categories of indirect or prerequisite spending.
- Explicitly warn that many costs were authorized before the law and will be recovered over many years, so the totals in the tables “should not be considered as entirely incremental costs.”
Even so, outside analysts looking at the first report have tallied roughly 43.7 billion dollars in Climate Act‑related spending or commitments through 2022, without a detailed public accounting of where the money went or what benefits were achieved. If the state’s chief utility regulator cannot even define the denominator—what counts as Climate Act spending—then the idea of a precise, final total cost is a fiction.
The “No‑Action” Baseline Ensures Systematic Understatement
NYSERDA and the Climate Action Council rely on a “no‑action” baseline that conveniently excludes large pre‑existing clean‑energy and efficiency programs that are in fact necessary to hit the Climate Act targets. This lets them present Climate Act costs as smaller “incremental” add‑ons, rather than part of a cumulative, decades‑long policy stack that ratepayers are actually funding.
As NYSERDA itself now concedes, using this kind of baseline means their cost analyses systematically understate what full Climate Act compliance will really cost New Yorkers. The baseline is rigged, so every dollar number derived from it is misleading by design.
Household Numbers Are All Over the Map for a Reason
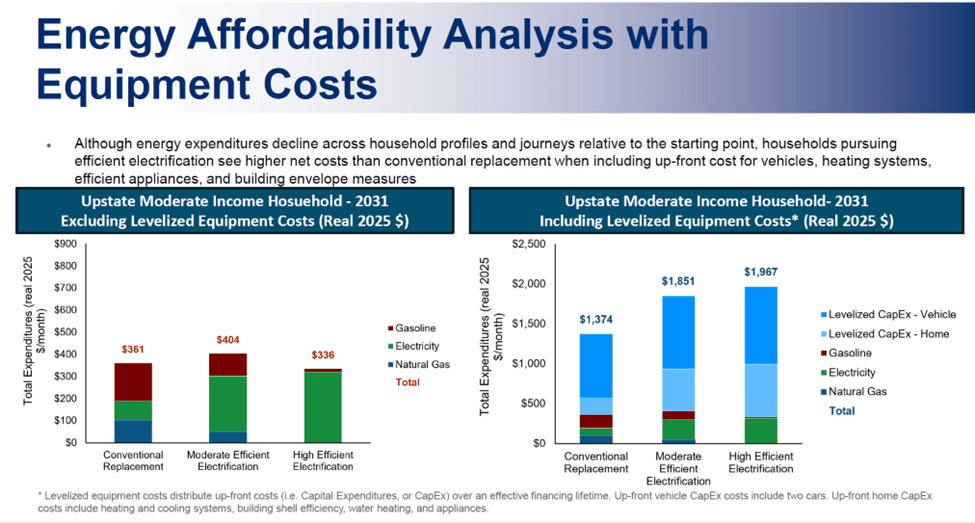
The recent NYSERDA memo and accompanying press coverage acknowledge that compliance with the current law could raise costs for an average household by roughly 3,000 to 3,500 dollars per year, with higher impacts for upstate gas and oil customers. I have shown that using the state’s own State Energy Plan data shows much larger figures when:
- The full cost difference between conventional replacements and “high‑efficiency” electrification equipment is included.
- Cap‑and‑invest allowance costs and other Climate Act‑driven charges are added in.
My analysis points to an annual cost burden for an upstate gas household on the order of 7,200 to 11,200 dollars once all Climate Act‑related requirements are counted. When official and independent estimates diverge by factors of two or three, the issue is not “we need more time to refine the model.” These numbers are included in the State Energy Plan Pathways Analysis costs described earlier. The issue is that the state’s chosen framework is not designed to expose the full number.
The “Total Cost” Cannot Be Calculated
Put these strands together and a pattern emerges:
- The statute hard‑codes targets but not a concrete implementation package, so the scope of work keeps changing.
- The greenhouse gas accounting system is non‑standard and now acknowledged by NYSERDA to inflate apparent emissions, which in turn inflates required actions and costs.
- The Scoping Plan’s integration analysis does not provide documented, reproducible cost calculations, and even its benefit estimates are numerically flawed.
- The PSC’s own reports admit that Climate Act costs cannot be cleanly separated from decades of overlapping programs, and that their tabulations are only partial.
- NYSERDA relies on a “no‑action” baseline that excludes necessary existing programs, systematically understating the real burden.
- Household‑level cost estimates swing wildly depending on whether you accept the state’s narrow accounting or incorporate the full suite of required measures and charges.
This is not an innocent case of “we don’t know yet because it’s early” or “we need better models.” It is a structural outcome of how the Climate Act is written, how agencies have chosen to interpret it, and how the analysis has been framed.
Conclusion
It is not unreasonable to think that the total cost for Climate Act compliance will exceed $1 trillion between now and 2050. If my estimate is wrong, then it is incumbent upon the State to provide the correct value. However, the law’s architecture, the accounting choices, and the reporting practices all point in the same direction: avoid ever putting a defensible, fully documented total cost number in front of voters. Until those foundations are rebuilt—starting with honest accounting, a realistic implementation plan, and full documentation of methods—New Yorkers will not get the basic information they were promised: what this experiment will cost, and who is going to pay.