I recently had the opportunity to give a briefing on solar siting issues and think it is time to publish an update here. In my opinion, the deployment of solar resources exemplifies poor planning inherent in the Climate Leadership & Community Protection Act (Climate Act) net-zero transition plan.
I am convinced that implementation of the Climate Act net-zero mandates will do more harm than good because of reliability and affordability risks. I have followed the Climate Act since it was first proposed, submitted comments on the Climate Act implementation plan, and have written over 500 articles about New York’s net-zero transition. The opinions expressed in this article do not reflect the position of any of my previous employers or any other organization I have been associated with, these comments are mine alone.
Overview
The Climate Act established a New York “Net Zero” target (85% reduction in GHG emissions and 15% offset of emissions) by 2050. The Climate Action Council (CAC) was responsible for preparing the Scoping Plan that outlined how to “achieve the State’s bold clean energy and climate agenda.” After a year-long review, the Scoping Plan was finalized at the end of 2022. Since then, the State has been trying to implement the Scoping Plan recommendations through regulations, proceedings, and legislation.
Solar Mandates
Public Service Law Section 66-p requires the Public Service Commission (PSC) to establish a renewable energy program. Subsection 66-p(2) requires the PSC to establish a program to require that 70% of the
statewide electric generation shall be generated by renewable energy systems; and that by 2040 the statewide electrical demand system will be zero emissions. This basically codifies the Scoping Plan outline for a decarbonized electric system.
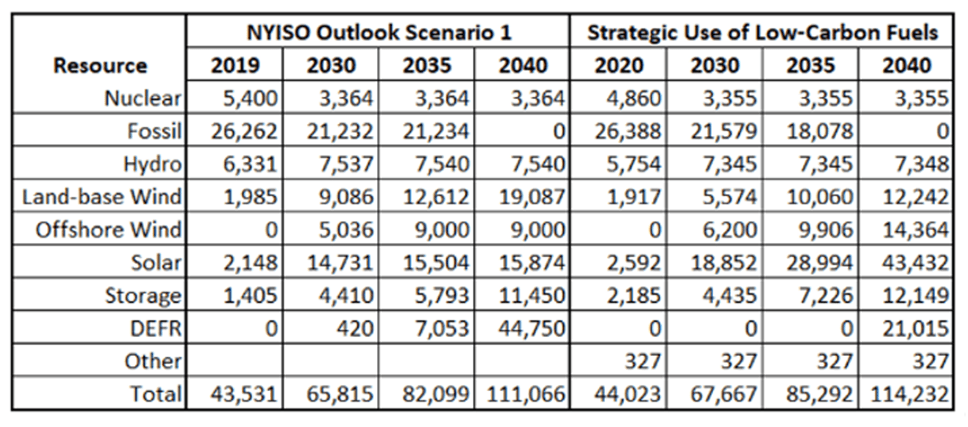
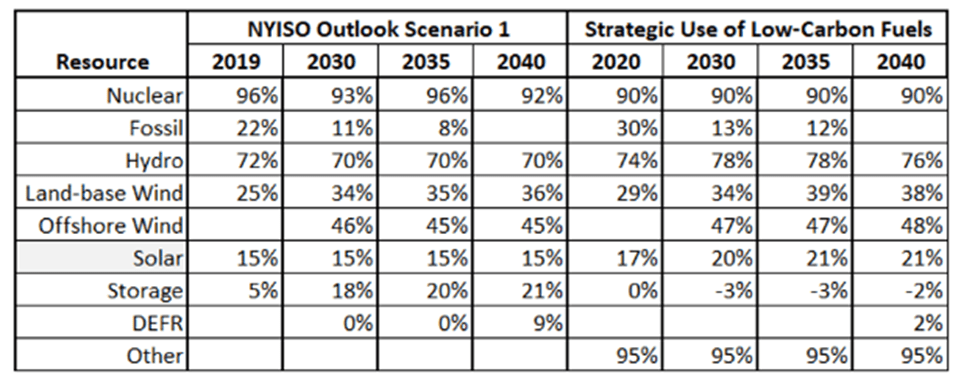
Both the Scoping Plan Key Drivers Output spreadsheet and the New York Independent System Operator (NYISO) 2021-2040 System & Resource Outlook project a massive increase in New York solar capacity (Table 1). Note that the solar generating capacity increases to over 20% of total capacity by 2030 for both scenarios.
Table 1: Installed Capacity (MW) NYISO Outlook Scenario 1 and Integration Analysis Mitigation Scenario 2 – Strategic Use of Low-Carbon Fuels
I have a solar siting issues page that documents my concerns. In my briefing I highlighted three issues with the solar siting policy in New York since the inception of the Climate Act: protection of prime farmland, agrivoltaics policy, and inconsistency with the Scoping Plan,. The farmland and agrivoltaics issues are addressed by Specialist Committees in the New York State’s Agricultural Technical Working Group. At their last meeting in November 2024 there were updates for the Regional Agronomic Impacts of Solar Energy (RAISE) Specialist Committee, the Agrivoltaics Specialist Committee, and the Scorecard Specialist Committee that will be discussed below.
Farmland Protection
The New York Department of Agriculture and Markets has guidelines for solar siting. New York Department of Agriculture and Markets testimony notes that “The Department’s goal is for projects to limit the conversion of agricultural areas within the Project Areas, to no more than 10% of soils classified by the Department’s NYS Agricultural Land Classification mineral soil groups 1-4, generally Prime Farmland soils, which represent the State’s most productive farmland.” That seems reasonable to me because they are the Agency responsible for supporting New York agriculture.
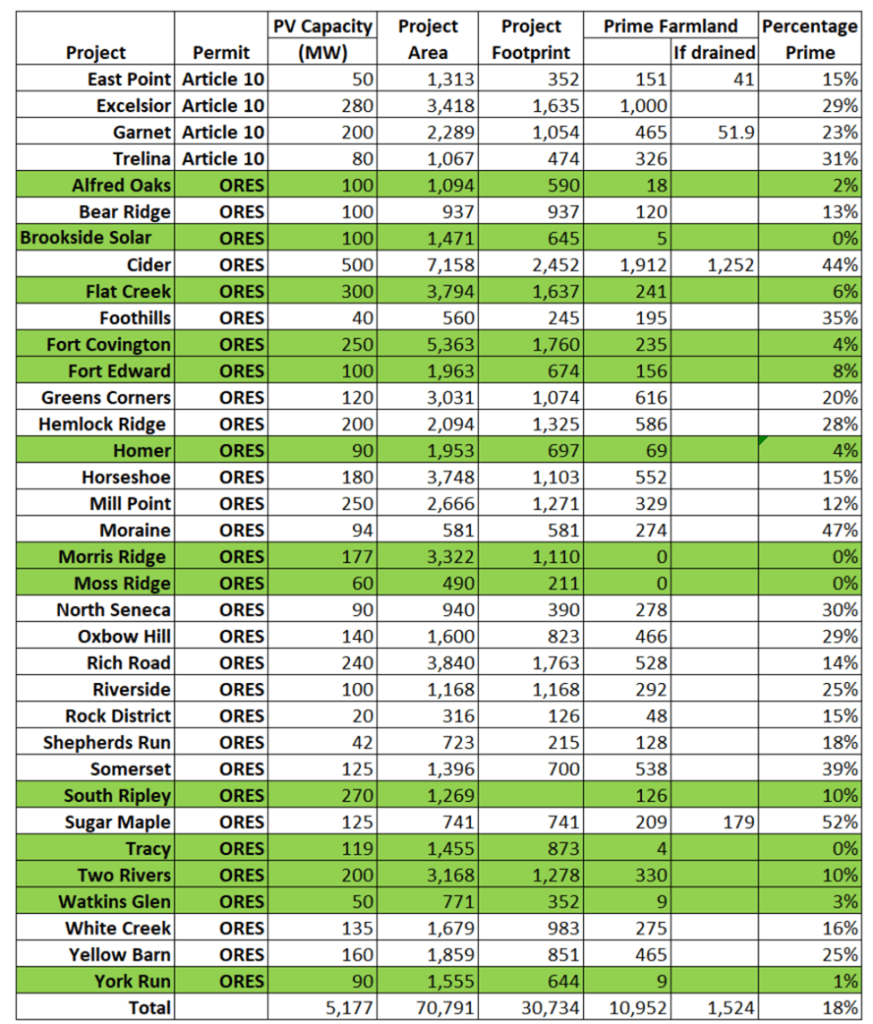
I keep track of the status of projects with this guideline with a Prime Farmland Scorecard. At this time only 12 of the 25 facilities with available data at the Office of Renewable Energy Permit Applications site meet those guidelines. Two facilities had no impacts on prime farmland. If they can do it, why can’t others.
Table 2: Prime Farmland Scorecard Updated May 25, 2025
It is extremely frustrating to me that the Department of Ag and Markets recommendation was not adopted as a matter of course for solar development permitting. Instead, the New York State Energy Research & Development Authority (NYSERDA) is studying the issue. The Smart Siting Scorecard considers this siting concern:
NYSERDA has developed the Smart Solar Siting Scorecard to 1) provide a tool to address multiple solar siting considerations and site management practices from the perspective of environmental, agricultural, and climate interests and 2) to provide criteria for renewable energy developers to consider in siting future projects, and include within project design, operations and maintenance, and decommissioning plans to encourage a balanced approach between renewable energy siting and other New York State policies, goals, and objectives. The Scorecard Specialist Committee provides input to NYSERDA on what avoidance and minimization approach to reduce impacts on these lands and how to value these approaches in a Scorecard format.
I do not see any sign of urgency to finalize and implement farmland protections using the scorecard. The Smart Siting Scorecard Specialist Committee has had three meetings this year:
- January 11, 2025 – Agenda 1/16/25 [PDF] | Presentation 1/16/25 [PDF]
- January 22, 2025 (Forestry Stakeholders) – Agenda 1/22/25 [PDF] | Presentation 1/22/25 [PDF]
- February 13, 2025 – Agenda 2/13/25 [PDF] | Presentation 2/13/25 [PDF]
Worse it does not appear that a solar development can get a failing grade for not doing smart siting. In my opinion, this is lip service to the issue.
Agrivoltaics Policy
In my opinion, responsible solar siting policy would include agrivoltaics requirements that would mitigate impacts to agriculture. NYSERDA is in charge of agrivoltaics policy:
Agrivoltaics is a new and emerging combination of technologies that enhance climate resilience and allow sustainable food and energy production. From crop production to livestock grazing and pollinator habitat, agrivoltaics can support a wide range of agriculture practices.
This rapidly growing sector of the solar energy industry is undergoing considerable research, development, and demonstration in the United States and across the globe.
For the latest information and guidance, read the Growing Agrivoltaics in New York State report [PDF].
The New York State’s Agricultural Technical Working Group’s (A-TWG) Agrivoltaics Specialist Committee manages the agrivoltaics policy. Based on the update at the A-TWG meeting last November, they have meetings and train farmers. NYSERDA is supporting their efforts with the Agrivoltaics Research and Demonstration Request for Proposal (PON 5752). The deadline to submit proposals was Sept 12th and contracts were supposed to be awarded in the first quarter of 2025. Nothing has been funded yet.
There is another agrivoltaics study: Regional Agronomic Impacts of Solar Energy (RAISE):
In 2022, the State Farmland Protection Working Group recommended the State initiate a study, to determine the potential benefits and/or burdens of renewable energy development related to New York’s agricultural industry. NYSERDA has convened a Specialist Committee under the A-TWG to assist NYSERDA to undertake a study or studies to assess the impact of solar development on the agricultural economy in the state. The study will inform State and regional policy, and will include an assessment of land use conversions, economic pressures, and other factors. The RAISE Specialist Committee shall:
- Advise on developing scope(s) of work and associated study methodologies.
- Identify information, data, and resources helpful to undertaking associated agricultural, economic, land use and other analyses.
- Make recommendations on undertaking additional studies or actions.
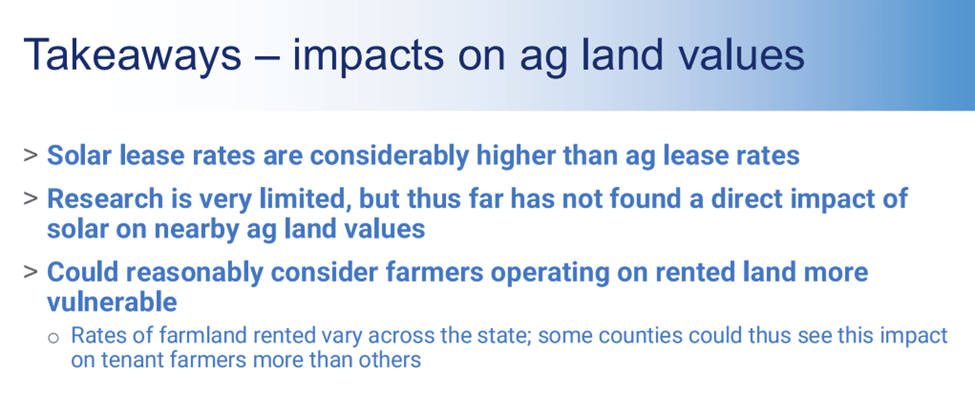
I have found that NYSERDA sponsored research related to the Climate Act is designed to further the narrative that the transition is simple, cheap, and has inconsequential negative impacts. The RAISE presentation at the last A-TWG meeting described takeaways for the impacts of solar development on agricultural land values illustrates this on the following slide. If solar lease rates are higher than agriculture lease rates, then it is obvious that landowners will preferentially lease to the solar developers making it more difficult for farmers who need to lease land to operate. Note the weasel words – “limited research”, no “direct impact”, and could be “more vulnerable” in the description that try to avoid concluding the obvious. The longer this report takes to be released the longer these negative impacts will persist and the more the developers can continue to negatively impact agriculture.
Scoping Plan Inconsistency
The capacity factor is a measure of how much energy can be provided by a generating facility in a year. It is simply the amount of energy produced (MWh) divided by the capacity (MW) times the number of hours in the year. Table 3 lists the capacity factors for the resources listed in Table 1. In my opinion, the Scoping Plan solar capacity factors are biased high. I believe the only way these factors can be achieved is if the installed solar facilities use tilting axis solar panels.
Table 3: Capacity Factors (%) NYISO Outlook Study S-1 and Scoping Plan Scenario 2
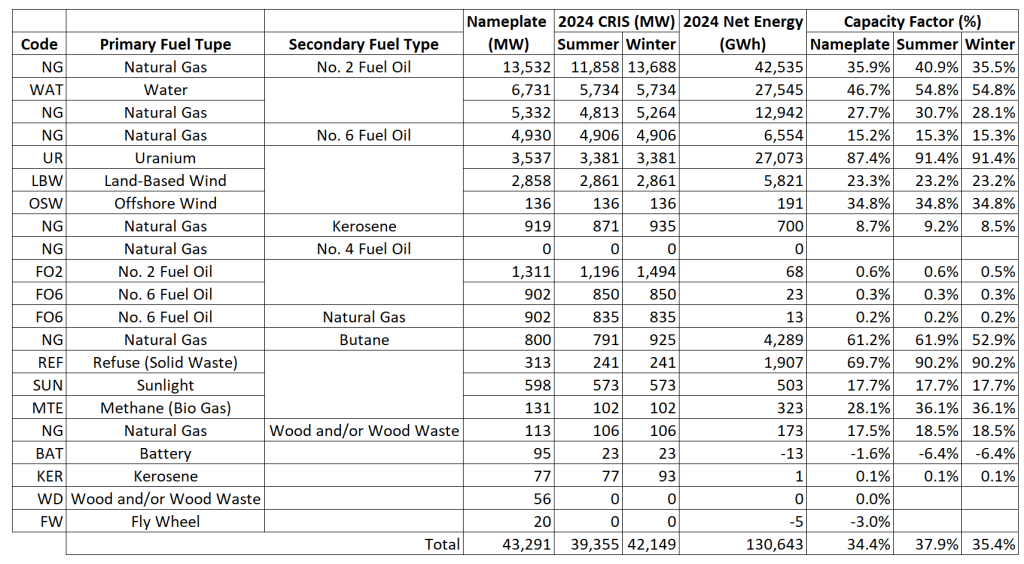
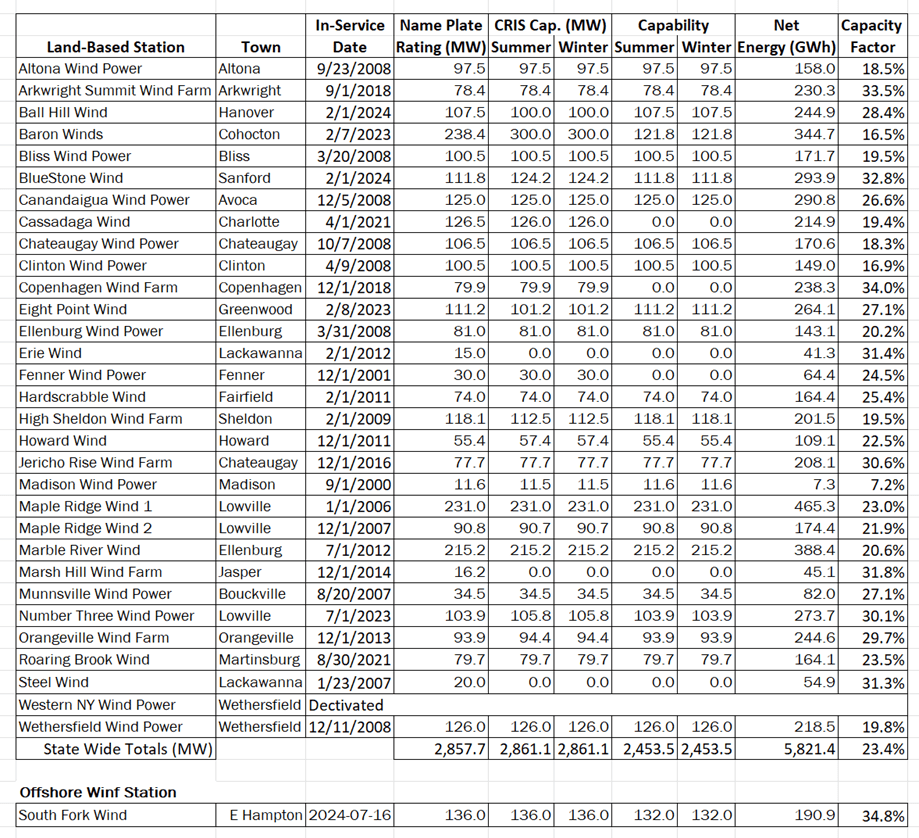
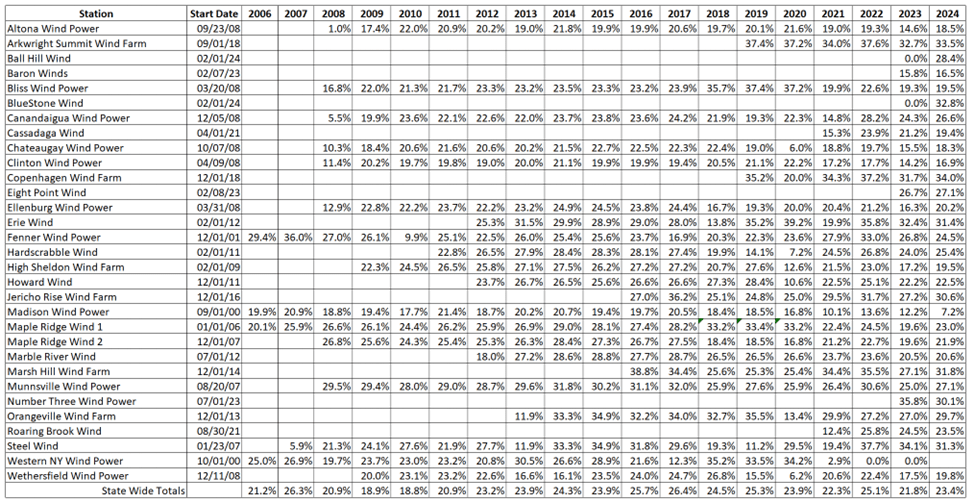
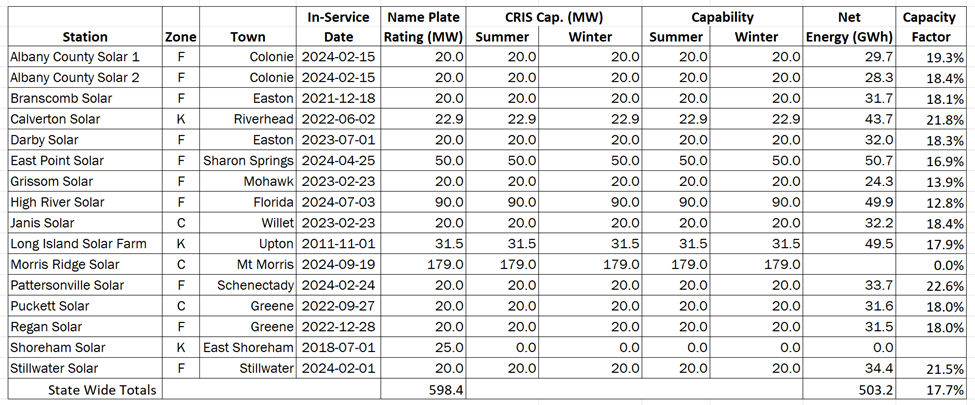
I recently reported on the observed capacity factors of solar facilities. Table 4 lists individual station factors.
Table 4: New York State Utility-Scale Solar Facility Capacity Factors Based on NYISO “Gold Book” Load & Capacity Data Reports Table III-1
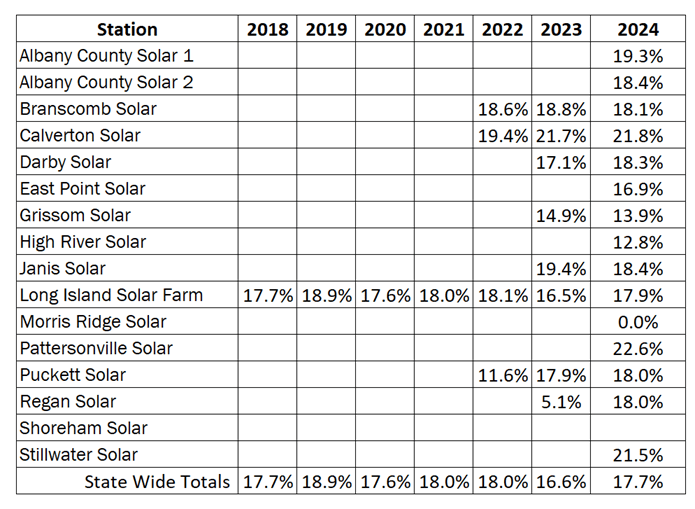
Assuming a linear interpolation between the Scoping Plan Strategic Use of Low Carbon Fuels 2020 capacity factor of 17% and the 2023 factor of 20%, the expected capacity factor was 18.2%. The observed capacity factors are lower than the Scoping Plan projection and I believe that is likely because NYSERDA does not require solar developers to install tilting axis solar panels to obtain subsidies from the State.
Discussion
The Scoping Plan is just an outline of emission reduction strategies that NYSERDA claims will achieve the goals of the Climate Act. There never has been a feasibility analysis that proves that the Public Service Law Section 66-p requirement to establish a renewable energy program can work and there are no jurisdictions anywhere that have successfully developed an electric system that relies primarily on wind, solar, and energy storage. As far as I can tell, the Hochul Administration plan is to build as much wind and solar as possible, as fast as possible. That approach meant that there was no provision to develop responsible solar siting guidelines.
The failure to plan has had negative consequences. The decision to not require developers to meet the Department of Ag & Markets prime farmland protection guideline has led to the destruction of 6,650 acres of prime farmland. The lack of an agrivoltaic policy means that very few developers are trying to mitigate the impact of solar panels. The failure to require utility-scale solar facilities to use tilting-axis solar panels means that even more land will be covered in solar panels.
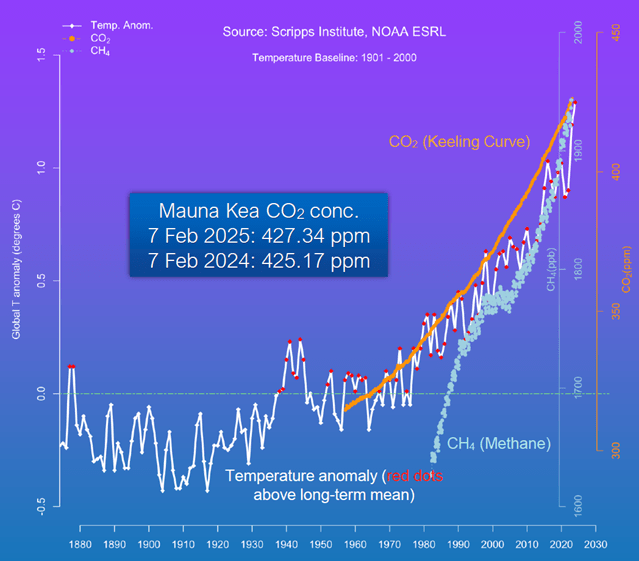
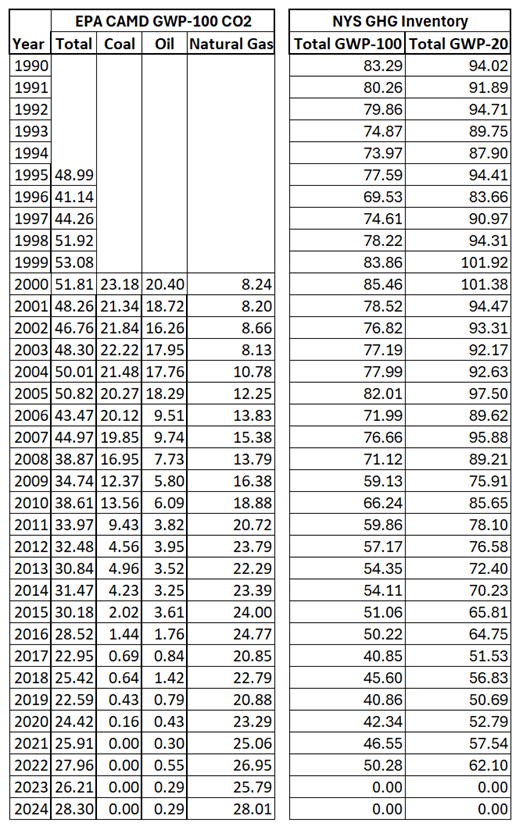
This was all preventable. The claim that these programs had to be implemented as fast as possible because of the existential threat of climate change is no excuse. If New York were able to eliminate all its GHG emissions, the effect of global emission increases elsewhere would supplant our efforts in one year. New York GHG emissions are less than one half of one percent of global emissions and global emissions have been increasing on average by more than one half of one percent per year since 1990.
Conclusion
NYSERDA has lost its way as a source of unbiased scientific information to guide energy policy in New York. Their Climate Act responsibilities are opaque, their work products are biased to support the political narrative, there is no sense of urgency to address obvious deficiencies in current policy, and they do not respond to stakeholder concerns. This has significant negative consequences for New York.
I cannot help but think that there is another reason for the development policy to build as much as possible as fast as possible. The developers of these facilities push that narrative because they know that limits on using prime farmland and mandates to use tilting-axis solar panels will hurt their profitability. It is all about the money.