The Climate Leadership and Community Protection Act (Climate Act) has a legal mandate for New York State greenhouse gas emissions to meet the ambitious net-zero goal by 2050. The comment period for the Draft Scoping Plan is open until June 10, 2022. The Council requested feedback on the components of three mitigation scenarios. My overview summary of the components described the scenarios and I previously described the building sector scenarios. This post discusses the control measures in the transportation sector and supplements an earlier article addressing transportation costs.
Everyone wants to do right by the environment to the extent that they can afford to and not be unduly burdened by the effects of environmental policies. I have written extensively on implementation of New York’s response to that risk because I believe the ambitions for a zero-emissions economy embodied in the Climate Act outstrip available renewable technology such that it will adversely affect reliability, impact affordability, risk safety, affect lifestyles, and will have worse impacts on the environment than the purported effects of climate change in New York. New York’s Greenhouse Gas (GHG) emissions are less than one half one percent of global emissions and since 1990 global GHG emissions have increased by more than one half a percent per year. Moreover, the reductions cannot measurably affect global warming when implemented. The opinions expressed in this post do not reflect the position of any of my previous employers or any other company I have been associated with, these comments are mine alone.
Climate Act Background
The Climate Act establishes a “Net Zero” target (85% reduction and 15% offset of emissions) by 2050. The Climate Action Council is responsible for preparing the Scoping Plan that will “achieve the State’s bold clean energy and climate agenda”. They were assisted by Advisory Panels who developed and presented strategies to the meet the goals to the Council. Those strategies were used to develop the integration analysis prepared by the New York State Energy Research and Development Authority (NYSERDA) and its consultants that quantified the impact of the strategies. That analysis was used to develop the Draft Scoping Plan that was released for public comment on December 30, 2021. Comments on the draft can be submitted until July 1, 2022.
Integration Analysis Reference Case and Scenarios
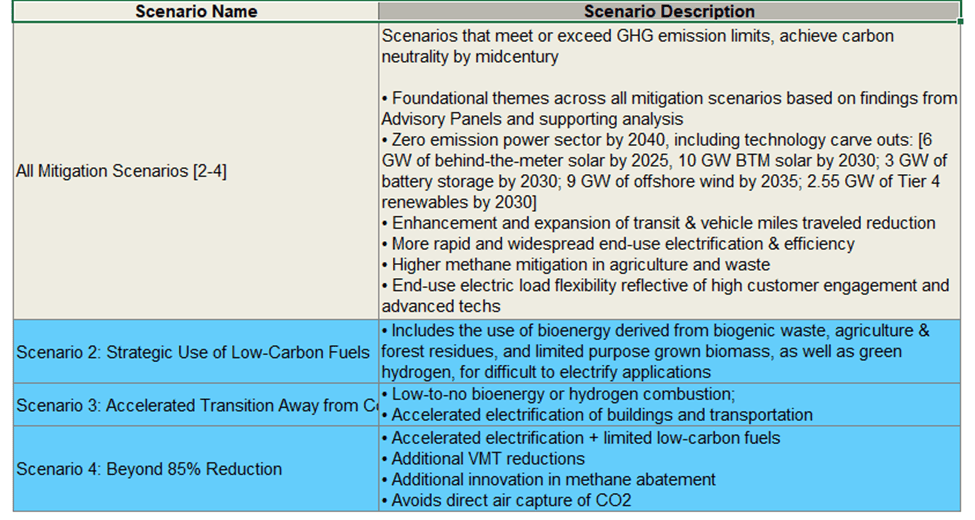
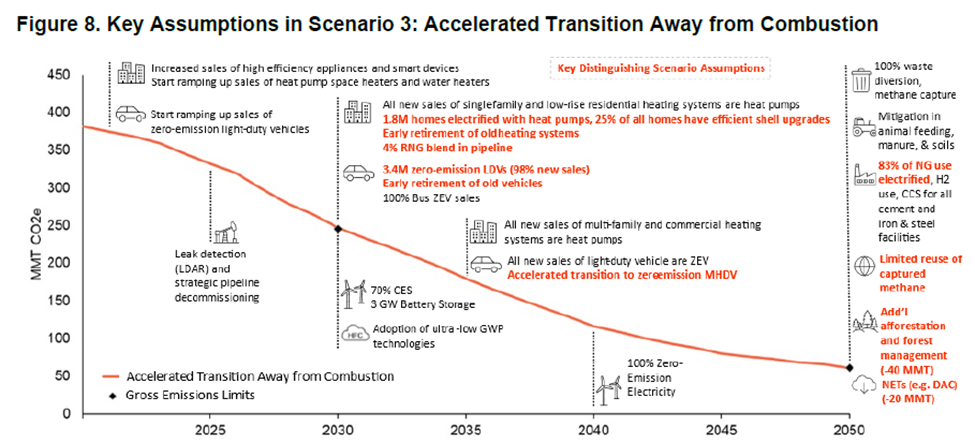
Appendix G: Integration Analysis Technical Supplement of the Draft Scoping Plan was prepared by Energy and Environmental Economics (E3) and Abt Associates in December 2021. I refer you to my building sector scenario post for more details. The Integration Analysis initially “evaluated a future that represents business-as-usual inclusive of implemented policies (Reference Case) and a representation of a future based on the recommendations from the Council’s Advisory Panels (Scenario 1)”. Subsequently, the consultants developed three mitigation scenarios that were “designed to meet or exceed GHG limits and achieve carbon neutrality”. The three mitigation scenarios are described in Section I on page 14. This article describes the transportation sector actions.
Table 16. Level of Transformation by Scenario: Transportation from Appendix G Section I page 118 lists the transformation strategies for the transportation sector. It would take an extraordinary amount of work to debunk these wishful thinking strategies that may sound good for the Draft Scoping Plan but will not necessarily work in the real world. I will give just one example: rail transportation.
I previously addressed one particular aspect of transportation sector costs: the transportation sector vehicle miles traveled difference between Scenarios 2 and 3 relative to Scenario 4. The Draft Scoping Plan claims that “Incremental reductions from enhanced in-state rail aligning with 125 MPH alternative detailed in Empire Corridor Tier 1 Draft EIS” will provide a reduction of 200 million light duty vehicle miles at a per unit cost of $6 per mile or $1.2 billion. I estimate that the only valid cost for the difference between the rail alternatives is $8.4 billion and that it would only provide a reduction of 64.7 million miles. While my estimate is for 2035, consistent with the Empire Corridor evaluation, and the Draft Scoping Plan is for 2050, I don’t think there is any question that the numbers are inconsistent.
Within the non-road transportation category in Table 16, the rail component for all three scenarios states “90% electrification, 10% hydrogen use in 2050”. There is no detail of how those categories are broken out. According to Appendix G, Scenario 4 would get additional vehicle miles traveled reductions by using the “125 MPH alternative detailed in Empire Corridor Tier 1 Draft EIS”. That alternative calls for an electrified passenger rail line from New York to Buffalo, including a completely new line between Albany and Buffalo. I cannot say if the plan is to add catenary to electrify the railroads or use battery-electric locomotives. Hydrogen (via electrolysis) is listed under the low-carbon fuels category and is supposed to be used for medium and heavy-duty vehicles and freight rail. Because freight transportation energy use exceeds passenger energy use, I assume that freight locomotives will be a mix of hydrogen and electric power.
There are two issues. The Appendix G Scenario 2 transportation investment category is only $3 billion more than the Reference Case, $15 billion for Scenario 3 and $40 billion for Scenario 4. In the absence of documentation, I can only guess that the different railroad transportation strategies in Scenario 4 reflect the added costs. Secondly, my interpretation of this strategy is that the Draft Scoping Plan expects that within New York State, railroad locomotives will have state-specific limitations. The problem is that the major railroads operate their locomotives over much greater distances than New York State. A train carrying containers from the West Coast might change locomotives once or twice but certainly runs through from the Midwest. Is the Scoping Plan expectation that there will be a change of locomotives at the state line? Theory may be fine but the practical implementation introduces a whole host of logistical issues and hidden costs.
Electric Vehicles
The Annex 2: Key Drivers and Outputs Spreadsheet, Tab: Scenario Definitions table lists specific programs in the Reference Case. Table 1 extracts assumption data from that spreadsheet so that the Reference Case and mitigation scenarios can be compared.
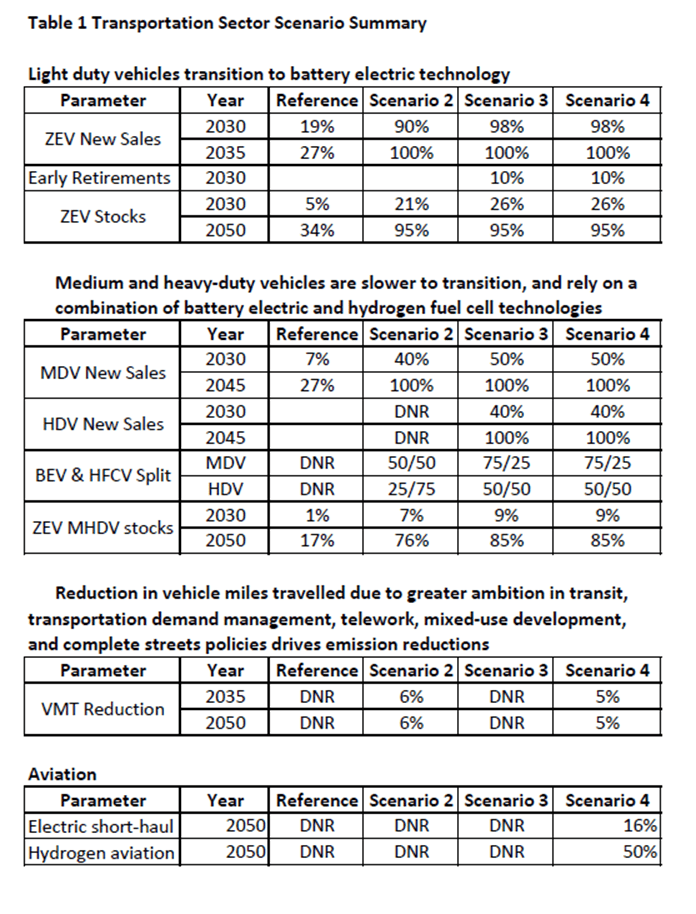
Consider the light duty vehicle strategies. For all motor vehicle registrations in New York in May 2022 there are only 62,123 electric vehicles statewide. The Integration Analysis projects that there will be 138,156 light-duty electric vehicles in 2025 in the Reference case. Scenario 2 projects 257,718 LDEV in 2025 and both Scenarios 3 and 4 project 275,417. In order to reach those levels, there will have to be a significant increase in electric vehicle sales.
My concern is that this increase in EV sales is based on no documented references. As Christian Twiste writes the current reality is very much different:
The average electric vehicle cost $65,977 as of March, compared to an average price of $45,927 across the entire industry, and a much lower price of $26,052 for a compact car, meaning going electric will cost a frugal family over 250% more than opting for a small car mainstay like a Toyota Corolla or Honda Civic. Even if you have the funds and are willing to spend them, Politico reported last weekend that most models are sold out until next year. Ford and Volkswagen both anticipate no new vehicles being available until 2023. Tesla’s least expensive model won’t be available until December, and Rivian, a new entry in the market, was forced to cut production in half this year due to supply chain issues.
The unprecedented buildout proposed in these Draft Scoping Plan scenarios has to be documented to be considered viable.
EV Charging
The LDV charger cost comparison table extracts data from the IA-Tech-Supplement-Annex-2-Key-Drivers-Outputs spreadsheet related to charger systems. The Electric Vehicle Supply Equipment: Per-Vehicle Costs section at the top of the table lists cost directly from the Integration Analysis spreadsheet. In a previous article I found a reference bus charging infrastructure. The Center for Transportation and the Environment (CTE) Charging Infrastructure webinar listed costs between $5,000 and $7,000 for an AC level 2 charger and between $50,000 and $70,000 for a DC level 3 charger. There is an obvious disconnect between those numbers and the $24,000 value for 2020 in this table. More disturbing are the cost projections over time. The Integration Analysis projects a cost decrease of 18% for light duty vehicle battery chargers between 2020 and 2030, a 41% decrease between 2020 and 2040, and a 61% decrease between 2020 and 2050. The first ten years the price decreases by 18%, the second ten years the price decreases another 27% and the last ten years the price decreases another 34%. Sorry I am not buying this incredibly optimistic assessment of future cost reductions without documentation. The fact that the battery charging cost reductions are identical to the hydrogen fuel cell cost reductions suggests that some analyst simply made an assumption.
The total costs of course reflect these optimistic charger costs. Assuming that every new car needs a new charger, I multiplied the number of new battery electric light duty vehicles by the charger cost. Relative to the Reference Case the projected costs of battery electric light duty vehicles is projected to be $15 billion for Scenario 2 and $18.5 billion for Scenarios 3 and 4. Note that if the cost for chargers stays the same then the the projected cost is $37 billion for Scenario 2 and $42 billion for Scenarios 3 and 4. There is an associated issue that I could not address due to the poor documentation. The expected lifespan of an electric vehicle charging system is ten years. I don’t know if the final costs in the Draft Scoping Plan incorporate the lifespan adjustment that is going to increase costs markedly. That adjustment means that the real charger cost has to account for all the cars in the New York fleet. The final Scoping Plan should clarify whether those costs were included.
Light-Duty Vehicle Costs
The LDV Zero-Emission Vehicle Costs table extracts data from the IA-Tech-Supplement-Annex-2-Key-Drivers-Outputs spreadsheet related to the costs of light-duty vehicles themselves. The Transportation – Vehicle Cost by Technology: Reference Trajectory section at the top of the table lists cost directly from the Integration Analysis spreadsheet. Note the cost of zero-emissions battery electric $43,794 and hydrogen fuel cell vehicles $58,392. The following table from Inside EVs lists the costs of battery electric vehicles on September 18 2022. There are 63 car models listed and there are only 13 models less than the Integration Analysis estimate.

Similar to the car charging the cost projections over time are disturbing. The Integration Analysis projects a cost decrease of 35% for light duty battery electric vehicles between 2020 and 2030, a 42% decrease between 2020 and 2040, and a 44% decrease between 2020 and 2050. The first ten years the price decreases by 18%, the second ten years the price decreases another 11% and the last ten years the price decreases another 3.4%. Sorry I am not buying this optimistic assessment of future cost reductions without documentation.
I also calculated the total costs for vehicles over the period 2020 to 2050 in the LDV Zero-Emission Vehicle Costs table. The total cost for new vehicles in the Reference Case is $619.6 billion. Scenario 2, Strategic Use of Low-Carbon Fuels, total costs are $575.6 billion so the Draft Scoping Plan claims that converting to zero-emission vehicles will cost less than the Reference Case by $44 billion. The assumptions for Scenarios 3 and 4 must be identical because they both have a total cost of $581.8 billion for a difference of $37.8 billion. The massive cost reductions projected for zero-emissions vehicles is most of the reason that converting to zero-emissions is cheaper. Note that the apparent difference between the scenarios is the use of hydrogen fuel cell vehicles in Scenario 2.
Conclusion
In order to provide meaningful comments, the documentation has to be improved. In the first place, I recommend that all control measures should be listed, with the assumptions, costs and expected emission reductions provided. That information could clarify the questions about the differences between scenarios for the railroad projections. Without it I can only note that the projections seem inconsistent with the primary source mentioned.
Both the charger cost and zero-emission vehicle cost projections are overly optimistic about the future. The final Scoping Plan must update the analysis to incorporate what has happened since the Integration Analysis projections were completed. Costs have not been going down as projected for 2022. If they cannot forecast a couple of years ahead correctly then estimates out to 2050 are not credible.
The purpose of this analysis was to compare the transportation scenarios for the three mitigation scenarios. There is insufficient documentation to determine if the differences are meaningful. I cannot make any comments on the transportation sector scenario differences.