I have described several New York Office of Renewable Energy Siting (ORES) solar project application decisions and was all but certain that no project would ever be rejected. On August 9, 2022 the The New York State Board on Electric Generation Siting and the Environment (Siting Board) denied approval to North Side Energy Center, LLC (North Side) to build and operate a 180-megawatt solar farm in St. Lawrence County. This post describes the decision.
New York’s Climate Leadership and Community Protection Act (Climate Act) Act establishes a “Net Zero” target (85% reduction and 15% offset of emissions) by 2050. I have written extensively on implementation of the Climate Act. Everyone wants to do right by the environment to the extent that efforts will make a positive impact at an affordable level. My analysis of the Climate Act shows that the ambitions for a zero-emissions economy outstrip available renewable technology such that the transition to an electric system relying on wind and solar will do more harm than good. The opinions expressed in this post do not reflect the position of any of my previous employers or any other company I have been associated with, these comments are mine alone.
New York Solar Development
I prepared a detailed description of the New York permitting process in a recent post so I will not repeat all that information here. In brief, in order to expedite the permits for wind and solar projects New York State has established the Office of Renewable Energy Siting (ORES) which is housed within the Department of State. ORES has the authority to over-rule any local objections to renewable projects if they are unduly burdensome. To this point all the projects proposed have been approved.
I have been writing about problems associated with utility-scale solar development in New York based on input from readers of my blog. In my opinion if you are going to develop solar on the scale proposed in the Climate Act, then there should be a plan for responsible siting. My recent post on another solar project included background information for New York solar development. The takeaway message is that New York has not implemented any kind of a policy that protects prime farmland or addresses responsible solar siting for utility-scale developments. Frankly I was beginning to think that no solar development project would ever be rejected.
North Side Energy Center Decision
North Side Energy Center is being developed by a subsidiary of NextEra Energy Resources, LLC. NextEra Energy Resources is the world’s largest generator of renewable energy from the wind and sun. According to their website, the company has been investing in clean energy for more than 25 years and has a track record of safely building and operating renewable energy centers. The docket for the application is available here.
The Project as proposed would generate up to 180 megawatts (MWs) of solar energy and would consist of commercial-scale solar arrays in a tracker racking system of approximately 8 to 13 feet, but as much as 18 feet, in height. The Project also includes inverters and other components; approximately 7 miles of access roads with widths between 12 and 20 feet; parking, materials and equipment laydown, and construction staging areas; approximately 33 miles of buried and overhead electric collection lines; a collection substation covering approximately 2.2 acres of currently forested land; electrical point of interconnection facilities; an adjacent 230 kilovolt (kV) switchyard; transmission lines; and chain-link fencing seven feet in height around the entire Project.
The North Side project area consisted of approximately 2,235 acres of leased land. The project was to be sited in rural areas in each of the three towns, which is comprised of agricultural and forested land and includes 37 wetland areas and 11 regulated streams. The wetlands total 1,504 acres, or 67 percent — more than two-thirds – of the project area. The project components were proposed to be located on approximately 1,200 to 1,400 acres of the 2,235 acres making up the project area, and were estimated to impact more than 500 acres of wetlands. In addition, seven threatened or endangered species were documented in the project area.
The Order explains the rationale for the disapproval:
After a thorough and complete review of the project and its impacts, the Siting Board denied the application because the adverse environmental impacts associated with construction and operation of the project, specifically impacts to wetlands and threatened and endangered species, have not been minimized or avoided to the maximum extent practicable, as required by law. In addition, the project developer was unable to demonstrate it would comply with applicable State environmental laws related to wetlands and threatened and endangered species.
The presence of several threatened and endangered species, as well as species of special concern in the project area, is not disputed by North Side. The species observed on the site include: Endangered: Short-Eared owls and Golden Eagles; Threatened: Blanding’s Turtles, Northern Harriers, Sedge Wrens, Upland Sandpipers, and Bald Eagles; and Species of Special Concern: Vesper Sparrows, Grasshopper Sparrows.
I have been involved with environmental permitting applications for years. One of the cardinal rules is to avoid wetlands as much as possible. It is amazing that the developer thought that they could get a permit for a project that impacted more than 500 acres on a project footprint of 1,200 to 1,400 acres. Apparently, the word is out that New York is wide open for development and NextEra thought they could get away with it.
My focus on past decisions has been the impact of agricultural lands. For once a project has been proposed that does not exceed the New York State Department of Agriculture and Markets goal for agricultural land conversion. According to the Ag and Markets brief:
Of the overall 2,241-acre Project Area assessed. The Applicant states that approximately 35 percent (781.5 acres) will be used for Project Components within a fenced area of 980.7 acres to generate 180 MW of renewable energy. The Applicant also states that the remaining land outside of the Project’s fenced area will remain under its existing uses. The Project is sited within mapped Agricultural Districts. One hundred twenty-one (121) acres of soil within the Project Area are classified in mineral soil groups 1-4. Similarly, 82 acres of the lands classified as Prime Farmland are proposed to be impacted withing the 1,100-acre Limits of Disturbance.
The Department’s goal is for a project to limit converting agricultural areas to no more than 10% of mineral soil groups 1-4 classified by the Department’s NYS Agriculture Land Classification, which the Department has identified as New York State’s most productive farmland.
In this case, the Applicant has met the Departments’ siting policy in that the settlement layout and does not propose to impact more than 10% of agricultural lands comprised of Mineral Soil Groups 1-4, as described by the NYS Agricultural Land Classification.
Ramifications
One amusing aspect of the State’s description of the decision was the apologetic tone of the press release. First was the caveat that they have been approving projects:
To date, the Siting Board has approved 17 renewable energy projects since 2018. North Side is the first renewable energy project rejected by the Siting Board. Additionally, the recently created New York State Office of Renewable Energy Siting has approved five renewable energy projects to date. North Side was expected to begin commercial operation in the fourth quarter of 2023.
Then the description claimed that the State tried to get the developer to make changes thus deflecting blame:
It’s important to note that significant efforts by State agency parties were made throughout the review process to have the developer change the project to reduce the impacts on wetlands and endangered species, including by reducing the size of the project. The developer can seek rehearing and appeal the Siting Board’s decision or file a new application.
While it is encouraging that the State did deny the application for a renewable project it is important to note that the application was incredibly arrogant. The idea that a project that a project that impacted 500 acres of wetlands (over a third of the disturbed area in the project!) would be approved should have been rejected out of hand by the developer. That NextEra thought they could get away with it speaks volumes about the impression that outside of the state developers have about New York solar siting.
Unfortunately, there is no sign that ORES is concerned about the effect of massive utility-scale solar development on New York’s agricultural industry in general and on the loss of prime farmland in particular. Until such time that utility-scale solar is required to meet the New York Department of Agriculture and Markets guidelines for responsible solar siting irresponsible solar developers like NextEra will continue to destroy prime farmland.
Resources for the Future (RFF) has published an Issues Brief titled Retail Electricity Rates Under the Inflation Reduction Act of 2022. According to the report the Inflation Reduction Act (IRA) legislation, will “save typical American households up to $220 per year over the next decade and substantially reduce electricity price volatility.” This setoff my BS detector so I got some data from Texas to see if the state with the most total renewable energy production has seen reduced costs from their wind and solar development.
The Climate Act establishes a “Net Zero” target (85% reduction and 15% offset of emissions) by 2050. I have written extensively on implementation of the Climate Act. Everyone wants to do right by the environment to the extent that efforts will make a positive impact at an affordable level. Based on my analysis of the Climate Act I don’t think that will be the case. I believe that the ambitions for a zero-emissions economy outstrip available renewable technology such that the transition to an electric system relying on wind and solar will do more harm than good. The opinions expressed in this post do not reflect the position of any of my previous employers or any other company I have been associated with, these comments are mine alone.
I am not going to address the IRA provisions directly. The Institute for Energy Research described the huge renewable tax incentives and subsidies earlier this week. Anthony Watts applauded the Wall Street Journal and Bjorn Lomborg for showing how useless the IRA is at tackling climate. H. Sterling Burnett explained that the claims made about its effects on greenhouse gas emissions are “pure fantasy”. The RFF report was one of the analyses that alleged that the IRA would benefit consumers and I will focus solely on that. This analysis is of particular interest to New Yorkers because this type of study was used in the Integration Analysis and I expect the drawbacks described below are present in that work as well.
RFF analyzed the effects on the crucial electricity sector using their in-house Haiku Electricity Market Model to “project electricity retail rates for a range of potential scenarios that account for variability in future fuel prices, capital and technology costs, and uptake of specific provisions of the legislation. The analysis found that if the legislation is passed:
Retail costs of electricity are expected to decline 5.2-6.7 percent over the next decade, saving electricity consumers $209-278 billion, given expected natural gas prices.
The average household will experience approximately $170-$220 in annual savings from smaller electricity bills and reductions in the costs of goods and services over the next decade.
Ratepayers are insulated from volatility in natural gas prices, with electricity rates projected to decrease even under a high natural gas price scenario.
2030 electricity sector emissions are projected to drop to 69.8 percent to 74.9 percent below 2005 levels, compared to 48.5 percent below 2005 levels without the policy.
The RFF Haiku model analyzes regional electricity markets and interregional electricity trade in the continental United States. It is all the rage for consulting companies to develop an in-house model suitable for projecting future electric system resources. RFF claims that:
“The model accounts for capacity planning, investment, and retirement over a multi-year horizon in a perfect foresight framework, and for system operation over seasons of the year and times of day. Market structure is represented by cost-of-service (average cost) pricing and market-based (marginal cost) pricing in various regions. The model includes detailed representation of state-level policies including state and regional environmental markets for renewable energy and carbon emissions and frequently has been used to advise state and regional planning.”
I have had to deal with these electric production and costs models for over 40 years. I cannot over emphasize that even the most sophisticated of these models have difficulties dealing with the generation capacity needed for peak loads and the intricacies of the transmission grid. The Haiku Electricity Market Model documentation shows that the model is so simplified that I don’t think it can get reasonable projections correct. For example, the model simulates the contiguous United States with 21 regions and calculates the transmission between those regions in order to estimate capacity requirements. New York alone has eleven control areas and the transmission constraints for those areas and adjoining regions are needed to accurately estimate generating resource needs. All the little constraints that are averaged out in the RFF model mask a major portion of the capacity requirements and energy needs that under-estimate costs. This is a particular problem as more and more wind and solar energy resources are added to systems. The RFF model and others like it have consistently under-estimated the emission reductions from fuel switching from coal and oil to natural gas electricity production and I think they are under estimating the difficulty replacing natural gas generation with wind and solar. Moreover, somebody, somewhere has to account for the intermittent nature and lack of ancillary services from wind and solar. I don’t think a simple model can capture those costs.
On the other hand, if adding renewable resources in certain jurisdictions has led to lower costs then my reservations are wrong. According to a recent US News and World Report article Texas produces produce the most total renewable energy (millions of megawatt-hours), according to the U.S. Energy Information Administration. That article notes that: “In the first quarter of 2022, Texas led all states in overall renewable energy production, accounting for over 14% of the country’s totals, due in large part to the state’s prolific wind energy program”.
The United States Energy Information Administration (EIA) Electricity Data Browser enables a user to access electricity generation and consumption data as well as electricity sales information. The data can be filtered as needed. I filtered the data to look only at Texas data. I downloaded the monthly total net generation (GWh) and the net generation from just renewable resources so I could calculate the percentage of renewable generation energy. Then I downloaded the average monthly residential average price of electricity. The following graph shows the results. The residential cost of electricity has been increasing steadily since 2001. The percentage of renewable energy has increased from almost nothing in 2001 to recent months over 30%. I am not seeing that the deployment of renewable resources produced a reduction in costs.
In conclusion, the Texas data do not show that renewable energy deployment reduces costs. The RFF projections that the IRA will reduce costs due to renewable development are very unlikely because the overly simplified model cannot reproduce the features of the electric system that lead to higher prices from intermittent wind and solar resources.
If anyone, anywhere can find any jurisdiction where the development of massive amounts of wind and solar reduced prices please let me know. In the meantime, I call your attention to the comments of Rud Istvan at the Watts Up with That article who explains that:
The EIA LCOE has since at least 2015 claimed on shore wind was at parity with CCGT. This is simply false, based on deliberately bad underlying assumptions. The worst is that EIA explicitly assumes both have useful capital lives of 30 years. That is at best gross negligence, at worst deliberate prevarication. The modern on shore big wind turbines (~2-3 MW each) have at best 20 year lives. The problem is inherent in the uneven axial bearing loading since wind at the top has a higher velocity than wind at the bottom. Axial bearing failure is sudden death, and for an older turbine not worth a very expensive repair. CCGT has at worst a 40 year life (GE warranty). And in practice 45-50.
Some years ago (2016 IIRC) over at Judith’s I posted ‘True cost of wind’ illustrating then fixing the basic obvious EIA errors. The result was CCGT LCOE about $58/MWh, while wind (based on the Texas ERCOT grid at then about 10% penetration) was $146/MWh.
No amount of IRA incentivizing or Biden pontificating can fix the basic problem that wind is MUCH more expensive. And this is also easily demonstrated for Europe without EIA LCOE annuity calculations by simply graphing wind penetration versus retail electrify rates by country. A very strong positive linear correlation. Higher penetration always means higher rates.
For over two years I have been reviewing New York’s Climate Leadership and Community Protection Act (Climate Act) primarily with respect to those aspects where I have a professional or personal interest in the impacts to me. One of the topics that I have spent a lot of time on is residential electrification with an emphasis on home heating. This article addresses the building shell requirements necessary to include when home heating is electrified.
Everyone wants to do right by the environment to the extent that efforts will make a positive impact at an affordable level. I have written extensively on implementation of New York’s Climate Act because I believe the ambitions for a zero-emissions economy embodied in the Climate Act outstrip available renewable technology such that it will do more harm than good. The opinions expressed in this post do not reflect the position of any of my previous employers or any other company I have been associated with, these comments are mine alone.
Climate Act Background
The Climate Act establishes a “Net Zero” target (85% reduction and 15% offset of emissions) by 2050. The Climate Action Council is responsible for preparing the Scoping Plan that will “achieve the State’s bold clean energy and climate agenda”. They were assisted by Advisory Panels who developed and presented strategies to the meet the goals to the Council. Those strategies were used to develop the integration analysis prepared by the New York State Energy Research and Development Authority (NYSERDA) and its consultants that quantified the impact of the strategies. That material was used to write Draft Scoping Plan that was released for public comment at the end of 2021. The Climate Action Council will revise the Draft Scoping Plan based on comments and other expert input in 2022 with the goal to finalize the Scoping Plan by the end of the year.
Last April Jim Shultz authored a Niagara Gazette commentary titled: Is New York state coming after our furnaces? that addressed a rumor that the Climate Act would ban gas furnaces. I mention the article because he eloquently described the Draft Scoping Plan: “The plan is a true masterpiece in how to hide what is important under an avalanche of words designed to make people never want to read it.” Nowhere is this more evident than in the documentation associated with residential electrification building shell requirements.
If you are interested in background information, in an article describing my interview with Susan Arbetter at Capital Tonight I gave an overview of heat pump technology and described building shells. In the energy efficiency world, building shells refer to the insulation, infiltration, window treatments and ventilation components of the building. I will focus on building shell requirements in the rest of this article.
Draft Scoping Plan Building Shells
The Draft Scoping Plan does not include a description of the building shell assumptions sufficient to differentiate between the reference, basic, and deep shell categories used in the Integration Analysis. The primary reference for Draft Scoping Plan information related to building shells is Appendix G, Integration Analysis Technical Supplement Section I chapter 3.3 Sectoral Results – Buildings. The following paragraph is the entire narrative description of building shells.
Building shell improvements (such as improved insulation, window treatments, or deep home retrofits) are modeled as reducing service demand for HVAC devices. Improvements to buildings incur costs but improve home and office comfort in addition to reducing energy bills. Two bundles of building shell improvements have been included: a basic shell upgrade and a deep shell upgrade. Basic and deep shell upgrades include a variety of measures focused on reducing energy use and increasing occupant comfort; these measures include, for example, varying levels of roof and wall insulation improvements, window treatments such as double or triple paned windows and infiltration improvements. Space heating demands are reduced by 27-44% with the basic shell package and 57-90% with the deep shell package, depending on building type. Air conditioning demands are reduced 14-27% with the basic shell package and 9-57% with the deep shell package. The total impact of building shell improvements on total HVAC service demand in buildings is a function of the market penetration of each package and distribution of building types. Building shell improvements include both retrofits and new construction, although all new construction in residential and commercial is assumed to be code-compliant and therefore has lower HVAC service demands relative to the existing building stock. E3 calculated the stock rollover of building shells with a 20-year lifetime to reflect improvements in new construction and opportunities for home retrofits.
In addition to the narrative description of building shells there is descriptive information in the supporting spreadsheets. The Annex 1 Inputs Workbook spreadsheet, Tab: Bldg_Res Device Cost lists device costs for three categories of residential households: large multi-family, small multi-family and single family. Costs are listed for the three types of building shell upgrades and for air source heat pumps, electric resistance backup heat, and ground source heat pumps. I used this information to estimate total residential heating conversion costs for my comments on the Draft Scoping Plan.
In the Annex 2 Key-Drivers spreadsheet there are tabs with building shell metrics. Scenarios 2-4 note that in 2020 there were a total of 8,301,996 residential buildings with 48,551 basic shell residences, 37,699 deep shell residences, and 8,215,747 reference shell residences. There is no difference in the projected building shells for the three mitigation scenarios. For scenario 2 (tab S2_Building Shells) in 2050, the integration analysis projects 8,684,001 residences, with 5,714,918 basic shell residences, 2,285,000 deep shell residences and only 684,080 reference shell residences. The following table lists the projected number of different types of building shells and the annual deployment rate.
A couple of points about this table. Note that the number of building shells in the Reference Case differs from the mitigation scenarios in 2020. Obviously, there should not be a difference. I have no idea which set of numbers is correct. The second point is that the mitigation scenario deployment rates are unrealistic between 2030 and 2040. The total of the basic and deep shell conversions works out to over 1,250 building shell upgrades per day.
Practical Application
So much for the theory. I live in a single-family residence heated with an efficient natural gas furnace. In my opinion one of the disadvantages of heat pump technology is that the output heat is relatively low compared to a combustion source furnace. The temperature at the register for a heat pump system is around 90oF whereas in my house the temperature is around 120oF. My concern is that there are some cold rooms in my house even when the furnace is providing hot air despite my best attempts to adequately insulate and reduce air infiltration. The worst problem is in the bedroom we added over the garage. In order to determine what I would need to do to install an air source heat pump that would provide comfortable heat year-round I really needed an energy audit.
National Grid recently announced a Home Energy Savings Program in cooperation with the New York State Energy Research & Development Authority (NYSERDA) that included an assessment of energy use in homes that was open to customers in my county. Figuring I had nothing to lose I requested an audit. When I scheduled the home assessment, I said I was particularly interested in what I would have to do to install a heat pump.
I believe that National Grid has a contract with ICF to manage the Home Energy Savings Program. ICF arranges for local heating, cooling and air quality contractors to provide the assessments themselves. I believe that National Grid and NYSERDA pay for the audit but I got the impression that the auditor could make a commission if equipment was sold. The auditor assigned to do my assessment had a certification from the Building Performance Institute and knew his stuff. Interestingly the fact that he was unfamiliar with the basic and deep shell terminology used in the Draft Scoping Plan suggests that the Plan’s authors were not certified by the Building Performance Institute.
Audit Results
The auditor and an intern working for the company spent two hours evaluating my house from top to bottom. We talked about my concerns and needs and then they checked the outside of the home and the main floors, basement and attic interiors. Because my primary concern was home heating, they concentrated on heat loads. As has been the case for every aspect of the Climate Act I have evaluated closely, reality as explained by experts is different than the situation portrayed in the Integration Analysis.
Heat loads can be calculated two ways. According to the auditor “About 90-95% of the industry is still in the stone age and sizes systems based primarily off square footage of the home… not actual heat loss or heat gain through insulation, windows, building material, volume of home, area of building envelope/shell areas, etc.” The preferred alternative is to do an Air Conditioning Contractors of America “Manual J Calculation” or “Heat Load/Heat Gain Calculation”. He explained that “This historically has been done manually, and since the computer age came about there are now Manual J software programs which are used to model homes and run the calculations for you based off different input data gathered from a home during an energy audit”.
The auditor has found that about 90% of the homes he analyzes have drastically oversized heating equipment which he attributes to the older and less accurate heating load calcuations. As a result, there are the following consequences: rapid cycling, reduced efficiency and system lifespan, and reduced comfort and adequate distribution because of the fan always cycling. He said that sizing is even more important for condensing furnaces, heat pumps, and air-conditioners. He has seen condensing furnaces (i.e. 92% efficient or better) with cracked heat exchangers after only 5 years because of these problems.
He also explained that air conditioning systems work by removing moisture, so if they are oversized and rapidly cycle, they will not be removing enough moisture from the air at the correct rate at which the air is cooled. Most people who complain of hot rooms in the home are told they need a bigger air conditioning unit. This is counterintuitive and the wrong way to do it. A bigger system means more airflow is needed, and if the ductwork sizing is not adjusted accordingly, the evaporation coil will freeze on the furnace and the system will shut down until it defrosts. Another scenario is that with rapid cycles you end up with cold air but it is still humid… giving that clammy cold feel. Or, the problem doesn’t change at all and the room still stays too hot because it is related to the amount of air getting to that room through a duct. The duct size is the limiting factor because only large systems (100,000btu or higher) have larger blower motors that can move sufficient air.
With regards to heat pumps, it is particularly important that the heat loads are calculated correctly. If the heat pump is oversized you end up with the efficiency of basically resistant electric strip heat (baseboard electric heat). He said that New York’s push for heat pumps is unsophisticated because the way the grants are designed it forces contractors to oversize the heat pumps. Apparently, some heat pump brands might be okay if they are oversized. He explained that:
Some efficiency will be lost if the system is oversized, however they can still run efficiently relative to oil, propane, natural gas, and don’t always end up running at the efficiency of basic strip electric resistant heat. The most important thing with heat pumps is “turn down ratio”, aka what is the lowest heat output it can produce. As long as the lowest heat output on a heat pump unit is still higher than the particular demand of a home on any day during any hour of the winter, it will still operate properly and efficiently. Will some efficiency be lost still? Yes, but not nearly as bad as if the turn down ratio is higher than the lowest heat requirement of the home as noted above. A lot of installers don’t get this unfortunately. Neither does New York State. But we can still win battles against it all day-to-day through conversation.
There are other ACCA manuals: Manual S covers heating and cooling sizing and selection, Manual T is used to determine air distribution within the building, and Manual D supplements the other manuals to determine appropriate heating and cooling duct design. The obvious point is that all this information is necessary to properly design a replacement building shell heating, ventilation, and air conditioning system. If it is done wrong there will be serious problems.
Building Shell Definitions
In response to my question about the building shell the auditor could not respond. He asked me and all I could do is point to the sparse Draft Scoping Plan documentation. We agree that the documentation is insufficient for contractors to specify improvements necessary to meet the Plan definitions. This section contains my best guess but there is an inconsistency with the Integration Analysis projections. In a post in November 2020 I noted that you could see the variation in energy efficiency in my neighborhood by looking at early morning frost patterns. Based on my crude analysis only 10% of the homes in my mid-60’s housing development appear to have large reduction potential, 50% could use improvements compared to the remaining 40% of homes that appeared to have well-insulated homes. If the reference shell refers to a home with minimal insulation, then my best guess is that the reference shell would only be 10% of the existing stock in my neighborhood.
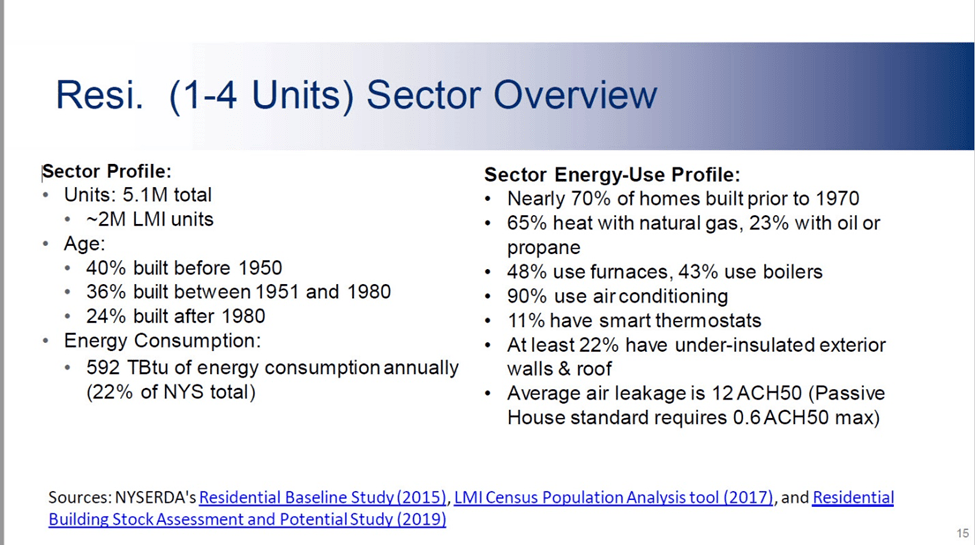
My November 2020 post also included the following overview slide of the residential housing sector profile of New York prepared by the New York State Energy Research and Development Authority (NYSERDA). It was included in the Energy Efficiency and Housing panel presentation on October 16, 2020. Note that “at least 22% of residences have under-insulated exterior walls and roof”. This is another possible definition of the reference shell but that is inconsistent with the Integration Analysis 2020 housing stock estimates.
The auditor made the point that the industry does not use the Deep and Basic shell terminology defined in the Integration Analysis and Draft Scoping Plan. Instead, there are industry standards of R-Value (R-49 for attic flats, for example). However, that approach over simplifies the actual energy losses. He explained that spray foam vs. attic flat cellulose/fiberglass batt R-Values are not an “apples to apples” comparison because the foam seals air infiltration too.
In our discussion he explained that one of the factors which differentiate “deep shell” work vs. “basic shell” work could be hitting the building airflow standard (BAS). He said that NYSERDA requires their contractors to hit BAS for all retrofit jobs that are getting heat pump funding through low income NYSERDA grants. He explained that this this is a problem because:
I have seen maybe two or three retrofitted homes in 10 years that have hit BAS when all industry standard R-Values in walls, basements, crawl spaces, attics, windows etc. are achieved. However, there is some “gray” when calculating BAS, and it comes down to what you consider “conditioned space”. If a basement is not heated with supply grills/supply ducts dedicated to the basement, by definition the basement is not considered “conditioned space” and therefore the volume of the basement is not included in the BAS (i.e. the BAS value for the entire home is lower, making it much harder to achieve on retrofit projects). However, since there is by definition heat loss through the metal in ductwork (up to 10,000-15,000btu on average I have found which is defined in Manual J calculations as “duct loss”) then would this not latently be heating basements and crawl spaces? This is what I have assumed when calculating my heat loads and BAS calculations. I include the basement, insulated or not, and crawl spaces (only when insulated for crawl spaces due to vents, etc.) as conditioned space because they are being latently heated. This makes the most sense to me. In my experience I have seen most retrofitted homes meet BAS when including the basement as conditioned space.
There is another complication. When running Manual J’s, I negate out the “duct loss” factor since in a basement the latent heat being “lost” is going directly into the basement and above grade walls anyway. This 10,000-15,000btu “duct loss” is another “oversizing” issue when running Manual J’s. Ultimately this means that out of the maybe 5% of companies out there running Manual J’s instead of sizing by house SQ FT. very few of that 5% are removing “duct loss” in their Manual J’s according to where the ducts actually are. If they run through a vented crawl space or the run outside (or a non-air sealed/non spray foamed mobile home underbelly), I would consider that true “duct loss”. A basement or unvented crawl space under a home is providing heat to the house. If that is not done correctly the result is that the system will be over-sized.
Also note that there is a reference to air leakage with respect to the Passive House standard in the NYSERDA slide. My best guess is that “deep” building shell improvements are equivalent to the international standard for passive buildings. It includes the following measures:
Efficient heat generation (which in this case means heat pumps.
There is an inconsistency in the building shell deployment table with respect to the 2020 distribution of building shell types concerning the relative distribution. The Integration Analysis claims that about half a percent of the existing building stock meets the deep shell criteria. If my guess that the Passive House criteria represent a deep shell, I think that would be consistent. The problem arises with the reference shell. Both my crude analysis or the NYSERDA 22% are under insulated criteria for the reference shell are far less than the Integration Analysis presumption that 99% of the residences in New York have reference shells in 2020.
The definition problem is most acute between the reference and basic shells. Apparently, the basic shell is something intermediate between meeting all the passive house criteria and being under insulated. Ideally what the energy contractors of the state and the authors of the Draft Scoping Plan need to do would be to define what constitutes the standards for each level of building shells based on the passive house measures.
There are some ramifications to the existing lack of specificity. The Integration Analysis assumes energy and emission reductions based on the conversion from reference to basic and deep shells. It appears that the analysis is not accounting for the large number of residences that have enough building shell upgrades beyond the reference shell that they should be considered basic shells. Ignoring this means that the projected improvements in the Integration Analysis are far greater than can be reasonably expected.
Ventilation
Several months ago, I contacted the writer of a letter to the editor because he raised important points about building ventilation. He is an expert on ventilation analysis and energy efficiency and I asked him about the passive house resource ventilation requirement reference. I asked what the reference to passive house ventilation with highly efficient heat recovery would entail. He said that it referred to using an Energy Recovery Ventilator (ERV).
He explained that it is much easier to incorporate into an existing HVAC system than it sounds. They are not free, but “using one pays dividends in many cases as for health and human performance”. Although he has dealt mostly with commercial units he mentioned that Panasonic has been advertising a new residential unit, the Intelli-balance 200 ERV that retails for around $2700.
The concept is simple: Air is exhausted and as it goes through a heat exchanger in the ERV. About 70% of the energy is transferred to the incoming air for either heating or cooling mode. There are two fans (sometimes only one motor runs them both), filters to protect the heat exchanger, and the heat exchanger.
He said that “these amazing units were not available 40 years ago, or they were all metal and very expensive”. He offered a few other tidbits:
ERVs use a small amount of electricity for a residence.
ERVs have one intake, one exhaust, one air supply and one return that gets exhausted.
ERVs are relatively quiet when properly installed.
ERVs recover about 70% of the energy from the exhaust air.
ERVs can be integrated into a home furnace in the winter because the ERV pre-warms the air significantly before it enters the mixing box where the full air flow goes into the furnace. For example, 100 cfm of ERV air in mixes with 900 cfm of return air so the mix is nearly the same as ordinary return air. This way the furnace heat exchanger is not being fed very cold air which can be harmful to a furnace not designed to heat air that is very cold.
He also explained that the ERV forces exchange of inflow and exhaust. The ERV can adjust the air flow exchange so that a bathroom or kitchen exhaust brings in a little more air than you exhaust. You do not want to create a negative pressure in the house especially where there are gas burning appliances. It is possible to draw air away from the cooking, water heating or space heating if they do not have forced draft combustion as also do some furnaces. This is a concern when infiltration is minimized to the standards suggested in the Integration Analysis. Furthermore, if you bring in a slightly more ERV air than is exhausted the house is then slightly pressurized so there are few to no drafts.
Finally, he made the point that these building systems cannot be evaluated by just looking at one piece. All the air into the house or commercial building needs to be accounted for. All the appliances have to work together to control the air flows and pressures of the building. It is not complicated, but does need attention. The final heating ventilation and air conditioning recommendation he made is the need for residential humidifiers in our cold dry climate in the winter. Dr Stephanie Taylor MD has shown that when space humidity is too dry it can increase the risk of colds, flu, and other respiratory ailments.
My Audit Results
The auditor explained what he thought would be needed for shell upgrades for a system that would make air source heat pumps a viable alternative for my home. My furnace is over-sized and the duct work is under-sized for the existing system. As noted above one of the big issues with the whole house heat pumps is that you need to change the ductwork to enable more air flow so I would need to replace a lot of the existing system. My house would need to get more insulation and sealing at the sill of the basement wall. I have installed a ceiling in most of the basement and that would have to be ripped out. It may be that those costs are included in the Integration Analysis projections but due to the lack of documentation we don’t know for sure.
Relative to the added bedroom over our garage and he said those were notorious for heating and cooling problems. In order to fix that he recommended a ductless heat pump at an approximate cost of $5300 but there is a National Grid grant of $500 so the cost would be $4800. He did mention that there is a wait time for these systems and whole house heat pump systems are simply not available at this time.
I did not request a quote for a whole house system. Nonetheless he gave me some suggestions. Given the changes needed to the duct work the whole house system would be more expensive that the ductless systems. His initial thought was that we would need four ductless heat pumps to do the whole house but it is not clear to me how that would work. On the main floor a system at each end of the house would provide heat for that floor. If there are two systems on the upper floor how is heat supposed to get into the other two bedrooms – sleep with the doors open? The estimate of four system also does not include heat for the basement.
He admitted that converting to a air source heat pump could not save money compared to using natural gas and noted that given the state of my house upgrading insulation, windows and air infiltration would not ever pay back the investment either. He said most of his clients that install heat pumps do it for environmental reasons.
Conclusion
I do not doubt that heat pump technology can work in New York State. However, it is not simply a matter of swapping out a fossil-fired furnace for a heat pump and the potential for the conversion to be done improperly is high particularly given the tremendous rate of conversions envisioned in the Integration Analysis. Clearly it is not just the heating system but the building shell needs revisions too. Based on my discussions with these experts the air infiltration, inflow, and exhaust requirements are much higher priorities than I realized. The Climate Action Council needs to be sure that the Final Scoping Plan adequately defines the building shell criteria so that experts in the field understand what the State claims is necessary for the different building shell types. This is also crucial so that the projected energy savings and emission reductions are achieved.
The Climate Leadership and Community Protection Act (Climate Act) includes a commitment for environmental justice goals. I recently described the comments I submitted on the Climate Justice Working Group (CJWG) draft criteria to determine which communities should be targeted for benefits from Climate Act investments associated with these environmental justice goals. This post describes the energy affordability indicator.
The Climate Act establishes a “Net Zero” target (85% reduction and 15% offset of emissions) by 2050. I have written extensively on implementation of the Climate Act. Everyone wants to do right by the environment to the extent that efforts will make a positive impact at an affordable level. Based on my analysis of the Climate Act I don’t think that will be the case. I believe that the ambitions for a zero-emissions economy outstrip available renewable technology such that the transition to an electric system relying on wind and solar will do more harm than good. The opinions expressed in this post do not reflect the position of any of my previous employers or any other company I have been associated with, these comments are mine alone.
Climate Act Background
The Climate Action Council is responsible for preparing the Scoping Plan that will “achieve the State’s bold clean energy and climate agenda” in the Climate Act. They were assisted by Advisory Panels who developed and presented strategies to the meet the goals to the Council. Those strategies were used to develop the integration analysis prepared by the New York State Energy Research and Development Authority (NYSERDA) and its consultants that quantified the impact of the strategies. That material was used to write Draft Scoping Plan that was released for public comment at the end of 2021. The Climate Action Council will revise the Draft Scoping Plan based on comments and other expert input in 2022 with the goal to finalize the Scoping Plan by the end of the year.
The article describing my comments covered the background of the CJWG process to develop criteria to identify Disadvantaged Communities and mentioned that there is a fact sheet on the process. For the purposes of this article, the focus is on one of the 45 indicators – “energy affordability”. In the comments I submitted on the process I made a recommendation to address the affordability concern. In particular I explained that I believe that energy poverty is the issue that I think will most likely occur and will adversely affect the low- and middle- income people in Disadvantaged Communities and across the state. I noted that I was concerned that the emphasis on communities would result in those citizens who suffer from energy poverty but don’t happen to live in a Disadvantaged Community getting left behind. I recommended that the weighting for energy poverty should be increased to address this concern. In this analysis I reviewed the data used for the energy affordability indicator to try to quantify the effect of the CJWG approach.
Metric Definition: Average energy costs as percentage of income
Data Source: DOE Low-Income Energy Affordability Data (LEAD) Tool (U.S. Census Bureau’s American Community Survey 2018 Public Use Microdata Samples)
Calculation Method: DOE used census energy expenditure data, housing unit type data, household income data, and number of people in the household, to model the average energy burden by tract.
Rationale for Inclusion: Energy affordability or energy burden is an indicator that is highly actionable and addressable by the Climate Act. The NY REV Energy Affordability Policy intends to limit energy costs to no more than 6% of income as per the 2016 order from the PSC, which plans for bill assistance, energy efficiency, and access to clean energy resources to decrease low-income energy costs.
High energy burden leads to stress, depression, hot or cold home temperatures, and associated health risks including asthma. This metric is also a proxy for type and age of home, which could impact how expensive it is to heat or cool due to materials or inefficiencies.
Potential Limitations and Future Improvements: The US DOE’s estimation approach does have some margin of error that they are looking to improve upon by using more measured values in future iterations.
Ma, Ookie, Krystal Laymon, Megan Day, Ricardo Oliveira, Jon Weers, and Aaron Vimont. 2019. Low-Income Energy Affordability Data (LEAD) Tool Methodology. Golden, CO: National Renewable Energy Laboratory. NREL/TP-6A20-74249. https://www.nrel.gov/docs/fy19osti/74249.pdf.
The CJWG DAC criteria documentation noted that “The NY REV Energy Affordability Policy intends to limit energy costs to no more than 6% of income as per the 2016 order from the PSC, which plans for bill assistance, energy efficiency, and access to clean energy resources to decrease low-income energy costs.” I have not been able to find any documentation that explains where New York stands relative to this goal. In my opinion, someone, somewhere should summarize the number of people who are paying more than 6% of their income on energy costs. I thought that the data used for this metric might be able to shed some light on this metric as well as address my specific concerns about the CJWG criteria for Disadvantaged Communities.
The Low-Income Energy Affordability Data (LEAD) Tool was developed by the Better Building’s Clean Energy for Low Income Communities Accelerator (CELICA) to help state and local partners understand housing and energy characteristics for the low- and moderate-income (LMI) communities they serve. The tool provides data, maps, and graphs. Data for the LEAD Tool comes from the U.S. Census Bureau’s American Community Survey 2018 Public Use Microdata Samples. The energy data is for housing only.
In order to use LEAD the first step is to select an Income Model from the following options:
Area Median Income (AMI) – The Area Median Income is the midpoint of a region’s income distribution – half of families in a region earn more than the median and half earn less than the median.
Federal Poverty Level (FPL) – The Federal Poverty Level is a measure of income used by the U.S. government to determine who is eligible for subsidies, programs, and benefits.
State Median Income (SMI) – The State Median Income is the midpoint of a region’s income distribution – half of families in a region earn more than the median and half earn less than the median.
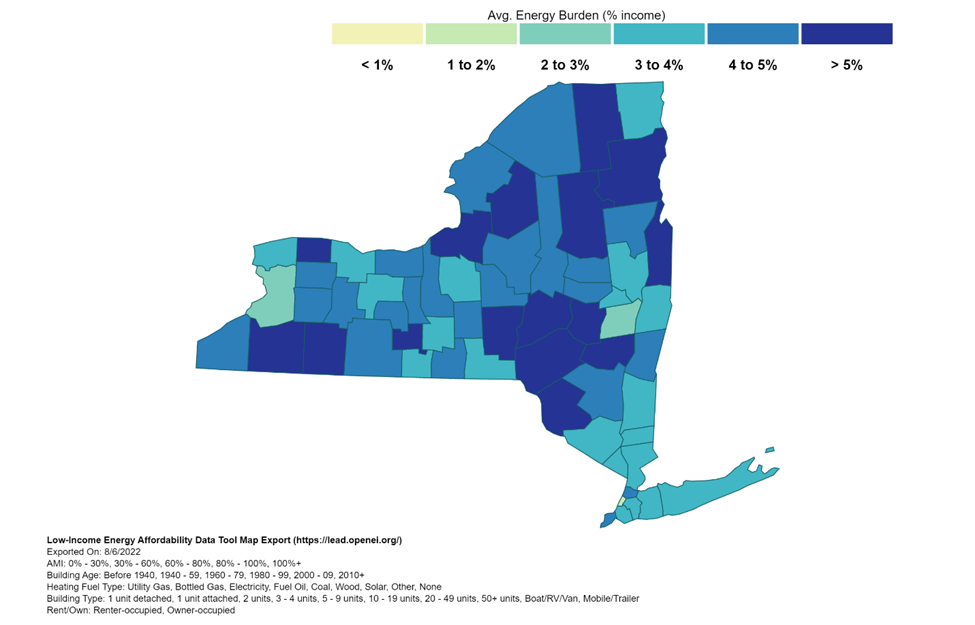
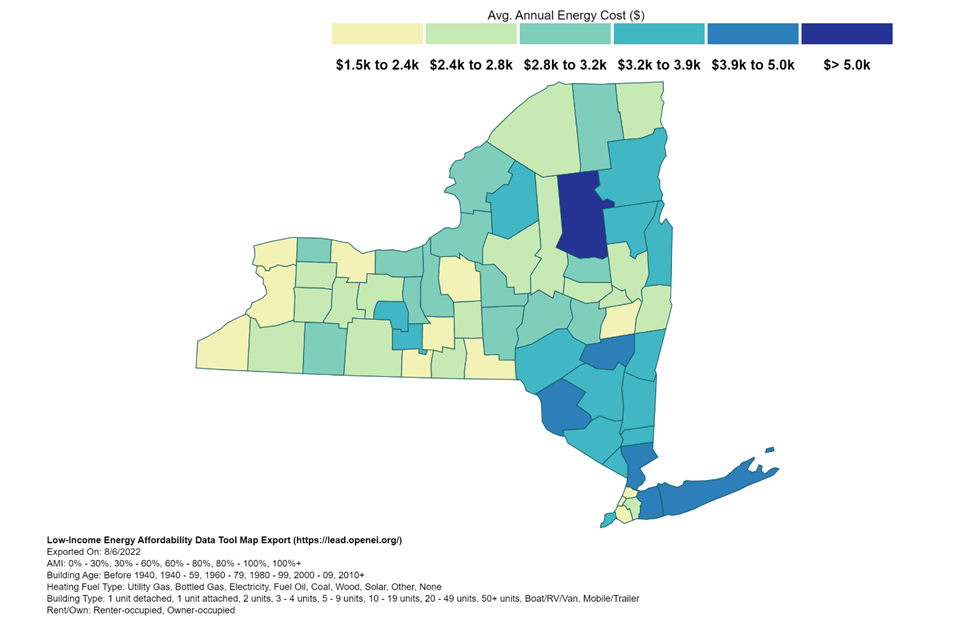
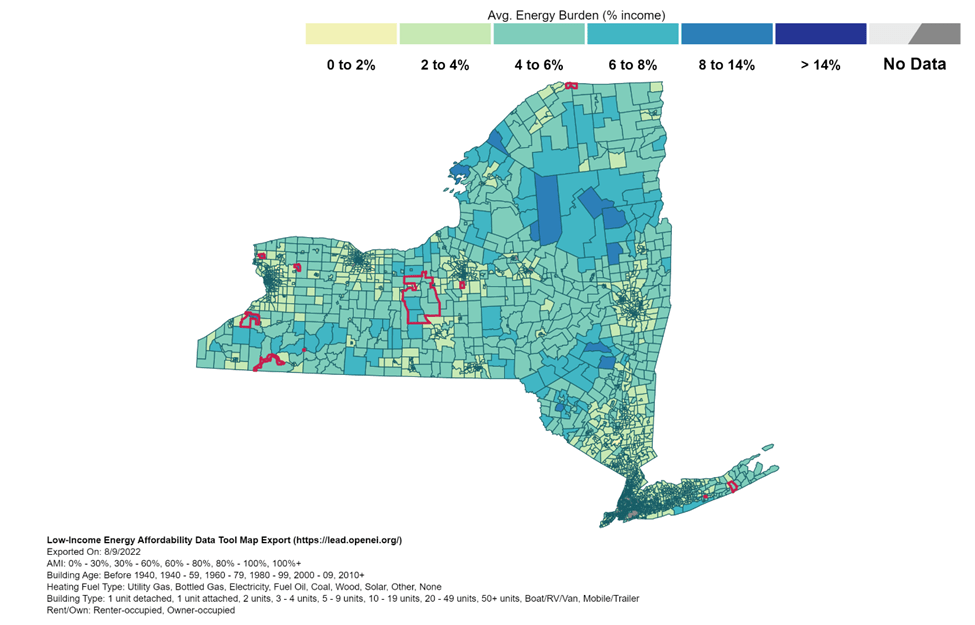
The following figures show the annual energy burden and energy cost as a function of the AML. I compared the output for the different income models and found that there was no significant difference in the results for the New York counties output. The model generates New York State’s County, city and census tract data for average energy burden, average annual energy cost, and housing counts.
LEAD Tool New York Map Average Energy Burden (% income)using Area Median Income
LEAD Tool New York Map Average Annual Energy Cost ($) using Area Median Income
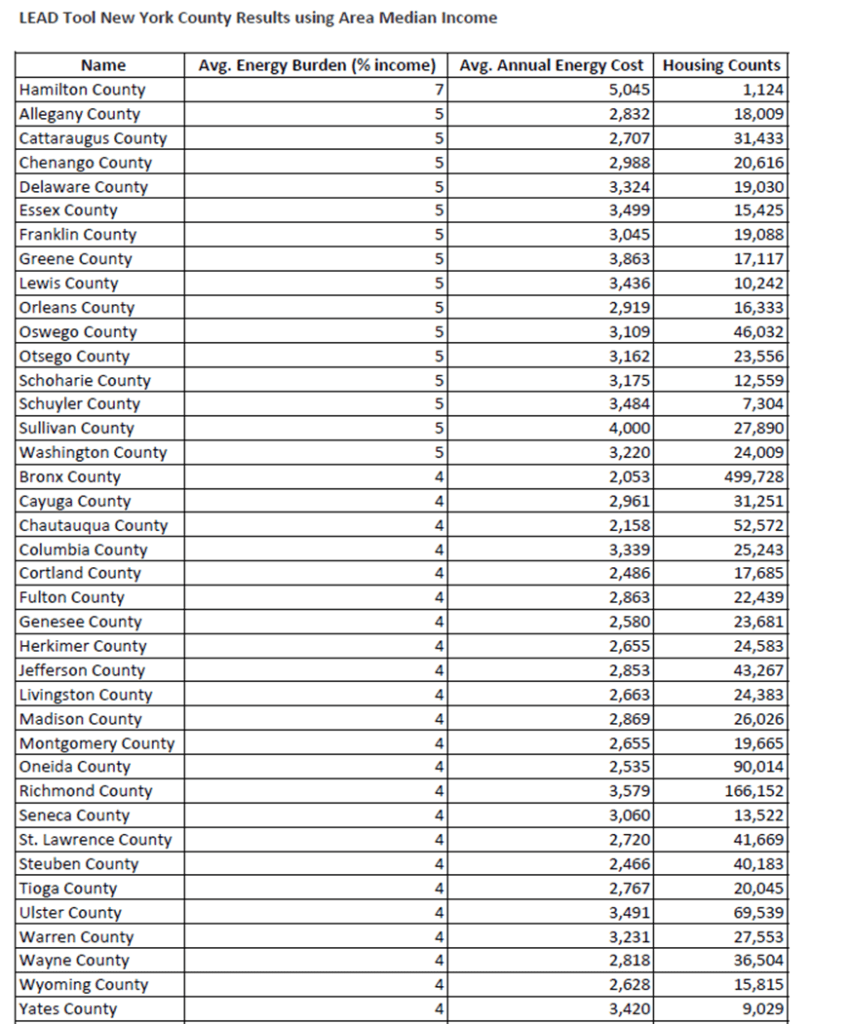
The county specific results for the whole state are available here and the results for those counties that have an average energy burden of 4% or greater are listed below.
The CJWG DAC criteria are based on census tract data. The census tract map is shown below and specific results for the whole state are available here. The map shows that there are many areas of the state that exceed the 6% target, albeit the average energy burden per census tract does not tell us how many people actually have energy burdens that exceed the target. Note that many of the census tracts in the Adirondack and Catskill Parks exceed the 6% threshold.
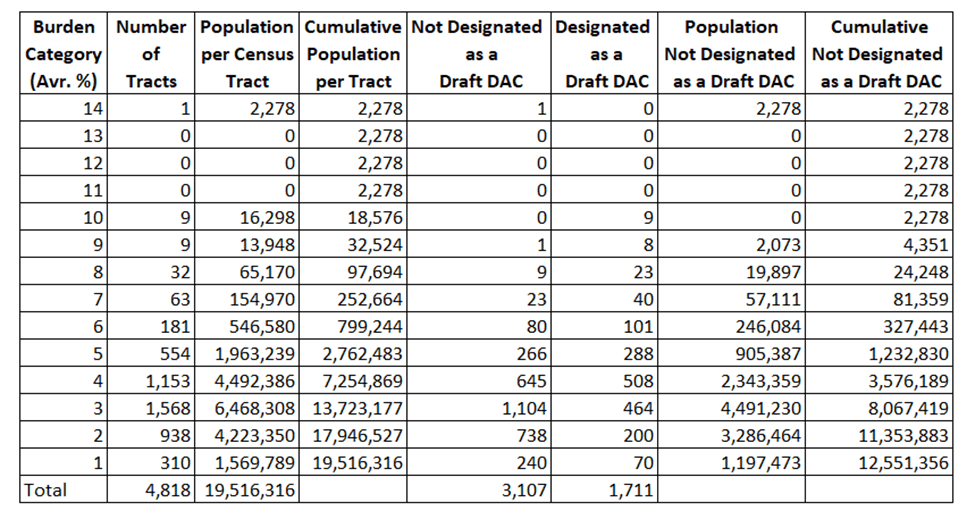
The breakdown of the average energy burden by census tract table below provides more information. There are 4,818 census tracts in the LEAD Tool output that have average energy burden estimates. (There is not an exact one for one matchup between the census tracts available in the LEAD Tool and the CJWG DAC Criteria technical support documentation but the differences are small and I believe that they are inconsequential.) The distribution of the average energy burden shows that most census tracts have a burden less than the 6% target. Note, however, that the even if the average burden for a tract is in the 1% category there still will be some people that could have an energy burden greater than 6%. The cumulative population for the energy burden categories six and greater is nearly 800,000 people. The distribution of the census tracts that are designated as Draft Disadvantaged Communities show that the energy affordability criterion is not a prime driver of DAC classification. For census tracts with energy affordability classifications greater than or equal to six, over 114 (38%) of the tracts are not designated as draft DAC and the population in those census tracts is 327,443.
Average Energy Burden by Census Tract Population Distribution
If the technical support documentation had included the calculation formula, I could have analyzed the possible reasons why some census tracts were designated and why other similar tracts were not. This would be particularly interesting relative to the New York City vs. the rest of the state classifications.
Conclusion
I was hopeful that the LEAD Tool used to generate the CJWG energy affordability indicator would provide enough information to calculate the status of the state relative to the NY REV Energy Affordability Policy target of 6%. Disappointingly the LEAD Tool does not provide the number of individuals so I was unable to calculate the status of the State relative to this metric.
In my comments on the Draft Disadvantaged Community Criteria, I argued that energy affordability should be an environmental justice priority in the future because I expect that energy costs will go up in the future which will affect low- and middle-income residents disproportionally. I recommended that the weighting scheme be changed to put more of an emphasis on that criterion. These results estimate the potential number of people adversely affected because they are excluded from a disadvantaged community. Using a first-order approximation of the distribution of energy affordability relative to the mean I guess that upwards of a million people could be in energy poverty outside of the disadvantaged communities. As far as I can tell those individuals are more likely to reside in rural areas.
The Climate Leadership and Community Protection Act (Climate Act) includes a commitment for environmental justice goals. As part of that effort the Climate Act created the Climate Justice Working Group (CJWG) who has developed a set of draft criteria to determine which communities should be targeted for benefits from Climate Act investments. This post describes the comments I submitted on these criteria.
The Climate Act establishes a “Net Zero” target (85% reduction and 15% offset of emissions) by 2050. I have written extensively on implementation of the Climate Act. Everyone wants to do right by the environment to the extent that efforts will make a positive impact at an affordable level. Based on my analysis of the Climate Act I don’t think that will be the case. I believe that the ambitions for a zero-emissions economy outstrip available renewable technology such that the transition to an electric system relying on wind and solar will do more harm than good. The opinions expressed in this post do not reflect the position of any of my previous employers or any other company I have been associated with, these comments are mine alone.
Climate Act Background
The Climate Action Council is responsible for preparing the Scoping Plan that will “achieve the State’s bold clean energy and climate agenda” in the Climate Act. They were assisted by Advisory Panels who developed and presented strategies to the meet the goals to the Council. Those strategies were used to develop the integration analysis prepared by the New York State Energy Research and Development Authority (NYSERDA) and its consultants that quantified the impact of the strategies. That material was used to write Draft Scoping Plan that was released for public comment at the end of 2021. The Climate Action Council will revise the Draft Scoping Plan based on comments and other expert input in 2022 with the goal to finalize the Scoping Plan by the end of the year.
The Climate Act is “Working to ensure all New Yorkers are represented in the State’s transition to a cleaner energy future and benefit from investments and opportunities provided by this historic transition”. In other words, they are addressing environmental justice. According to EPA: “Environmental justice is the fair treatment and meaningful involvement of all people regardless of race, color, national origin, or income, with respect to the development, implementation, and enforcement of environmental laws, regulations, and policies.”
New York State is undertaking the most ambitious effort in the U.S. to meet the challenge of climate change. New York’s Climate Act recognizes that climate change doesn’t affect all communities equally. The Climate Act charged the Climate Justice Working Group (CJWG) with the development of criteria to identify disadvantaged communities to ensure that frontline and otherwise underserved communities benefit from the state’s historic transition to cleaner, greener sources of energy, reduced pollution and cleaner air, and economic opportunities.
The Climate Act requires the state to invest or direct resources in a manner designed to ensure that disadvantaged communities to receive at least 35 percent, with the goal of 40 percent, of overall benefits of spending on:
Clean energy and energy efficiency programs
Projects or investments in the areas of housing, workforce development, pollution reduction, low-income energy assistance, energy, transportation, and economic development
In order to implement these goals:
The Climate Act created the Climate Justice Working Group (CJWG) which is comprised of representatives from Environmental Justice communities statewide, including three members from New York City communities, three members from rural communities, and three members from urban communities in upstate New York, as well as representatives from the State Departments of Environmental Conservation, Health, Labor, and NYSERDA.
The Climate Justice Working Group has an important advisory role in the Climate Action Council process, providing strategic advice for incorporating the needs of disadvantaged communities in the Scoping Plan. The Working Group will consult with the Environmental Justice Advisory Group and ensure that while we move the state toward a carbon neutral economy, all New Yorkers will reap the economic and environmental benefits of our nation-leading transition.
Disadvantaged Community Criteria
There is a fact sheet that provides an overview of the plan to ensure that Disadvantaged Communities “directly benefit from the State’s historic transition to cleaner, greener sources of energy, reduced pollution and cleaner air, and economic opportunities.” In brief the criteria are based on 45 indicators (e.g. energy poverty or income levels) grouped into seven categories:
Potential pollution exposures
Land use associated with historical discrimination or disinvestment
Potential climate change risks
Income, education, and employment
Race, ethnicity, and language
Health outcomes and sensitivities
Housing, energy, and communications
A scoring system was devised using these indicators to score census tracts throughout New York. The tracts were ranked and 35% of the tracts were designated as “disadvantaged communities”. The CJWG released the draft disadvantaged communities criteria for public comment earlier this year, in addition to an interactive map and a list of disadvantaged communities statewide. A public comment period was set up to solicit feedback. Apparently, the State was concerned about the lack of public involvement so the public comment was extended.
Summary of My Comments
My biggest concern is that I believe that this process over-emphasizes communities and that those people who individually meet the draft Disadvantaged Community (DAC) criteria but happen to live in a community that as a whole does not meet those criteria will be victimized by that accident of geography. This concern might not be an issue because there was some language that suggested that it was being addressed. However, with the emphasis on communities and what I think the immense need for investments to protect those least able to absorb the inevitable energy price increases I believe it is likely that some people who need support won’t be able to get it.
I explained in my comments that I do not disagree that extreme weather impacts are exacerbated by burdens, vulnerabilities, and stressors that differ across individuals and communities statewide such that an emphasis on environmental justice is appropriate. However, I believe that the cost impacts of the ill-conceived emphasis on wind and solar generating resources will have a larger negative impact on disadvantaged communities and individuals than extreme weather. The fact is that development of wind and solar resources have caused energy costs to sky rocket in every other jurisdiction where similar efforts have been attempted. My comments listed four different articles on the day I wrote up my comments that described cost issues in Europe that support my concern.
Unfortunately, the CJWG has bought into the renewable energy approach despite the fact that low- and middle- income residents of the state will be hurt more by the regressive increase in energy costs than the alleged future impacts of climate change. I suggested that an immediate priority of the CJWG should be a demand for the Climate Action Council to develop a feasibility analysis that includes cost projections for rate-payers and explanations of what will be required for the plans outlined in the Draft Scoping Plan.
I also made a recommendation to address the affordability concern. In particular I suggested that the Criteria weighting scheme be adjusted to emphasize unintended policy vulnerabilities. I argued that the housing, mobility, and communications factor indicators should be rated higher so that the communities where energy poverty is an issue will be addressed better. According to the technical documentation “The NY REV Energy Affordability Policy intends to limit energy costs to no more than 6% of income as per the 2016 order from the PSC.” I have been unable to find any documentation that lists the current status of the state for this parameter but I think this is important because I think it is the parameter that is most likely to be negatively affected by the net-zero transition.
I also commented about the documentation. Consistent with the Draft Scoping Plan the documentation provided was incomplete. For example, they provided a spreadsheet with the indicators but did not provide the equations to calculate the numbers. If they had provided the calculation formulas in another version, then I could have checked the weighting methodology for different approaches. They also did not include a list of the indicators that they rejected even though there was sufficient information for use in the analysis. If there was an indicator for wood burning then I would argue that it should be included because wood smoke’s health impacts are as large as any of the indicators used and are likely an issue in rural areas.
This analysis is pretty complicated and I think the approach used is good enough. I might have suggested a couple of tweaks but there wasn’t anything that I thought would make a material difference.
Conclusion
I don’t think that the Climate Action Council is planning to make any meaningful changes to the Draft Scoping Pan. I think there is even less of a chance that the CJWG would modify their criteria based on public input. Nonetheless I made the point that their plan should take into account the inevitable increase in energy costs that is a feature not a flaw in net-zero transition plans. If they were really concerned about the impacts of the Climate Act then the CJWG should demand that the NY REV Energy Affordability Policy include a hard stop to Climate Act implementation if the percentage of households where energy costs are more than 6% of income increases by say 5%.
My impression of this CJWG effort is that members have been trying more to grab as large as much of the pie of Climate Act investment funding than actually trying to minimize the impacts of this effort on those least able to afford higher energy prices. I really worry that the rural poor are going to be short-changed as a result of the Climate Act. This approach does not protect them well enough.
People ask me questions about aspects of the articles I write. I recently described the New York Office of Renewable Energy Siting (ORES) approved Hecate Energy’s permit for the 500-megawatt (MW) Cider Solar Farm. The question that came up asked about the business model of the solar developers. I did some digging and found enough information to eviscerate any claims that solar developers do not get subsidies.
New York’s Climate Leadership and Community Protection Act (Climate Act) Act establishes a “Net Zero” target (85% reduction and 15% offset of emissions) by 2050. I have written extensively on implementation of the Climate Act. Everyone wants to do right by the environment to the extent that efforts will make a positive impact at an affordable level. My analysis of the Climate Act shows that the ambitions for a zero-emissions economy outstrip available renewable technology such that the transition to an electric system relying on wind and solar will do more harm than good. The opinions expressed in this post do not reflect the position of any of my previous employers or any other company I have been associated with, these comments are mine alone.
Climate Act Background
The Climate Action Council is responsible for preparing the Draft Scoping Plan that will “achieve the State’s bold clean energy and climate agenda”. The basis of the document is strategies developed in the integration analysis prepared by the New York State Energy Research and Development Authority (NYSERDA) and its consultants. The Draft Scoping Plan projects total solar resource capacity will be between 41,420 and 43,432 MW in 2040. There is a target for 10,000 MW of distributed solar so for an upper bound assume that utility-scale solar resources of at least 31,420 MW will be needed by 2040.
Solar Subsidies
A reader asked about the subsidies available to solar developers. This article will address direct subsidies that are the ones we usually think of and I will also describe a massive indirect subsidy.
Because sunlight, the fuel source for solar energy, is free, solar energy has steady, predictable power production costs. As the price of other power generation grows, solar energy will help to mitigate overall electricity price increases.
In theory because the solar farm doesn’t need to pay for fuel their generation costs are so low that they should be profitable just getting the market price of the power that they produce. However, there are direct subsidies that are available to solar developers.
New York provides so many incentives that companies that provide financial capital for solar development have web pages devoted to New York. For example, SolRiver Capital is “interested in New York because of its strong state programs and incentives for solar, including remote net energy metering and the NY Megawatt (MW) Block program. In addition, the state has a high volume of direct PPA’s and utility PPA’s with high-quality offtakers.”
SolRiver Capital describes the incentives. Remote net energy metering or RNEM “allows a farm or non-residential utility customer to generate energy in one location to apply against their meter in another location. This enables customers to use solar that would otherwise have a site that’s unsuitable or too small for it.” The New York Megawatt Block program “provides regional incentives for commercial and industrial solar projects (>200kW). The incentive comes in the form of a $/kWh rebate based on the expected system production.” In my opinion these subsidies don’t have much of an effect on consumers.
A Utility Purchase Power Agreement (PPA) is an agreement between a utility and a generator, in which the utility buys power from a solar system that’s interconnected to the utility grid. In addition to buying power, it’s common to see a utility purchase renewable energy credits. New York utilities are required to disclose environmental information on “the types of fuels used to generate electricity, air emissions resulting from generating electricity, and a comparison of those emissions to a statewide average.” If they are not already doing so the electric service providers will be required to provide certain percentages of renewable energy to their customers. In order to track those energy attributes, the state has set up the New York Generation Attribute Tracking System (NYGATS) which is used to track renewable energy credits. In order to meet the mandates, the utilities have to buy the renewable energy credits in a purchase power agreement and those costs are passed on to consumers.
A direct power purchase agreement refers to an agreement between a customer and a generator, in which the customer buys power from an on-site solar system. According to SolCapital “This is a plain-vanilla structure and very common for solar projects”. This is another subsidy that I don’t think has much of an impact on consumer costs.
In addition to those subsidies, developers get Investment Tax Credit for solar developments. Commercial and utility-scale projects which have commenced construction before December 31, 2023 may still qualify for the 26 or 22 percent ITC if they are placed in service before January 1, 2026. NYSERDA provides subsidies that vary by location and by each bidding round. There are non-recourse loans for solar project development cost plus exemption from sales and mortgage taxes and fees plus state mandated payment in lieu of taxes agreements imposed on local governments. I have no idea how much those direct subsidies total but those costs are eventually passed on to consumers.
Indirect Renewable Energy Subsidy
In my opinion, the biggest effect on consumer costs are the indirect costs needed to make renewable energy work. Wind and solar resources and intermittent and diffuse. A reliable electric power system is very complex and must operate within narrow parameters while balancing loads and resources. Obviously, the energy generated from solar facilities is zero when the sun is not shining and zero from wind turbines when the wind is not blowing. In order to provide the energy needed at all times someone has to pay for the storage resources needed when wind and solar resources are unavailable. Because those resources are diffuse the transmission system is necessary. It turns out that wind and solar resources do not support the grid. New York’s conventional rotating machinery such as oil, nuclear, and gas plants as well as hydro generation provide a lot of synchronous support to the system. This includes reactive power (vars), inertia, regulation of the system frequency and the capability to ramping up and down as the load varies. Wind and solar resources are asynchronous and cannot provide this necessary grid ancillary support.
Some, but not all of the disadvantages of solar and wind energy in this regard can be mitigated through electronic and mechanical means. When these renewable resources only make up a small percentage of the generation on the system, it is not a big deal. The system is strong enough that letting a small percentage of the resources that don’t provide those services to lean on the system. But as the penetration of solar and wind energy increases the system robustness will degrade and reliability will be compromised without costly improvements. All of these costs are necessary and none of those costs are supported by the wind and solar developers.
In my Draft Scoping Plan comments on the electric system I estimated the costs for the projected generating capacity described in the Draft Scoping Plan Integration Analysis. I estimated that the mitigation scenarios overnight cost just to develop the resource capacity needed to transition to a zero-emissions electric system in 2040 range from $220 billion to $400 billion. I also found that the costs for energy storage and the zero-carbon firm resource necessary to provide power when there is an extended period of little to no wind and solar resources were more than half the total cost. In other words, wind and solar developers are indirectly subsidized because they do not pay for the resources needed to make the electric grid reliable at all times. That cost appears to be on the order of the cost of the development itself.
Conclusion
There is no question that there are massive subsidies for wind and solar development that will affect the energy costs of all New Yorkers. I believe that at the end of the day affordability will become a major issue in New York just like it has in every other jurisdiction that has attempted a net-zero transition.
In my recent post on the Hecate Energy Cider Solar Farm I expressed my disappointment that the State has abrogated its responsibility to protect prime farmland from solar development. Given all these subsidies it is obvious why a solar developer can out-bid a farmer to rent prime farmland. Until there is a state policy that codifies the Department of Ag and Markets prime farmland protection guidance for solar development, out-of-state developers will come in and plop down solar farms wherever they can outbid farmers for land that is easiest and cheapest for them to build.
resource adequacy and transmission planning design rules for planning the system to meet “extreme weather and other extreme system conditions.” This post provides background information on the disconnect between weather and climate prevalent in most of the electrical planning reports, identifies resource adequacy requirements, and describes the identified problems in the whitepaper
Everyone wants to do right by the environment to the extent that efforts will make a positive impact at an affordable level. I have written extensively on implementation of New York’s Climate Leadership and Community Protection Act (Climate Act) because I believe the ambitions for a zero-emissions economy embodied in the Climate Act outstrip available renewable technology such that it will do more harm than good. This post also addresses the mis-conception of many on the Climate Action Council that an electric system with zero-emissions is without risk. The opinions expressed in this post are based on my extensive meteorological education and background and do not reflect the position of any of my previous employers or any other company I have been associated with, these comments are mine alone.
Weather and Climate
The difference between weather and climate is constantly mistaken by politicians, media, and, as far as I can tell, most electric system planners. According to the National Oceanic and Atmospheric Administration’s National Ocean Service “Weather reflects short-term conditions of the atmosphere while climate is the average daily weather for an extended period of time at a certain location.” The referenced article goes on to explain “Climate is what you expect, weather is what you get.” Also keep in mind that the standard climatological average is 30 years. In order to think about a change in today’s climate averages you really should at least compare the current 30 years against the previous 30 years.
In my experience the common perception that there are observable changes in frequency and intensity of extreme weather events does not withstand close scrutiny. Furthermore, Dr. Cliff Mass has coined the golden rule of climate extremes that says “The more extreme a climate or weather record is, the greater the contribution of natural variability”. I believe that any trends in weather events due to climate change are tweaks not wholesale changes. The best way to evaluate weather trend impacts is to use as long a data set as possible. On the face of it that might seem easy but the reality is that the conditions for a representative trend are difficult to achieve. Ideally you need to use the same instruments, the same methodology, and keep the conditions around the observing location the same. That is almost never the case.
One final point. We are just starting to understand natural variability of ocean temperature and circulations. Many people have heard of the El Niño and La Niña weather patterns. El Niño and La Niña are two opposing weather patterns that make up the El Niño-Southern Oscillation (ENSO) cycle. El Niño and La Niña regimes typically last nine to 12 months, but can sometimes last for up to seven years on average. Over longer periods, the Atlantic Multi-decadal Oscillation (AMO) has been “identified as a coherent mode of natural sea surface temperature variability occurring in the North Atlantic Ocean with an estimated period of 60-80 years”. In the Northern Pacific the Pacific Decadal Oscillation (PDO) is a similar sea surface temperature source of decadal natural variability. These patterns and oscillations all affect our weather but it is not clear exactly how, especially when the combined effects are considered. If we cannot explain how these naturally variable systems affect our weather then it is unlikely that the climate change weather event perturbation imposed by the greenhouse effect can be described.
Resource Adequacy Modeling for a High Renewable Future
The National Regulatory Research Institute (NRRI) report “Resource Adequacy Modeling for a High Renewable Future“ gives an excellent overview of electric resource adequacy planning as performed today and describes what they think will be needed in the future. I did a post on this report that can be used to provide more detailed background information on resource planning standards.
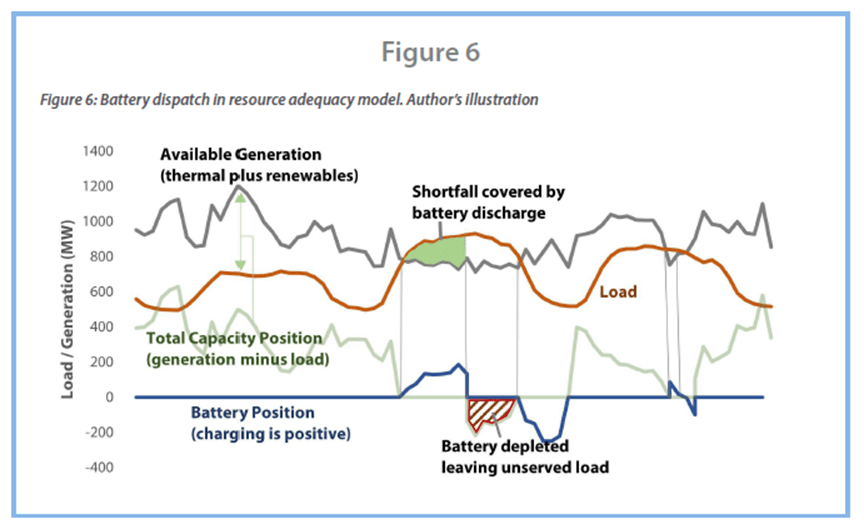
In this article I am only going mention the resource adequacy metrics described in the article. The report describes traditional resource adequacy planning:
Electric utilities have used the resource planning process for decades to develop long-term, least-cost generation supply plans to serve expected customer demand. Resource adequacy planning ensures that a system has enough energy generation throughout the year to serve demand with an acceptably low chance of shortfalls. Resource adequacy is measured by the metrics described in Figure 1. Reliability metrics provide an indication of the probability of a shortfall of generation to meet load (LOLP), the frequency of shortfalls (LOLE and LOLH), and the severity of the shortfalls (EUE and MW Short).
The industry has traditionally framed resource adequacy in terms of procuring enough resources (primarily generation) to meet the seasonal peak load forecast, plus some contingency reserves to address generation and transmission failures and/or derates in the system. This approach and the metric used to define it is called the “reserve margin.” Planners establish a reserve margin target based on load forecast uncertainty and the probability of generation outages. Required reserve margins vary by system and jurisdiction, but planners frequently target a reserve margin of 15 percent to 18 percent to maintain resource adequacy.
New York resource planning analyses use the “one day in ten years,” criteria (LOLE), meaning that load does not exceed supply more than 24 hours in a 10-year period, or its equivalent metric of 2.4 hours loss of load hours (LOLH) per year. This analysis is performed at the “balancing authority” (BA) level. In the past New York BAs were vertically integrated utilities with defined service territories. After deregulation this responsibility passed to the state’s independent system operator (ISO). The region covered now includes many utility service territories. More importantly the New York Independent System Operator (NYISO) has to develop market or compliance-based rules to maintain sufficient system capacity which adds another layer of complexity. The NYISO does their resource adequacy planning using resources within its geographic region or have firm transmission deliverability into the New York Control Area (NYCA). There is another complication in the state. New York City has limited transmission connectivity so there are specific reliability requirements for the amount of in-city generation that has to be operating and other rules to prevent blackouts in the City.
The NRRI report concludes:
The electric grid is transitioning quickly from a system of large, dispatchable generators to a system reliant on high levels of variable renewable energy, energy storage, and bi-directional flow. Against this backdrop, analytical tools used for decision making regarding resource adequacy are more important than ever and those tools need to evolve to meet the modern grid challenges outlined in this paper. Models based in realistic weather-driven simulations more accurately capture the risk of load shedding due to inadequate generation. Simulations derived from historical data ensure models include load and generation patterns as well as correlations among resources and the ability to adjust to future climate conditions. Models that do not account for these factors may lead to decisions that underinvest in resources or invest in the wrong resources. Recent events in California and Texas indicate the importance of getting these projections right to keep the grid reliable.
To model resource adequacy in future power systems with high penetration of renewables, we recommend several enhancements in modeling tools and techniques. Modeling tools should simulate key structural variables and allow for validation of the simulations by benchmarking against the historical data used to create the simulations. While maintaining statistical properties derived from historical data, simulations should also include future expectations of load growth along with changes in seasonal and daily load shapes. Generation-forced outage simulations should include the possibility of correlated outages from extreme weather. Finally, climate change will drive more weather events in the power system and this risk should be accounted for in the models, at least in the form of sensitivity cases or stress tests.
New York State Reliability Council
In addition to the NYISO the New York State Reliability Council has reliability planning mandates. According to their webpage:
The New York State Reliability Council, L.L.C. (“NYSRC”) is a not-for-profit entity, organized as a Delaware limited liability company, whose mission is to promote and preserve the reliability of electric service on the New York State Power System by developing, maintaining, and, from time-to-time, updating the Reliability Rules which shall be complied with by the New York Independent System Operator (“NYISO”) and all entities engaging in electric transmission, ancillary services, energy and power transactions on the New York State Power System. The NYSRC shall carry out its mission with no intent to advantage or disadvantage any Market Participant’s commercial interests.
The NYSRC’s mission also includes monitoring compliance with the Reliability Rules by working in consultation with the NYISO to assure compliance, including when necessary, seeking compliance through the dispute resolution procedure contained in the ISO/NYSRC Agreement, and taking such other actions which may be necessary to carry out the purpose of the NYSRC Agreement.
Extreme Conditions Whitepaper
New York’s Climate Act mandates that the state’s electric system is supposed to be 100% zero emissions by 2040. The authors of the Climate Act envisioned that this transition would use new wind and solar resources without any new nuclear generation. The NYSRC Extreme Conditions Whitepaper reflects the need to address the issues raised in the NRRI report:
A NYSRC 2022 goal for the NYSRC Reliability Rules Subcommittee (RRS) to: “identify actions to preserve NYCA reliability for extreme weather events and other extreme system conditions” and its corresponding action plan to: “evaluate the potential need for new resource adequacy and transmission planning design rules for planning the system to meet extreme weather and other extreme system conditions.” Accordingly, this paper presents Extreme Weather Resilience Plan recommendations which are designed to ensure that the NYS electric system continues to deliver reliable performance in the face of a changing climate.
Two extreme system conditions were explicitly considered: extreme weather events and loss of natural gas supply. Extreme weather events are considered low-probability widespread weather events
or climate conditions occurring within a limited period, with the potential of having a very severe impact on the reliability of the bulk power system. The majority of loss of natural gas supply to generating facilitates are due to operational or scheduling or market deficiency issues. Natural gas pipeline failures account for a relatively minor fraction of loss of gas supply events. I am only going to address the extreme weather aspects in this article.
The section on extreme weather events starts:
Climate change has led to an increase in the frequency and intensity of extreme weather events, raising concerns about the resilience of the electric grid and its ability to successfully address such hazards.
As explained above I don’t subscribe to the increase in the frequency and intensity claim. This sentence includes a reference to an Oak Ridge National Laboratory report “Extreme Weather and Climate Vulnerabilities of the Electric Grid: A Summary of Environmental Sensitivity Quantification Methods” that provides more details on the weather events that cause blackouts. It also repeats the claim that extreme weather is changing due to climate change. It is almost as if they think that they don’t need to document the claim because “everybody” knows it is the case.
The Whitepaper goes on to say:
All components of electricity supply and demand are potentially vulnerable to such events, including electric power generation and transmission. Further, the changing resource mix with higher penetrations of solar and wind generation adds to the vulnerability of the system to extreme weather. Extreme weather events, such as prolonged cold and hot weather spells, wind lulls, hurricanes and storms, are considered one of the main causes of wide area electrical disturbances worldwide. In the United States, 96% percent of power outages in 2020 were caused by severe weather or natural disasters.
The whitepaper lists the types of extreme weather that impact the NYCA.
The whitepaper explains an important consideration:
It should be noted that extreme weather events, by their nature, infrequent but have a large impact on system reliability such as widespread blackouts. This is in contrast to normal or design events such as generator or transmission outage events. Normal events are predictable in a probabilistic sense in terms of, for example, expected forced outage rates for generators, and generally do not result in wide-spread blackouts. In terms of a statistical frequency distribution, normal events occur around the mean of the distribution while extreme weather events occur at the tails of the distribution. This means that a different form of analysis, reliability criteria, and system loading condition may be appropriate for extreme weather events when compared to normal events.
The whitepaper concludes its discussion on the need for new planning rules by looking at recent blackouts in California and Texas:
The risk profiles in Table 2 below depict the reliability impacts of recent extreme weather events in California and Texas10. As a way of comparison, unserved energy or EUE resulting from the California event exceeded the average annual expected unserved energy in the NYSRC 2021 and 2022 IRM Study base cases by a factor of 12, while the unserved energy from the Texas event exceeded these IRM study base case EUEs by a factor of 4400!
The report explains that the NYISO has conducted a “wind lull” study as part of its 2021 Reliability Planning Process to determine the effects of an extreme situation of low wind resource availability. The study evaluated several scenarios for which there is no wind generation output for an extended period of time, i.e., one week. According to the report:
Table 3 below shows the results of one of these scenarios.12 In this scenario each base case LOL event resulted in a loss of energy of 857 MWhr compared to 1,276 MWhr for the wind lull scenario. The NYISO study also calculated the compensatory MW (perfect capacity MW available every hour of the study year) required to bring NYCA back to the LOLE criterion for each of 18 scenarios examined. For these scenarios compensatory MW requirements ranged from 0 to 400 MW in Zones J or K.
One important NYISO lull study conclusion was that using compensatory MW to bring the NYCA LOLE back to criterion level increases the Expected Unserved Energy (EUE) metric over the base case level. This is because non-extreme weather events are mitigated by the compensatory MW, but the wind lull events themselves create a larger energy deficit than in the base case during the week of the extreme weather.
Resource Adequacy Modeling for a High Renewable Future
Based on these analyses the report concludes that there are changes to weather impacts that need to be addressed and new reliability rules need to be developed. In my opinion, the most important weather concern is that changing the resource mix to one relying upon weather-dependent wind and solar generation is the critical vulnerability that has to be addressed. As noted above I think that the trend of extreme weather events due to greenhouse gas concentrations in the atmosphere is much smaller than natural variability. Therefore, using a long record of data for evaluation will cover most of the potential variability. Unfortunately, recent major blackouts due to extreme weather in California and Texas suggest that we haven’t even been able to plan for the past. So far, New York has avoided such a blackout either due to more stringent standards and better policy development or luck. When New York’s resource mix changes due to the Climate Act there is a need for new reliability rules to maintain current levels of reliability.
Whitepaper Recommendations
In order to address the future electric grid requirements, the NYSRC Reliability Rules Subcommittee (RRS) recommends that:
Accordingly, RRS recommends that the NYSRC should adopt an “extreme weather resource adequacy criterion” — such as the 1-in-10-year LOLE criterion or a new criterion (One example of a new criterion could be use of a dual LOLE/EUE criterion) – for mitigating loss of load impacts of extreme weather events. Development of an “extreme weather resource adequacy criterion” shall include the use of the results of probabilistic resource adequacy assessments of the reliability impacts of a range of types of extreme weather events, to be conducted by the NYISO staff.
RRS recognizes that the NYISO and ICS will need adequate time to develop more detailed probabilistic models for extreme weather analyses and that the RRS will need sufficient time to develop and adopt an appropriate extreme weather resource adequacy criterion. Included in these modeling efforts the NYISO and ICS should identify the types of extreme weather events to be considered and modeled, including an estimate of the relative likelihood of occurrence. The NYISO staff and ICS should also discuss and coordinate the development of procedures for using appropriate extreme natural event assumptions and data for NYCA resource adequacy and IRM assessments.
Prior to adopting an extreme weather resource adequacy criterion, RRS recommends that initial rules should be adopted requiring the NYISO to periodically conduct probabilistic resource adequacy assessments of the reliability impacts (LOLE, LOLH, and EUE metrics) of a range of types of extreme weather events similar to the “Wind Lull” analysis reported in Appendix E of the NYISO 2021-30 CRP report. In addition, it is recommended that the NYISO develop extreme weather scenarios based on appropriate system conditions as well as analytical methods with which to test system performance under extreme weather events. These initial assessments should utilize existing NYISO extreme weather probabilistic models which should improve over the near term.
Conclusion
I endorse the recommendations for additional extreme weather criteria proposed in the Whitepaper. However, based on my background in meteorology, I believe that natural weather variability is a much bigger driver of the magnitude of extreme weather events than climate change. As a result, the necessary changes to reliability rules should focus on the observed variability of extreme weather more than any projection of future changes due to climate change. To date no one in the state has done a satisfactory job evaluating observed weather event variability using a sufficiently long data record. In my Draft Scoping Plan comments on renewable energy resource availability I explained that there is a viable approach that could robustly quantify the worst-case renewable energy resources and provide the information necessary for adequate planning.
The New York Office of Renewable Energy Siting (ORES) approved Hecate Energy’s permit for the 500-megawatt (MW) Cider Solar Farm on July 25, 2022. Because this is the first permit issued by ORES for a project that’s application was initially filed with the new state office under the Section 94-c rules it is worth a look. If this is any indication of how the State is going to permit all projects going forward I don’t think it will be in the best interests of the State.
New York’s Climate Leadership and Community Protection Act (Climate Act) Act establishes a “Net Zero” target (85% reduction and 15% offset of emissions) by 2050. I have written extensively on implementation of the Climate Act. Everyone wants to do right by the environment to the extent that efforts will make a positive impact at an affordable level. My analysis of the Climate Act shows that the ambitions for a zero-emissions economy outstrip available renewable technology such that the transition to an electric system relying on wind and solar will do more harm than good. The opinions expressed in this post do not reflect the position of any of my previous employers or any other company I have been associated with, these comments are mine alone.
New York Permitting Requirements
New York’s Article Ten process defines the permitting requirements for all large-scale electric generating new construction or expansion. It includes extensive and time-consuming public notification and public participation requirements. The 2011 revisions to the Article Ten law were intended to speed things up but were largely ineffective in that regard. In early April 2020, NYS passed the Accelerated Renewable Energy Growth and Community Benefit Act (AREGCBA) as part of the 2020-21 state budget. The legislation was intended to ensure that renewable generation is sited in a timely and cost-effective manner.
AREGCBA established the Office of Renewable Energy Siting (ORES) which is housed within the Department of State. It will “consolidate the environmental review of major renewable energy facilities and provide a single forum to ensure that siting decisions are predictable, responsible, and delivered in a timely manner along with opportunities for input from local communities”. All large-scale, renewable energy projects 25 megawatts or larger will be required to obtain a siting permit from the Office of Renewable Energy Siting for new construction or expansion. However, during the transition developers can decide to finish their Article Ten permit application rather than convert to the new program. The AREGCBA application requirements are intended to primarily speed the process up but there is a provision that makes the opportunity for input from local communities a sham. In particular, ORES can find any local zoning code to be “unreasonably burdensome in view of CLCPA targets and the environmental benefits of the Facility” and simply over-ride the requirement. The very first permitting decision over-rode a local noise ordinance.
New York Solar Development Background
I became aware of the particular issues of utility-scale solar development on agriculture after I had a couple of people contact my blog describing issues that they had and suggested that I look into the issue. The problems that they raised are real, the solutions are available, but in the rush to develop as many renewable resources as quickly as possible the State of New York has dropped the ball on responsible utility-scale solar development. Given the massive amount of projected utility-scale solar generation capacity required to meet Climate Act goals the rush to develop solar projects could easily lead to the permanent loss of significant amounts of prime farmland that will hurt farming communities and endanger Climate Act strategies to sequester carbon in soil.
In my opinion if you are going to develop solar on the scale necessary, then there should be a plan for responsible siting. There is a policy option roadmap for the proposed 10 GW of distributed solar development. However, there is not an equivalent set of policies for utility-scale solar development. Given the magnitude of the potential impacts to prime farmland I submitted a comment to the Climate Action Council recommending that they impose a moratorium on the development of utility-scale solar projects until permitting requirements have been established for responsible solar siting and protection of prime farmlands. Not surprisingly there has been no response.
I described a workshop “What’s the Deal with Renewable Energy & Agriculture?” co-hosted by New Yorkers for Clean Power (NYCP) and Alliance for Clean Energy NY (ACENY) that discussed the compatibility of solar energy development and agriculture in New York State. In my opinion, all the speakers were advocating responsible solar development that minimizes the use of the best agricultural farmland soils. Whatever your position is with respect to the industrial solar development that to me is a key requirement. If a project meets all the New York State Department of Agriculture and Markets (Ag and Markets) guidelines and the ORES requirements then, given the current state law mandating massive buildouts of solar energy, the application should be approved.
There are Ag and Markets guidelines that have been described in prepared testimony by Michael Saviola from the Department of Agriculture and Markets that I believe represent best practices and should be mandatory going forward. In particular, “The Department’s goal is for projects to limit the conversion of agricultural areas within the Project Areas, to no more than 10% of soils classified by the Department’s NYS Agricultural Land Classification mineral soil groups 1-4, generally Prime Farmland soils, which represent the State’s most productive farmland.” In a post on the Garnet Energy Center, I explained that the permit decision for that facility will be a litmus test to see if the State is going to protect farming communities. The Saviola testimony clearly demonstrates that the proposed project is inappropriate because “the facility will result in or contribute to a significant and adverse disproportionate agricultural impact upon the local farming community”. Unfortunately, a nearby similar solar project was approved despite the fact that the Ag and Markets testimony noted that for the Trelina Solar Project “The Department estimates that greater than 68% of the of the limits of disturbance includes the conversion of farmland classified as Prime Farmland Soil” which clearly exceeds the Department goal.
Solar developers are quick to point out that a landowner gets revenue when a solar project is developed. However, when land is taken out of production it will reduce farm jobs and the economic activity may be improved during construction but once the facility is operational there are very few economic benefits to essential local businesses. Furthermore, taking the land out of production may make other farmers who have been renting that land to make their operations viable will not be able to support the investments they have made in facilities, livestock, or equipment.
Hecate Energy Cider Solar
According to the website summary the Cider Solar Farm will be a 500-megawatt photovoltaic solar facility capable of supplying 920,000 MWh (21% capacity factor). It will use photovoltaic panels on tracking structures that follow the sun throughout the day to optimize power production. It will be located in the towns of Elba and East Oakfield, Genesee County, NY. For those unfamiliar with the area, it is pretty flat, fertile and great for farming. Unfortunately it is also good for cheap solar development.
The Project components will be located on a Project Site of approximately 4,650 acres, comprised of 67 parcels of leased private land owned by 31 land holding entities. The total Project Footprint is approximately 2,452 acres, which includes both temporary and permanent disturbance and comprises the limit of disturbance (LOD).
The proposed Solar Facility will directly contribute significantly to New York State’s Climate Leadership and Community Protection Act (CLCPA) targets by producing up to 500 MW of emissions-free, low-cost, renewable solar energy to New York’s energy market. The Facility will produce enough zero-emissions energy to power more than 125,000 homes in NYS. The Facility will also create job opportunities, support economic growth, and protect the public health, safety and environment by significantly reducing greenhouse gas emissions. Without limitation, the Facility will result in a reduction of over 400,000 tons of greenhouse gas emissions in New York State (DMM Item No. 35, Exhibit 2 Overview and Public Involvement, September 3, 2021, at 2).
It all sounds wonderful but the more you read the more issues come up. The fact is that ORES can just do whatever it wants despite the concerns of the locals:
Executive Law § 94-c(5)(e) provides that a Siting Permit may only be issued if the Office makes a finding that the proposed Facility, together with any applicable Uniform Standards and Conditions, Site Specific Conditions, and compliance filings set forth in the Permit would comply with applicable laws and regulations. In making this determination, the Office may elect not to apply, in whole or in part, any local law or ordinance which would otherwise be applicable if it makes a finding that, as applied to the proposed Facility, it is unreasonably burdensome in view of the CLCPA targets and the environmental benefits of the proposed Facility.
In compliance with Executive Law § 94-c(5)(e), the Office has considered, without limitation, the proposed Facility’s contribution of up to 500 MW toward New York State’s CLCPA targets, and the environmental benefits of producing enough zero-emissions energy to power more than 125,000 homes in New York State and reduce greenhouse gas emissions by at least 400,000 tons in the State.
The Permittee has requested that the Office elect not to apply the following provisions of local law or ordinance. The Office hereby determines not to apply, in whole or in part, the following local law or ordinance provisions, which when applied to the proposed Facility, are unreasonably burdensome in view of the CLCPA targets and the environmental benefits of the proposed Facility. In making the determinations herein, the Office has balanced the proposed Facility’s competing impacts to multiple resources, and considered the Permittee’s proposed measures to avoid, minimize or mitigate those impacts to the maximum extent practicable, while ensuring protection of the environment and consideration pertinent social, economic and environmental factors.
Bottom line is that ORES over-ruled the Towns of Elba and Oakfield zoning ordinances that were“unreasonably burdensome” for the developer. A quick skim through the response to comments reveals a similar attitude to dismiss any local issues and concerns. For example, in response to a question about the impact of the project on property values the response was:
While § 94-c of the Executive Law does not require consideration of impacts on adjacent or nearby property values, it does require the Permittee to identify the relevant area of environmental concern and propose measures to avoid, minimize, or mitigate to the maximum extent practicable, potential significant adverse environmental impacts of the Facility.
Agricultural Resources
Exhibit 15: Agricultural Resources describes the zoning, farmland classifications, and infrastructure in the area, maps of the resources, and plans for agriculture, remediation, and co-utilization. It defines three study areas in the Glossary of Terms. The “Project Area” refers to the Project Site and surrounding/adjacent land totaling approximately 7,518 acres. The “Project Footprint” refers to the limit of temporary and permanent disturbance within the Project Site caused by the construction and operation of all components of the Project totaling approximately 2,452 acres. The “Project Site” refers to those privately owned parcels under option to lease, purchase, easement or other real property interests with the Applicant in which all project components will be sited totaling approximately 4,650 acres.
Exhibit 15 includes an assessment of agricultural land use within five miles of the Project Site. In the discussion of the lands within certified NYS agricultural districts the text states: “The Project Area includes a total of approximately 7,845 acres, while the Project Site includes approximately 4,650 acres, and the Project Footprint is comprised of approximately 2,452 acres.” Note that the Project Area in the Glossary (7,518) and in this paragraph are not the same.
The section in this exhibit titled “Farmland Classification Mapping” lists landcover class data.
According to NLCD data, the dominant landcover class in the Project Site is active agriculture, followed by forestland. Agricultural lands in the Project Site are comprised of active agricultural land (both row crops and mowed/maintained hayfields) and there are numerous family and commercial farms and farm structures in the Project Site. Row crops comprise approximately 68% (3,143 acres) of the Project Site, and less than 1% (23 acres) of the total Project Site is maintained hayfields. Additionally, there is approximately 3.5% (161 acres) of the Project Site where the dominant land cover is grasslands or pasturelands.
Relative to agricultural soils, the Project Site includes approximately 41% (1,912 acres) of land classified as Prime Farmland, 27% (1,252 acres) as Prime Farmland if Drained, 19% (891 acres) as Farmland of Statewide Importance, and 13% (596 acres) as Not Prime Farmland (Natural Cooperative Soil Survey 2020). A map of the existing farmland classifications within the broader Project Area is included as Figure 15-3: Prime Farmlands and Drainage Features. A discussion of how the Project will avoid or minimize impacts to agricultural production areas and the effects the Project has on use of the land for future farming operations is included in Section (b)(3) of this Exhibit.
There is another section “Active Agricultural Businesses and Related Infrastructure” that describes local farming. It notes that the “Project Site is located within Genesee County Agricultural District #2 and includes approximately 3,166 acres (68%) of land designated as actively farmed.” There are 11 farms within the Project Site and six non-participating farms within the Project Area but not within the Project Site.
The “Potential Construction Impacts and Methods to Facilitate Farming During Construction” section gets to the core of my concern:
Potential impacts to agricultural land during construction will occur primarily from equipment movement and the installation of Project components including solar panels, mounting posts, inverters, access roads, buried electrical collection lines, temporary construction laydown areas and the substation. Most of these impacts will displace farming practices on agricultural lands during the operational life of the Project, while some construction activities will only create temporary disturbances to farming activities.
Although the solar panels and maintained areas, i.e., those areas within the fenceline not covered by panels or another project component, will cover approximately 2,178.9 acres total and 2,159 acres of active agricultural land, only 0.9 acres of permanent ground disturbance will occur for the installation of racking systems and associated steel posts. The Project’s racking system will be pile-driven to minimize subsurface ground disturbance. Areas under panel arrays would be taken out of agricultural production during the operational life of the Project, estimated to be a maximum of 30 years. Once Project construction has been completed, a native seed mixture will be used as ground cover to enable soil recovery, replenish soil nutrients and mitigate soil erosion. The Project will avoid using pesticides and herbicides, to the extent practicable,1 and surface grading will be limited to the minimal amount necessary to accommodate panel areas, access road and substation areas. A total of 2,159 acres of land will be removed from agricultural use during the operational life of the project. However, once decommissioned, agricultural land sited within the Project Footprint will be restored and able to return to its prior land use condition.
In my opinion this text removes any doubt that State policy is renewable energy is the priority over agriculture. Recall that the Department of Ag and Markets goal is for projects “to limit the conversion of agricultural areas within the Project Areas, to no more than 10% of soils classified by the Department’s NYS Agricultural Land Classification mineral soil groups 1-4, generally Prime Farmland soils, which represent the State’s most productive farmland.” The text does not present their numbers so that an easy comparison can be made. The 4,650 acre Project Site is 41% Prime Farmland (1,912 acres) and another 27% (1,252 acres) would be Prime Farmland if drained. The Ag and Markets goal is for the Project Area but no soil classification data are presented for that category. The text admits that the solar panels and maintained areas of this project “will cover approximately 2,178.9 acres total and 2,159 acres of active agricultural land”. It stands to reason farmers would actively cultivate Prime Farmland. In that case the project is converting 88% of the Prime Farmland in the Project Site to solar panels and maintained areas. There is no scenario where this project meets the Ag and Markets goal.
Discussion
There is plenty of land that could be used for solar farms that is not actively farmed prime farmland. The New York State Department of Environmental Conservation Forests website states that forests cover 18.6 million acres of the state’s 30.2 million acres. The New York Farm Bureau says that according to the United States Department of Agriculture 2017 Ag Census, there were 33,438 farms in New York State and 6,866,171 acres in production. The following table is a summary of data in the Farmland Class of Soil Map Units in New York.
Obviously, there is a desperate need for a development plan or there will be impacts on the viability of New York’s agriculture industry. The question that the State has to answer is how much farmland can be converted to solar sprawl without impacting the agricultural sector. Exhibit 15 argued that this is not permanent conversion but Department of Ag and Markets testimony has argued, correctly in my opinion, that when the panels reach their end of useful life they will be replaced with a new set of panels. ORES apparently does not consider the Department of Ag and Markets solar siting goal on prime farmland a requirement and recent Article Ten proceedings have also ignored it.
I have been following a number of solar projects and the project areas can be used to derive a first-order approximation of future land area needed as shown in the following table. The project footprint using these numbers is 5.25 acres per MW. At the current rate 67% of those acres are prime farmland.
The cumulative effects are the primary concern. Exhibit 15 includes an assessment of other local renewable projects within five miles of this project:
Based upon a review of the New York State Department of Public Service and ORES websites, as if the time of this Application, there are three proposed renewable energy facilities located in Genesee County and neighboring Orleans County. These include the 280-MW Excelsior Energy Center in the Town of Byron located approximately two (2) miles east; the 200-MW Orleans Solar Project in the towns of Barre and Shelby located approximately three (3) miles northwest; and the 200-MW Heritage Wind Project in the Town of Barre located approximately one and a half (1.5) miles north.
Based on the first order approximations from the previous table another 2,520 acres will be converted to glass, copper and steel solar sprawl and we will lose another 1,680 acres of prime farmland. Eleven farms sold out to Hecate Energy for the Cider Solar project so we can expect to lose another ten for the two other solar projects. How many customers can the local suppliers of farm materials and equipment afford to lose before they go out of business?
The Draft Scoping Plan had three scenarios for future solar resource development. The total solar resources projected were between 41,420 and 43,432 MW in 2040. There is a target for 10,000 MW of distributed solar so for an upper bound assume that utility-scale solar resources of at least 31,420 MW will be needed by 2040. That equates to solar sprawl covering 164,961 acres and the loss of a large number of farmers.
Conclusion
It was difficult for me to write this post because I was so upset at the blatant disregard for agricultural issues evident in the decision to permit this facility. There is plenty of land available that is not on prime farmland that can be used for solar development. Until there is a state policy that codifies the Department of Ag and Markets guidance for solar development, out-of-state developers will come in and plop down these facilities where it is easiest and cheapest for them to build. It would be even better for the State to develop a siting policy that incorporates that guidance and other factors so that development is as effective as possible. I have little faith that the Climate Action Council will address this these needs
There are two glaring deficiencies in the implementation process for New York’s Climate Leadership and Community Protection Act (Climate Act): lack of detail about the costs to implement the transition to net zero and disregarding the experiences of other jurisdictions. This post summarizes the current situation of the European plan to meet the same target as New York. The Global Warming Policy Foundation just released a report entitled Europe’s Green Experiment – A Costly Failure in Unilateral Climate Policy. I believe the Climate Action Council should explain how New York’s plan could possibly avoid the issues identified in this report in their Final Scoping Plan.
Everyone wants to do right by the environment to the extent that efforts will make a positive impact at an affordable level. I have written extensively on implementation of New York’s Climate Act because I believe the ambitions for a zero-emissions economy embodied in the Climate Act outstrip available renewable technology such that it will do more harm than good. The opinions expressed in this post are based on my extensive meteorological education and background and do not reflect the position of any of my previous employers or any other company I have been associated with, these comments are mine alone.
Climate Act Background
The Climate Act establishes a “Net Zero” target (85% reduction and 15% offset of emissions) by 2050. The Climate Action Council is responsible for preparing the Scoping Plan that will “achieve the State’s bold clean energy and climate agenda”. They were assisted by Advisory Panels who developed and presented strategies to the meet the goals to the Council. Those strategies were used to develop the integration analysis prepared by the New York State Energy Research and Development Authority (NYSERDA) and its consultants that quantified the impact of the strategies. That material was used to write Draft Scoping Plan that was released for public comment at the end of 2021. The Climate Action Council will revise the Draft Scoping Plan based on comments and other expert input in 2022 with the goal to finalize the Scoping Plan by the end of the year.
In section 16 of the Climate Act § 75-0103 there is a mandate to consider efforts at other jurisdictions: “The council shall identify existing climate change mitigation and adaptation efforts at the federal, state, and local levels and may make recommendations regarding how such policies may improve the state’s efforts.” There has been very little discussion of efforts at other jurisdictions. The few times other jurisdictions were discussed it was mostly related to calls for greater aspirational goals. The remainder of this article describes why I believe the European experience should be considered by the Climate Action Council.
Europe’s Green Experiment
John Constable wrote the new report describing the economic impact of European green policies. The European Climate Law:
…..raises the EU’s 2030 emissions reduction target to at least 55% from 40% and makes climate neutrality by 2050 legally binding. The Climate Law is part of the European Green Deal, the EU’s roadmap towards climate neutrality. To reach its climate goal, the European Union has come up with an ambitious package of legislation known as “Fit for 55 in 2030. It comprises 13 interlinked revised laws and six proposed laws on climate and energy.
Constable writes:
These policies were built on a long-standing interest in renewable energy flows, stretching back into the 1930s but first prominent in response to the oil shocks of the 1970s. After 1990, this interest crystallised as demanding targets for levels of renewable energy in final energy consumption, starting in earnest in 2009, and the Emissions Trading Scheme, which began in 2005. These policy instruments were supported by a concerted and extensive program of public communications and supplementary environmental regulation, such as the Large Combustion Plant Directive of 2001, and its successor the Industrial Emissions Directive of 2016, both intended to address industrial release of harmful substances.
This general environmental effort has been tremendous, but the results are still poorly understood by the public upon whom the experiment has been performed. A host of pertinent questions hang in the air unanswered:
Have the EU member states reduced their emissions?
Have they reduced them in a cost-effective manner?
Are the policies setting an economically compelling example to other countries?
Has a self-supporting and internationally competitive green economy emerged in Europe?
Is Europe a leading developer of low carbon technologies?
How much has the green experiment cost?
Have there been any unintended consequences?
Can it continue?
What has been learned?
The report contains 14 sections that are all relevant to New York’s plans:
The Emissions Trading Scheme
Growth in renewable energy
Conventional electricity generation
Renewable heat and cooling
Renewable transport fuel
Total renewable energy progress
Costs and benefits
Energy efficiency
Energy prices in the EU
Energy production, consumption and productivity
Emissions in the EU
Green jobs and other jobs
Has the EU learned from its experiment?
The energy transition illusion and the future of European prosperity
I recommend that anyone interested in potential issues with New York’s plans read the report. I am only going to summarize a few of the findings listed in the summary.
The section on the European Union Emissions Trading Scheme is relevant because the Climate Action Council has setup a subgroup to consider a carbon pricing scheme for New York. The report notes that:
The Phase 3 of the European Union Emissions Trading Scheme (EU ETS) ran from 2013–2021 has added €78 billion to consumer costs in the bloc, with the annual cost now amounting to about €17 billion. In 2020, EU member states paid €1.2 billion of ETS revenue to electro-intensive industries to compensate them for cost increases caused by the ETS itself in 2019. This amounts to about 12% of total ETS costs in that year and is clear evidence that the ETS has a detrimental effect on competitiveness. Germany paid €546 million, some 17% of its ETS revenue.
I see no reason to expect that similar costs to consumers will also occur if New York sets up a similar scheme.
The summary description of electricity, gas and transport fuel prices should be a cautionary tale. It is impossible to compare the Draft Scoping Plan cost projections with the results observed because there is insufficient detail in the Draft Scoping Plan. The report compares European Union (EU) energy costs to the world’s largest economies in the G20. It found that in the period 2008 to 2018:
Electricity prices to households in the EU have been 80% above those in the G20. Electricity prices to industries in the EU have been about 30% above those in the G20. Gas prices to households in the EU have been approximately double those in the G20. Gas prices to industries in the EU have been between 20% and 30% above those in the G20. Diesel prices in the EU have been approximately 10% to 40% above those in the G20. Petrol prices in the EU have been approximately 30% to 50% above those in the G20. The EU’s underlying wholesale prices for electricity and gas were similar to those in the G20, and for both petrol and diesel the EU’s wholesale prices were below those in the G20, both indicating that the EU’s higher energy prices are due to policy.
I believe that the results shown for conventional generation capacity and system load factor will be replicated in New York. The summary states:
In the period 1990–2020, total EU electricity generation capacity has nearly doubled due to growth in renewables, while thermal capacity, which remains essential to system stability, has declined sharply due to regulation and lack of investment signals. Electricity industry productivity has fallen because the enlarged generation fleet serves a smaller demand. In 1990 the EU’s generation fleet load factor was approximately 56%, but by 2020 this has fallen to 37%.
In a recent post on the carbon pricing subgroup I noted that New York’s investments in emissions abatement costs have been very high so far. The report notes:
Carbon dioxide abatement costs in the EU are on average several times greater than even high-end estimates of the social cost of carbon ($100/tCO2e), indicating that the economic harm of the EU’s mitigation policies is greater than is the climate change it aims to prevent.
One of the big claims in the Draft Scoping Plan is that the transition plan will provide jobs. However, the results in Europe suggest that may not work out as proposed. The summary of green industrial growth explains that:
Employment in the European wind and solar industries has contracted sharply since 2008, with the Spanish industry falling from over 200,000 jobs in 2008 to under 50,000 in 2021, and the German industry halving from over 60,000 to under 30,000 full-time equivalent jobs. Despite a small absolute increase in employment, the EU’s share of global renewables industry employment has fallen from 20% in 2012 to 13% in 2021, and the bloc has substantial presence only in those areas of low-carbon technology, such as biomass, where there is little international competition. Subsidised deployment in Europe has failed to give European industries a secure position in the world markets for renewable energy equipment. The field is now dominated by China.
Conclusion
Constable concludes: “In spite of the overwhelmingly negative results from Europe’s green experiment 1990 to 2021, the EU Commission appears to have learned nothing; it has announced still more ambitious targets for low-carbon energy, and has even promised to reduce energy consumption still further, in spite of the obvious dangers.” He suggests that “policy correction is inevitable but entails significant reductions in European standards of living”. I agree with him that this will be the case in New York.
The Climate Action Council should explain to the residents of New York why their plan will not result in the problems that have been observed in Europe. If they cannot do that then this ideological experiment should be put on hold until they can prove otherwise.
In the process of preparing an article about the New York State Reliability Council (NYSRC) Executive Committee approval of the Extreme Conditions Whitepaper on July 8, 2022, I found a reference to a very nice report Resource Adequacy Modeling for a High Renewable Future. The report provides important background information necessary to understand the NYSRC whitepaper so my first thought was to include a summary of the report in the NYSRC post. It made the article too long so this post focuses exclusively on the background paper.
Everyone wants to do right by the environment to the extent that efforts will make a positive impact at an affordable level. I have written extensively on implementation of New York’s Climate Leadership and Community Protection Act (Climate Act) because I believe the ambitions for a zero-emissions economy embodied in the Climate Act outstrip available renewable technology such that it will do more harm than good. This post also addresses the mis-conception of many on the Climate Action Council that an electric system with zero-emissions is without risk. The opinions expressed in this post are based on my extensive meteorological education and background and do not reflect the position of any of my previous employers or any other company I have been associated with, these comments are mine alone.
Resource Adequacy Modeling for a High Renewable Future
The National Regulatory Research Institute (NRRI) is the research arm of the National
Association of Regulatory Utility Commissioners (NARUC). NRRI provides research, training, and technical support to State Public Utility Commissions. The June 2022 report “Resource Adequacy Modeling for a High Renewable Future “gives an excellent overview of electric resource adequacy planning as performed today and describes what they think will be needed in the future.
Traditional Resource Adequacy Planning
The report describes traditional resource adequacy planning:
Electric utilities have used the resource planning process for decades to develop long-term, least-cost generation supply plans to serve expected customer demand. Resource adequacy planning ensures that a system has enough energy generation throughout the year to serve demand with an acceptably low chance of shortfalls. Resource adequacy is measured by the metrics described in Figure 1. Reliability metrics provide an indication of the probability of a shortfall of generation to meet load (LOLP), the frequency of shortfalls (LOLE and LOLH), and the severity of the shortfalls (EUE and MW Short).
The industry has traditionally framed resource adequacy in terms of procuring enough resources (primarily generation) to meet the seasonal peak load forecast, plus some contingency reserves to address generation and transmission failures and/or derates in the system. This approach and the metric used to define it is called the “reserve margin.” Planners establish a reserve margin target based on load forecast uncertainty and the probability of generation outages. Required reserve margins vary by system and jurisdiction, but planners frequently target a reserve margin of 15 percent to 18 percent to maintain resource adequacy. Figure 2 shows the standard conceptualization of a load duration curve, rank ordering the level of a power system’s load for each hour of the year from highest to lowest on an average or median basis in a typical weather year. The installed reserve margin is a margin of safety to cover higher than expected load and/or unexpected losses in generation capacity due to outages.
Pechman, C. Whither the FERC, National Regulatory Research Institute. January 2021, available at http://pubs.naruc.org/ pub/46E267C1-155D-0A36-3108-22A019AB30F6.
New York resource planning analyses use the “one day in ten years,” criteria (LOLE), meaning that load does not exceed supply more than 24 hours in a 10-year period, or its equivalent metric of 2.4 hours loss of load hours (LOLH) per year. This analysis is performed at the “balancing authority” (BA) level. In the past New York BAs were vertically integrated utilities with defined service territories. After deregulation this responsibility passed to the state’s independent system operator (ISO). The region covered now includes many utility service territories. More importantly the New York Independent System Operator (NYISO) has to develop market or compliance-based rules to maintain sufficient system capacity which adds another layer of complexity. BA’s typically conduct resource adequacy analysis based on their own load and resources. The NYISO does their resource adequacy planning using resources within its geographic region or have firm transmission deliverability into the New York Control Area (NYCA). There is another complication in the state. New York City has limited transmission connectivity so there are specific reliability requirements for the amount of in-city generation that has to be operating and other rules to prevent blackouts.
The report goes on to note:
The standard metrics shown in Figure 1are generally reported as mean values of simulated power system outcomes over a range of potential future states, but planners also need to understand and plan for the worst-case outcomes and associated probability of such outcomes. Figure 3shows the mean and percentile values for loss of load hours for a power system over a three-year period.
In Figure 3,on average, the power system is resource adequate, remaining below the target of 2.4 hours per year. However, if the power system planner were more risk averse, she might want to bring a higher percentile line under the 2.4-hour target. She would need to add more firm capacity, adding to customer cost. The 95th percentile is the worst-case outcome, providing additional information on the upper bound risk of outages for a given portfolio. Only power systems with no recourse to import energy in a shortage, such as an island, would consider planning to the 95th percentile due to its high cost.
The report’s traditional planning section concludes with this:
Resource adequacy planning is fundamentally concerned with low probability events and planning for average outcomes; although a common practice, this planning is not sufficient and increasingly risky with more uncertain supply, such as renewables. In the past, planners only needed to worry about unusually high loads or high forced outages. Now, they must worry about unusually high loads during periods of unusually low renewable output and limited storage duration. Adding supply uncertainty and, as we discuss later, more extreme weather, compounds risks and thus requires a fundamental rethinking of planning for low probability, high impact tail events.
Problems with Traditional Resource Planning with a High-Renewable System
Despite the fact that the NYISO and the consultants for the Integration Analysis that provides the framework for the Climate Act Draft Scoping Plan have identified a serious resource adequacy problem, there are vocal members of the Climate Action Council who claim there are no reliability concerns for the future 100% zero-emissions New York electric grid. However, analyses have shown otherwise. E3 in their presentation to the Power Generation Advisory Panel on September 16, 2020 noted that firm capacity is needed to meet multi-day periods of low wind and solar output. The NYISO Climate Change Phase II Study also noted that those wind lull period would be problematic in the future.
The NRRI report opens the discussion of the new problems that have to be addressed:
With weather emerging as a fundamental driver of power system conditions, planning for resource adequacy with high renewables and storage becomes an exercise in quantifying and managing increasing uncertainty on both the supply and demand side of the equation. On the load side, building electrification, electric vehicle adoption, and expected growth in customer-sited solar and storage are likely to have pronounced effects on future electric consumption. Uncertain load growth and changing daily consumption patterns increase the challenge of making sure that future resources can serve load around the clock. Simply modeling future load based on past load with added noise does not characterize uncertainty from demand side changes.
The report goes on to explain that supply-side changes create a need for new modeling approaches. In particular, the traditional system consists mostly of dispatchable resources that operators can control as necessary to keep the generation matched with the load. In the future the system will be comprised mostly of resources with limited or no dispatchability. Table 1 compares past approaches with current needs. Note that weather impacts need to be “Incorporated as a structural variable driving system demand, renewable generation, and available thermal capacity”.
There is another fundamental change. In the past the resource adequacy modeling could use average annual generation profiles to meet expected loads. In the future, there will have to be: “multiple renewable generation simulations using historical generation and weather data”. The modeling scenarios will need to meet future expected resource development and maintain the correlation
between renewable availability and load. In particular, the highest and lowest temperatures and thus the expected high loads are typically associated with large high-pressure systems that have low wind speeds and thus low wind resource availability.
The NRRI report shows an approach that addresses these concerns in Figure 5. The report notes:
Weather, primarily in the form of temperature, but potentially including insolation, humidity, wind speed, etc., drives simulations of renewable generation and customer load. Generation outage simulations can be modeled as random (the traditional approach) or as correlated with extreme heat or cold events. Once the simulations are in place, models can compute multiple future paths on an hour-by-hour basis to determine when load cannot be fully served with the available resources. For every hour of the model time horizon, there are independent simulations of load, renewables, and forced outages to determine if load shedding must occur. If a particular model contains 100 simulations and four show a lack of resources to serve load for a particular hour, the hour in question would have a loss of load probability of 0.04 (4/100).
In my opinion, the weather drivers have to be carefully considered. In my Comment on Renewable Energy Resource Availability on the Draft Scoping Plan, I explained why an accurate and detailed evaluation of renewable energy resource availability is crucial to determine the generation and energy storage requirements of the future New York electrical system. I showed that there is a viable approach using over 70 years of data that could robustly quantify the worst-case renewable energy resources and provide the information necessary for adequate planning.
The problem however is what will be the worst case? The NRRI report brings up the issue of energy storage:
Energy storage presents a unique challenge in resource adequacy models. Unlike traditional resources, storage devices such as batteries, compressed air, or pumped-hydro act as both load and generation depending on whether they are charging or discharging. Modern resource adequacy models need to simulate this behavior when determining the capability of energy storage to serve load during periods of resource scarcity. What state of charge should we expect for energy storage at times when the storage is truly needed? Are batteries likely to be fully charged at 6:00 PM on a weekday in August? What about grid charging versus closed systems where batteries must charge from a renewable resource? At the high end of renewable penetration, how much storage would be required to cover Dunkelflaute, the “dark doldrums,” that occur in the winter when wind ceases to blow for several days. Questions surrounding the effective load-carrying capability of energy storage significantly increase the complexity in modeling resource adequacy.
The worst-case meteorology has to consider the energy storage resource. The worst-case may not be the lowest amount of wind and solar resources over a few days. Instead, it could be an extended period of conditions that prevent battery re-charging. I suspect that the long-term historical records will be used to identify potential problems and then a set of scenarios based on different meteorological regimes will be developed that can be used to address the questions raised in the previous paragraph.
The NRRI report explains how this might work:
Figure 6 provides an illustration of modeling the use of batteries in resource adequacy. The figure shows battery storage in blue, load in orange, and the available thermal generation in grey. When load exceeds thermal generation, the system is forced to rely on battery discharge for capacity. If the event lasts long enough to fully discharge the battery, the green line (generation minus load) will turn negative, indicating a load shed event.
The report goes on to explain how the modeling analysis is done. It notes that:
Simulations of random variables fit Monte Carlo methods by creating multiple future time series of the random variables, while maintaining correlation across time within variables (if wind is high in hour 1, it will likely be high in hour 2) and correlations between the variables, such as the strong relationship between temperature and load. If wind tends to be higher in the spring and fall, the simulations will exhibit that trend. Monte Carlo applications differ dramatically between resource adequacy models, with some models using a sequential approach that solves the model in hourly steps whereas others use techniques that solve the models quickly without stepping through each hour. Accurate representation of energy storage in resource adequacy models necessitates sequential solution techniques to account for the time dependencies for storage state of charge inherent in models.
I believe it is necessary to use the worst-case meteorological scenarios as the primary driver of these simulations. In other words, the Monte Carlo weather parameter adjustments should be small increments on top of the observed values. The report is talking primarily about correlations in time but spatial correlations are a critical wind resource availability consideration too.
The NRRI report addresses my concerns.
When using the Monte Carlo approach with weather as a fundamental driver, individual simulations represent independent futures for weather, load, and renewables. Realistic simulations maintain the statistical properties of the underlying resource and correlation between resources and load. For example, if historic data show no correlation between load and wind generation, the simulations should maintain this relationship unless a reasonable expectation exists for correlations to change in the future
However, they use simple examples of the load and resource correlations. There are those that believe that because the wind is always blowing somewhere that transmission upgrades will ensure reliability. However, if during the worst-case conditions New York has to rely on wind resources in Iowa because the high-pressure system is huge, that may not be practical. I cannot over-emphasize the need for an analysis that simulates wind and solar resource availability over wide areas. As the report notes analyses that fail to replicate the proper correlation between wind, solar, and load for the electric grid can underestimate the risk of load shedding.
The report goes on to explain other adjustments to traditional resource planning that will be necessary to address a high renewable future. That discussion is beyond the scope of my concern. The report concludes:
The electric grid is transitioning quickly from a system of large, dispatchable generators to a system reliant on high levels of variable renewable energy, energy storage, and bi-directional flow. Against this backdrop, analytical tools used for decision making regarding resource adequacy are more important than ever and those tools need to evolve to meet the modern grid challenges outlined in this paper. Models based in realistic weather-driven simulations more accurately capture the risk of load shedding due to inadequate generation. Simulations derived from historical data ensure models include load and generation patterns as well as correlations among resources and the ability to adjust to future climate conditions. Models that do not account for these factors may lead to decisions that underinvest in resources or invest in the wrong resources. Recent events in California and Texas indicate the importance of getting these projections right to keep the grid reliable.
To model resource adequacy in future power systems with high penetration of renewables, we recommend several enhancements in modeling tools and techniques. Modeling tools should simulate key structural variables and allow for validation of the simulations by benchmarking against the historical data used to create the simulations. While maintaining statistical properties derived from historical data, simulations should also include future expectations of load growth along with changes in seasonal and daily load shapes. Generation-forced outage simulations should include the possibility of correlated outages from extreme weather. Finally, climate change will drive more weather events in the power system and this risk should be accounted for in the models, at least in the form of sensitivity cases or stress tests.
Conclusion
I found this report to be a very useful description of the particulars of electric grid reliability analysis now and in the future. It is clear that the transition to a high renewable future introduces issues that could cause problems.
Finally, this report and other similar studies always claim that climate change should be considered in future analyses. As I will explain in my future article on the NYSRC Extreme Conditions Whitepaper I believe that the most important future weather concern is that changing the resource mix to one relying upon weather-dependent wind and solar generation is the critical vulnerability that has to be addressed. I think that the trend of extreme weather events due to greenhouse gas concentrations in the atmosphere is much smaller than natural variability. Therefore, using a long record of data for evaluation will cover most of the potential future variability. Unfortunately, recent major blackouts due to extreme weather suggest that we haven’t even been able to plan for the past. So far New York has avoided such a blackout either due to more stringent standards and better policy development or luck.