Late last year the editor of the Green Car Journal contacted me after he came across my Pragmatic Environmental Principles while doing research on pragmatic environmentalism. He said that he realized we share similar ideas and asked if I would like to share my perspective on GreenCarJournal.com. This post provides documentation for my perspective.
Everyone wants to do right by the environment to the extent that they can afford to and not be unduly burdened by the effects of environmental policies. Pragmatic environmentalism is necessary to balance environmental impacts and public policy. This means that evidence-based environmental risks and benefits (both environmental and otherwise) of issues need to be considered. The opinions expressed in this post do not reflect the position of any of my previous employers or any other company I have been associated with, these comments are mine alone.
What Happened to Bridge Technology?
This section provides context and documentation to the quoted sections in the article.
I usurped the concept of a bridge fuel to describe the need of technology that provides demonstrable air quality and CO2 reductions while a “zero-emissions” technology is developed.
Not so long ago, it was generally accepted that plug-in hybrid electric vehicles (PHEVs) and compressed natural gas (CNG) vehicles could be used as bridge technologies until ‘zero-emissions’ vehicles could perform like existing vehicles, at similar cost. Unfortunately, politics in New York and elsewhere demand net-zero by 2050 with policies that preclude their use.
I have spent a lot of time the last three years evaluating New York’s net-zero by 2050 target mandated by the Climate Leadership and Community Protection Act (Climate Act) from a pragmatic point of view. Pragmatic environmentalism is all about balancing the risks and benefits of both sides of issues. Most troubling in the quest for net zero is the lack of consideration for tradeoffs.
I recently wrote that the Climate Act and the transition plan embodied in the Draft Scoping Plan is full of examples where the perceived risks of fossil fuels are comprehensively addressed but none of the risks of the proposed alternatives are addressed. The most glaring Climate Act example is the requirement that the full life cycle and upstream emissions associated with fossil fuels must be considered. The same consideration of the life-cycle issues with battery electric or hydrogen fuel-cell vehicles is not considered.
In New York the mandated technology is ‘zero-emissions,’ either battery electric or hydrogen fuel cells. PHEV and CNG vehicles have direct emissions and so will be banned. The Climate Act fossil fuel accounting requirements inflate the global warming effects as compared to all other jurisdictions and mandate that upstream and life-cycle emissions also be considered. On the other hand, the life-cycle emissions and impacts of the ‘zero-emissions’ technologies are ignored.
I submitted Climate Act Draft Scoping Plan comments on the electric vehicle transition schedule. The analysis presumes an unprecedented adoption rate for light-duty electric vehicles. The biggest problem in the analysis is that the device costs for zero-emissions charging technology and the vehicles themselves is presumed to decrease significantly over time. Home EV chargers and battery electric vehicles both are claimed to go down 18% between 2020 and 2030. The overall cost decreases are so large that the total costs for the zero-emissions vehicles adoption is cheaper than using existing technology which I believe is a major reason that they think the transition will be so fast to a technology that is so inconvenient.
The Climate Act’s net-zero by 2050 transition is extraordinarily ambitious. The Scoping Plan that outlines the framework to implement this transition projects that in order to meet the net-zero schedule, over 30 percent of all light-duty vehicles sold will either be battery-electric vehicles (BEVs) or hydrogen fuel cell vehicles (HFCVs) in 2025, and 100 percent by 2035. For medium- and heavy-duty truck sales, the Scoping Plan projects that at least 10 percent sold will either be BEVs or FCEVs in 2025, and 64 percent by 2035.
It’s wishful thinking to presume that large percentages of people will choose BEVs and HFCVs, forgoing the flexibility of a personal car that has much greater range in all seasons, can be refueled quickly on long trips, and does not require expensive charging equipment at home. PHEV technology eliminates range anxiety, refueling, and home equipment concerns. It also reduces fuel use and air pollution emissions significantly and uses a smaller battery pack than a BEV, which reduces the environmental impacts of rare earth mineral supplies and disposal that the Climate Act ignores.
There are two options in the Climate Act Scoping Plan for personal transportation: hydrogen fuel cells and battery electric vehicles. Hydrogen fuel cell vehicles have two overcome two technological hurdles: the fuel cells themselves and providing the hydrogen necessary as fuel. I have never bothered to research the feasibility of fuel cells because I think that a hydrogen economy is a fantasy. There so many obvious issues with battery electric vehicles that just thinking that the State presumes that they can all be overcome because they say so, makes me ill.
When all the physical, cost, and logistical issues associated with hydrogen use are considered, it will not play a major role in the future. BEV technology doesn’t appeal to a majority of car owners because of nuisance constraints, but the technology could work. The same cannot be said for battery electric heavy-duty vehicles since range, refueling, and charging infrastructure constraints are deal breakers that prevent heavy-duty trucks from meeting the 2050 net-zero target.
While there is no question that reduced levels of air pollution have benefits, I believe that there are thresholds to those impacts where further reductions have little beneficial value. Nonetheless, air quality health benefits are touted as one of the primary benefits of the net-zero transition, especially related to disadvantaged communities. One example of those impacts is related to the Hunts Point Food Distribution Center in South Bronx, New York that is the largest food distribution center in the country. Diesel exhaust emissions are primarily inhalable particulates that are targeted as a primary air pollution health factor so eliminating diesel truck emissions is an activist priority. Compressed natural gas trucks greatly reduce particulate emissions and lower the pollutants that create ozone. However, instead of advocating for the CNG technology that has proven to work in heavy duty trucks, the activists want to use zero-emissions technology that might work sometime in the future.
There are serious inhalable particulate air pollution issues associated with diesel truck emissions at freight terminals in New York City. The Scoping Plan claims that replacing these trucks with zero-emission alternatives provides significant benefits. However, the plan’s zero-emissions aspirations ignore technological tradeoffs and the reality that CNG heavy-duty trucks are a viable alternative that would markedly reduce inhalable particulate emissions. The problem with CNG is not technology since we know it works, but a problem with the development of fueling infrastructure and vehicle fleet turnover. It is not pragmatic to insist that heavy-duty trucks use unproven battery electric technology over other alternatives that can markedly reduce the air quality issues.
The pragmatic response is obvious.
The use of PHEV and CNG vehicles for personal and freight transport offers the opportunity for significant air quality benefits, at a cheaper societal cost, with less impacts on personal choice, and sooner than the ‘zero-emissions’ alternatives. Failing to consider those benefits while insisting upon a riskier technological approach is not good social policy. Someday, there may be a better alternative, but in the meantime bridge technologies that provide most of the benefits are the more appropriate policy approach.
Conclusion
In the transportation sector, there are two choices: technology that gets significant emission reductions with the associated benefits, at a lower cost, has fewer implementation downsides, and has proven results or technology that has limitations in every respect but has “zero-emissions” if it can be deployed someday. From a pragmatic standpoint the rational approach is use what makes an improvement, continue research and development for “zero-emissions” technology, and deploy that only when we know it will work as advertised. Unfortunately, that option has been pulled off the table. A friend describes the situation well: these morons are apparently fully at ease with the equivalent of jumping out of a perfectly good airplane without an upgraded parachute assuming that an even better parachute will be developed, proven technically and economically feasible and delivered to the imbecile that jumped out of the airplane in time to provide a soft landing.
On December 28, 2022, the New York State Energy Research & Development Authority (NYSERDA) and the New York State Department of Public Service (DPS) filed New York’s 6 GW Energy Storage Roadmap to the Public Service Commission (PSC) for consideration. This post gives an overview of the roadmap and an initial assessment of the cost assessment methodology.
Everyone wants to do right by the environment to the extent that they can afford to and not be unduly burdened by the effects of environmental policies. I submitted comments on the Climate Act implementation plan and have written over 250 articles about New York’s net-zero transition because I believe the ambitions for a zero-emissions economy embodied in the Climate Act outstrip available renewable technology such that the net-zero transition will do more harm than good. The opinions expressed in this post do not reflect the position of any of my previous employers or any other company I have been associated with, these comments are mine alone.
In 2019, New York passed the nation-leading Climate Leadership and Community Protection Act (Climate Act), which codified some of the most aggressive energy and climate goals in the country.
6,000 MW of Solar by 2025
70% Renewable Energy by 2030
9,000 MW of Offshore Wind by 2035
100% Carbon-free Electricity by 2040
85% Reduction in GHG Emissions from 1990 levels by 2050
3,000 MW of Energy Storage by 2030, further increased to 6,000 MW of Energy Storage by 2030 by Governor Kathy Hochul
Energy storage will play a crucial role in meeting our State’s ambitious goals. Storage will help to integrate clean energy into the grid, reduce costs associated with meeting peak electric demands, and increase efficiency. Additionally, energy storage can stabilize supply during peak electric usage and help keep critical systems online during an outage.
The Roadmap proposes a comprehensive set of recommendations to expand New York’s energy storage programs to cost-effectively unlock the rapid growth of renewable energy across the State and bolster grid reliability and customer resilience. If approved, the Roadmap will support a buildout of storage deployments estimated to reduce projected future statewide electric system costs by nearly $2 billion, in addition to further benefits in the form of improved public health as a result of reduced exposure to harmful fossil fuel pollutants.
The Roadmap proposes the implementation of NYSERDA-led programs towards procuring an additional 4.7 GW of new storage projects across the bulk (large-scale), retail (community, commercial and industrial), and residential energy storage sectors in New York State. These future procurements, combined with the existing energy storage already under contract with the State and moving towards commercial operation, will allow the State to achieve the 6 GW goal by 2030.
Keep in mind that New York’s net-zero by 2050 plan is and always has been a political initiative developed by a small group and foisted upon the state by the emotion-driven innumerates of the New York Legislature. Accordingly, the release of the Energy Storage roadmap warranted a press release from the Governor:
Governor Kathy Hochul today announced a new framework for the State to achieve a nation-leading six gigawatts of energy storage by 2030, which represents at least 20 percent of the peak electricity load of New York State. The roadmap, submitted by the New York State Energy Research and Development Authority and the New York State Department of Public Service to the Public Service Commission for consideration, proposes a comprehensive set of recommendations to expand New York’s energy storage programs to cost-effectively unlock the rapid growth of renewable energy across the state and bolster grid reliability and customer resilience. If approved, the roadmap will support a buildout of storage deployments estimated to reduce projected future statewide electric system costs by nearly $2 billion, in addition to further benefits in the form of improved public health because of reduced exposure to harmful fossil fuel pollutants. Today’s announcement supports the Climate Leadership and Community Protection Act goals to generate 70 percent of the state’s electricity from renewable sources by 2030 and 100 percent zero-emission electricity by 2040.
One phrase in this paragraph is the reason I wrote this post. It says “the roadmap will support a buildout of storage deployments estimated to reduce projected future statewide electric system costs by nearly $2 billion”. I will show that what it really means is that we think we can claim that the costs will be nearly $2 billion dollars less than the astronomical total cost that we don’t admit to the public because it won’t reflect well on the narrative of the state’s Climate Act.
Chapter 3: Role of Storage Targets
New York’s 6 GW Energy Storage Roadmap (Roadmap) explains that “energy storage has the potential to play a critical role in supporting a deeply decarbonized New York electricity grid, through its ability to integrate large quantities of variable renewable energy and provide reliable capacity to meet growing peak demand”.
The document describes the role of energy storage. Note that the emphasis is on short-term storage for intra-day requirements for the 6 GW by 2030 target.
Figure 5 illustrates the role of energy storage in shifting generation to meet load, based on Roadmap analysis of the New York electricity system under portfolios consistent with the Climate Act. On days with excess solar, the modeled battery storage system charges from excess solar power concentrated in the middle of the day. Battery storage then helps the system to maintain reliability in events when load is high, and overnight when wind generation is low. Alternately, on low renewable output days, storage can charge from other resources, including imports, and reduce the need for more expensive firm resources.
Figure 5. Energy Value: Storage Dispatch in Modeled Analysis of the New York Electric System in 2040
The Roadmap document claims that it is appropriate to increase the energy storage deployment target of 3 GW by 2030 to 6 GW. It states:
The analysis performed for this Roadmap (see Section A.1 in Appendix A) estimates that deployment of 6 GW of storage by 2030 will yield an estimated $1.94 billion (net present value) in net societal benefits to New York, due to increased delivery of renewable energy and reduced reliance on other more expensive firm capacity resources. These benefits reflect the value of avoided electricity system expenditures. Further societal benefits, not quantified here, would include improved air quality in communities impacted by fossil generation.
Furthermore, the analysis highlights the opportunity to leverage federal incentives to build out most of the expected 2040 storage deployments earlier, given that these credits could phase down as early as 2032. This Roadmap analysis finds that nearly all the 12 GW of storage chosen in the modeling is deployed by 2035, to meet system needs and maximize cost-effectiveness by capturing the federal Investment Tax Credit. Figure 6 illustrates these analytical findings, indicating that the projected 2040 quantity of 12 GW could be fully deployed as early as 2035 in order to maximize this opportunity. This context underscores the importance of an increased 2030 target of 6 GW in order to position New York to pursue such an accelerated opportunity.
Figure 6. Statewide Battery Storage Capacity Targets and Storage Deployment to Meet System Needs
Appendix A Storage Capacity Expansion Analysis
Appendix A documents the analysis conducted for the Roadmap. It turns out that the analysis is basically the 2022 updated Integration Analysis for the revisions to the Scoping Plan. The Appendix summarizes the approach but often refers to the Appendix G Scoping Plan documentation for specifics. My experience with that reference information is that it is not nearly as comprehensive as implied by this document.
NYSERDA relies on Energy and Environmental Economics (E3) for the modeling analyses that provide the basis for the Roadmap. E3 has a capacity expansion model, RESOLVE, and loss of load probability model, RECAP. RESOLVE “optimizes long-term generation and transmission investments subject to reliability, technical, and policy constraints.” RECAP performs “loss-of-load probability simulations to determine the reliability of resource portfolios and the contribution from each resource within it.” The models “develop least-cost electricity generation portfolios that achieved New York’s Climate Act goals with the new 6 GW storage by 2030 target and meet New York’s long term energy needs.” However, note that these models simplify the New York generating system so they do not do as good a job projecting the future system as the New York Independent System Operator (NYISO) models.
The E3 modeling for the Integration Analysis was used to estimate loads and costs starting in 2020. That means that it is possible to check the model predictions against observations. The Roadmap states: “Current costs are about 10% higher than those assumed in the 2018 Storage Roadmap and about 40% higher than that assumed in the 2021 Integration Analysis”. In my opinion a 40% difference in cost over a few years does not lend any credibility to costs out to 2050.
The Roadmap notes reasons for the energy storage cost projection differences:
Over the past year, supply chain constraints, material price increases, and increased competition for battery cells have driven up the cost of energy storage technologies, particularly lithium-ion batteries. Many of the drivers of cost increases are expected to persist until at least 2025. These cost increases may impact the cost of any new programs designed to procure storage to be installed by 2030. In addition to cost increases, difficulties in the timely completion of interconnection processes, high interconnection costs, and downward pressure on capacity revenue create a challenging environment through the development and operational lifecycle of a storage project. Financial support will therefore be crucial for the state to achieve the 3 GW and 6 GW deployment goals.
One of my major concerns with the Scoping Plan projections was the overly optimistic projections of energy cost reductions which I believe were used to claim lower costs of the net-zero transition. Despite the failure to project current costs in the 2021 Integration Analysis, the Roadmap doubles down saying that “Cost declines are assumed to begin in 2025 as manufacturing capacity expands, and benefits of scale and innovation are realized”. The document does not explain why the concerns noted above are going to turn around so quickly or, for that matter, why given global competition for the same rare earth metals necessary for the energy storage won’t see those conditions persist for many years.
Appendix B: Storage Program Cost Analysis
This Appendix “summarizes the inputs, assumptions, and analysis methodology underpinning the estimates of incremental program costs associated with achieving the proposed 2030 target of 6 GW of short-duration storage”. The Roadmap states:
The total cost of these proposed procurement programs is estimated at between $1.0 billion and $1.7 billion. This equates to an estimated increase in customer electric bills of 0.32% – 0.54% (or $0.34 – $0.58 per month for the average residential customer) on average across New York for the 22-year period during which these programs would make payments to awarded projects. The range of these projections reflects future uncertainties, most notably those associated with energy and capacity prices.
The way this is written it suggests that the energy storage costs will be manageable because it will only be at most $0.58 per month. However, Appendix B states:
For the proposed bulk storage procurement program, program costs are calculated as the incremental revenue, on top of revenue that storage assets can realize through commercial operation in the existing energy markets, that would allow such assets to reach their cost of capital. This methodology is broadly consistent with that applied to cost studies under the Clean Energy Standard.66 Key assumptions and inputs include the costs of storage projects, the estimates of market revenue available to them, available federal incentives and the cost of capital.
This approach is disingenuous at best. They are not providing all the program costs only the costs above what they think an energy storage owner will have above the expected “incremental” revenue. That incremental revenue has to be paid by someone and that someone is the ratepayers of the state. As I understand it the “incremental revenues” are composed of at least the subsidies that are being proposed for energy storage that are like renewable energy credits. Those subsidies are not paid for in the NYISO’s wholesale energy market but are buried in utility rate cases. Moreover, it is not clear if the Roadmap includes energy storage specific wholesale energy market payments as other “incremental” revenue. In any event, the insinuation that the energy storage cost is only going to be “between $1.0 billion and $1.7 billion” is clearly misleading and inaccurate.
Conclusion
There is a lot to unpack in the Roadmap and I will follow up with future posts. Even at first glance there are issues. Not only does the study rely on the poorly documented Integration Analysis as its basis but it also replicates its shell game con for hiding the true costs. In the Scoping Plan costs are compared to a Reference Case that includes already “incremented programs” and in this Roadmap costs are presented relative to “incremental revenues”. In both instances the result is a deceptive cost estimate that does not include all the costs for the citizens of New York.
It gets worse. The continued increase in subsidized resources in the NYISO’s wholesale energy market will on average suppress market prices which will result in the need for larger subsidies to make renewable developments viable. Gresham’s Law of Green Energy is named after Sir Thomas Gresham, a 16th-century British financier who observed that “bad money drives out the good.”. In this context subsidized renewable resources will drive out competitive generators, lead to higher electric prices, reduce economic growth, and likely lead to the need to subsidize competitive generators who provide critical resources but are no longer viable. Finally, keep in mind that almost all project development costs are funded through NYSERDA non-recourse loans. In open capital markets that is the most expensive money there is to finance.
The Roadmap claims “the roadmap will support a buildout of storage deployments estimated to reduce projected future statewide electric system costs by nearly $2 billion”. The only reductions are relative to very high projected costs. It appears that the Hochul Administration goal is hide the expenditure of hundreds of billions of dollars under hundreds of programs and subsidies making it intentionally impossible to capture the total costs to consumers. The true “Total Cost” of the Climate Act will be hidden forever from the public by design.
Everyone wants to do right by the environment to the extent that they can afford to and not be unduly burdened by the effects of environmental policies. I submitted comments on the Climate Act implementation plan and have written over 250 articles about New York’s net-zero transition because I believe the ambitions for a zero-emissions economy embodied in the Climate Act outstrip available renewable technology such that the net-zero transition will do more harm than good. The opinions expressed in this post do not reflect the position of any of my previous employers or any other company I have been associated with, these comments are mine alone.
Climate Act Background
The Climate Act established a “Net Zero” target (85% reduction and 15% offset of emissions) by 2050. The Climate Action Council is responsible for preparing the Scoping Plan that outlines how to “achieve the State’s bold clean energy and climate agenda.” In brief, that plan is to electrify everything possible and power the electric gride with zero-emissions generating resources by 2040. The Integration Analysis prepared by the New York State Energy Research and Development Authority (NYSERDA) and its consultants quantifies the impact of the electrification strategies. That material was used to write a Draft Scoping Plan that was released for public comment at the end of 2021 and approved on December 19, 2022.
Children’s Stories
I believe that two children’s fables illustrate the false presumptions of the Climate Act. According to Wikipedia, the Pied Piper of Hamelin is a Middle Ages tale from the town of Hamelin, Germany. The pied piper, dressed in multicolored (“pied”) clothing, was a rat catcher hired by the town to lure rats away with his magic pipe. When the citizens refuse to pay for this service as promised, he retaliated by using his instrument’s magical power on their children, leading them away as he had the rats. The phrase “pied piper” has become a metaphor for a person who attracts a following through charisma or false promises. The other fable is the Emperor’s New Clothes. This Danish fairy tale written by Hans Christian Andersen was first published in 1837. In this story, swindlers convince the emperor, who spends lavishly on clothing at the expense of state matters, that they can provide magnificent clothes that are invisible to those who are stupid or incompetent. The emperor and his court don’t see any clothes but pretend otherwise to avoid being thought a fool. When the emperor marches through the city to show off his new clothes the townsfolk uncomfortably go along with the pretense, not wanting to appear inept or stupid, until a child blurts out that the emperor is wearing nothing at all. The people then realize that everyone has been fooled. The phrase “The Emperor Has No Clothes” is often used in political and social
contexts for any obvious truth denied by the majority despite the evidence of their eyes, especially when proclaimed by the government.
The Pied Pipers of the Climate Act
The statement of Robert W. Howarth, Ph.D., the David R. Atkinson Professor of Ecology & Environmental Biology at Cornell University was very illuminating relative to the motives of the Climate Act authors. He reiterated his claim that he played a key role in the drafting of the Climate Act, developed the irrational methane requirements, and credited one politician for getting the Act passed:
Assembly Person Steven Englebright was hugely instrumental in the passage of the Climate Leadership & Community Protection Act that established the Climate Action Council. I thank him for his leadership on this, and particularly for his support of the progressive approach on greenhouse gas emissions that is a central part of the CLCPA. I originally proposed this to Assembly Person Englebright in 2016, and he enthusiastically endorsed and supported it through multiple versions of the bill that finally led to passage of the CLCPA in 2019. In this accounting for greenhouse gases, a major government for the first time ever fully endorsed the science demonstrating that methane emissions are a major contributor to global climate change and disruption. Further, in passing the CLCPA New York recognized that consumption of fossil fuels (and not simply geographic boundaries) is what matters in addressing the climate crisis. New York wisely banned the use of high-volume hydraulic fracturing (“fracking”) to develop shale gas in our State. But since the time of that ban, the use of fossil natural gas has risen faster in our State than any other in the Union. Methane emissions from this use of shale gas are high, but much of that occurs outside of our boundaries in the nearby states of Pennsylvania, West Virginia, and Ohio. Through the CLCPA, the citizens of New York are taking responsibility for these out-of-state emission caused by our use of fossil fuels, particularly for fossil natural gas. The way to reduce these emissions is to rapidly reduce our use of fracked shale gas.
Based on the work of David Zaruk I recently wrote an article describing his analysis of the motives of people like Englebright and Howarth who insist on reducing their perceived priority risks to zero. One of Zaruk’s articles explained that the use of definite articles is “abused by activists needing definite truths to win policy debates on complex problems.” Dr. Howarth’s monomaniacal vilification of natural gas is well described by that statement. During the discussions at the Climate Action Council meetings, he constantly referred to the science and his background as a scientist. Zaruk writes:
In declaring: “This is the science on XYZ” an activist is attempting to own the issue and shut down any discussion or analysis. In a policy framework where there may be uncertainty or grey areas, imposing a “the” provides a wedge between others’ false opinions and “the” truth.
With all due respect to Dr. Howarth, it is appropriate to consider why a “Professor of Ecology & Environmental Biology” is qualified to be an expert on methane emissions from fracking. In my opinion, scientists getting paid to deliver a specific result from trust fund philanthropic organizations, no matter how noble the perceived motive, is the same as the much vilified “tobacco industry” scientists. The funding stream ends when the results don’t match the funder’s requirements so their arguments are biased. They may be right but the arguments must be considered in that context and debated.
As a member of the Climate Action Council, Howarth was considered a saint and most unquestioningly accepted whatever he said as gospel. This deference to his concerns is also apparent in the Integration Analysis and Scoping Plan. However, his views are not universally accepted. For example, the Climate Act requires New York to account for upstream emissions from fossil fuel used in the state because Howarth has claimed in a 2020 paper that “Some evidence indicates that shale-gas development in North America may have contributed one-third of the total global increase in methane emissions from all sources over the past decade (Howarth 2019).” This paper and other similar papers claim that “methane emissions can contribute significantly to the GHG footprint of natural gas, including shale gas” and form the rationale of the Climate Act vilification of natural gas.
Despite the Climate Act mandate to provide a “detailed explanation of any changes in methodology or analysis, adjustments made to prior estimates, as needed, and any other information necessary to establish a scientifically credible account of change” any contradictory information has been ignored. No comments on the Integration Analysis numbers that formed the basis for the Scoping Plan were mentioned at any of the Climate Action Council meetings. For example, I noted that there is a high quality, long-term monitoring network that measures methane (Lan et al., 2019) over the period when Pennsylvania shale-gas production increased tremendously. According to the plain language summary for the report:
In the past decade, natural gas production in the United States has increased by ~46%. Methane emissions associated with oil and natural gas productions have raised concerns since methane is a potent greenhouse gas with the second largest influence on global warming. Recent studies show conflicting results regarding whether methane emissions from oil and gas operations have been increased in the United States. Based on long‐term and well‐calibrated measurements, we find that (i) there is no large increase of total methane emissions in the United States in the past decade; (ii) there is a modest increase in oil and gas methane emissions, but this increase is much lower than some previous studies suggest; and (iii) the assumption of a time‐constant relationship between methane and ethane emissions has resulted in major overestimation of an oil and gas emissions trend in some previous studies.
The fact that the relevant high quality, long-term monitoring network does not show a trend consistent with the work of Howarth is a fatal flaw in his claims. In addition, those measurements unequivocally support another contradictory analysis by Lewan that concludes his ideas, perspectives, and calculations on methane emissions from shale gas are invalid. The bottom line is that two pied pipers are responsible for the Climate Act’s irrational war on natural gas. The Climate Act’s elimination of natural gas is based on the false promises of one biased individual supported by one charismatic motivated politician. These pied pipers are going to lead New York over an energy cliff.
The Climate Act Has No Clothes
Howarth’s statement went on to claim that the Scoping Plan development process ”brought in a large number of experts and key stakeholders who worked diligently to advise the Council on our Scoping Plan”. After extolling the success of the stakeholder process and the staff members who contributed, he explained why everything will work out:
I further wish to acknowledge the incredible role that Prof. Mark Jacobson of Stanford has played in moving the entire world towards a carbon-free future, including New York State. A decade ago, Jacobson, I and others laid out a specific plan for New York (Jacobson et al. 2013). In that peer-reviewed analysis, we demonstrated that our State could rapidly move away from fossil fuels and instead be fueled completely by the power of the wind, the sun, and hydro. We further demonstrated that it could be done completely with technologies available at that time (a decade ago), that it could be cost effective, that it would be hugely beneficial for public health and energy security, and that it would stimulate a large increase in well-paying jobs. I have seen nothing in the past decade that would dissuade me from pushing for the same path forward. The economic arguments have only grown stronger, the climate crisis more severe. The fundamental arguments remain the same.
I believe that this is the fundamental basis for the Climate Act’s aggressive schedule. The Jacobson analysis approach unfortunately is pretty much the same as the Integration Analysis modeling approach for the Scoping Plan. Both modeling efforts project future load requirements, then list a bunch of control strategies, estimate the energy they could produce, and presume everything will work together if we cross our fingers. Neither includes a feasibility analysis that considers reliability, affordability, or cumulative environmental impacts.
Howarth appeals to the authority of peer-reviewed science to provide credibility to the Jacobson analysis. However, science is a continuous process where hypotheses are constantly challenged and confirmed. In this instance Howarth neglects to mention the analyses that discredit the Jacobson work.
The Jacobson analysis cited was a continuation of previous work. For example, in a widely publicized November 2009 Scientific American article, Mark Jacobson and Mark Delucchi, suggested all electrical generation and ground transportation internationally could be supplied by wind, water and solar resources as early as 2030. However, other contemporary projections were less optimistic. Two examples: the2015 MIT Energy and Climate Outlook has low carbon sources worldwide as only 25% of primary energy by 2050, and renewables only 16% and the International Energy Agency’s two-degree scenario has renewables, including biomass, as less than 50%.
Howarth’s statement cites a specific plan for New York (Jacobson et al. 2013) that he and Jacobson laid out a decade ago. He says that “In that peer- reviewed analysis, we demonstrated that our State could rapidly move away from fossil fuels and instead be fueled completely by the power of the wind, the sun, and hydro.” Table 2 from that report follows. This analysis includes power from exotic resources such as waves, geothermal, tidal turbines, and concentrated solar power but no energy storage. It is significantly different than the projections in the Integration Analysis and the New York Independent System Operator (NYISO) 2021-2040 System & Resource Outlook that exclude all the exotic renewable generating capacity, contain significant amounts of energy storage, and include a new dispatchable, emissions-free resource for a set of resources that they think can provide sufficient electrical power for the future. Furthermore, it claims that end-use power demand can be decreased by 37%. In my opinion, any analysis that suggests that concentrated solar power is a viable source of energy in New York is simply not credible because that resource would never work in New York. It is too cloudy to operate enough to cover costs and the environmental impacts would be too great.
There was a formal rebuttal paper to this analysis. The rebuttal paper argued that:
The feasibility analysis performed by Jacobson et al. (2013) is incomplete and scientifically questionable from both the technical and economic perspectives, and it implicitly assumes, without sufficient justification, that social criterion would not produce even larger feasibility barriers.
Jacobson et al. responded to that rebuttal claiming that “The main limitations are social and political, not technical or economic.” Given the significant differences between that analysis and the most recent projections by the organization responsible for keeping the lights on, I agree with the conclusion cited above. I do not believe that the 2013 analysis includes a defensible feasibility analysis.
Using Jacobson as the basis for the Climate Act transition gets worse. Unmentioned by Dr. Howarth is that in a 2015 article for a different iteration of the wind, water, and solar roadmap Clack et al, 2017 discredited the Jacobson approach:
In this paper, we evaluate that study and find significant shortcomings in the analysis. In particular, we point out that this work used invalid modeling tools, contained modeling errors, and made implausible and inadequately supported assumptions. Policy makers should treat with caution any visions of a rapid, reliable, and low-cost transition to entire energy systems that relies almost exclusively on wind, solar, and hydroelectric power.
In the scientific process, when issues with your work are noted, the proper response is to provide more evidence supporting your modeling tools, explain why the claimed errors are not errors, and defend your assumptions. Instead, Jacobson filed a lawsuit, demanding $10 million in damages, against the peer-reviewed scientific journal Proceedings of the National Academy of Sciences and the authors for their study showing that Jacobson made improper assumptions in order to make his claims that he (and by extension Howarth) had demonstrated U.S. energy could be provided exclusively by renewable energy, primarily wind, water, and solar. In my opinion this is an appalling attack on free speech and scientific inquiry but want to emphasize that the bad actions by Jacobson in no way should be attributed to Howarth.
In my opinion Jacobson’s attempted lawsuit was because his work could not stand on its own. Therefore, it is unsettling that it is claimed to be the basis of the Climate Act. Howarth’s statement explicitly lays out his position for the Jacobson analysis:
We further demonstrated that it could be done completely with technologies available at that time (a decade ago), that it could be cost effective, that it would be hugely beneficial for public health and energy security, and that it would stimulate a large increase in well-paying jobs.
Unfortunately, Howarth’s technology demonstration is not supportable. Nonetheless, it forms the basis for the Climate Act schedule and zero-emission electric system by 2040 mandate. The Climate Action Council has embraced it despite the projections in the Integration Analysis and the NYISO Resource Outlook that reject it. The Council is denying the majority opinion despite the evidence presented in their own analysis. The Climate Act has no clothes.
Conclusion
Pied piper Dr. Robert Howarth stated that “Our final Scoping Plan from the Climate Action implicitly endorses the vision of the Jacobson et al. paper and is quite clear: we can meet the goals of the CLCPA and we can and will do so in way that is affordable and that will benefit all New Yorkers.” Unfortunately, that vision has no clothes. The implementing regulations and additional legislation necessary to implement this vision must include independent, unbiased feasibility analyses to determine if the proposed plans can maintain current standards of reliability, will preserve the affordability of energy, and not create environmental impacts to New York State that are greater than the alleged impacts of climate change. Failure to do so will ensure that the state ends up as badly as the children’s stories.
Update 1/5/2023
I highly recommend the post by Russel Schussler Academics and the Grid because it does a good job explaining why academic studies of the energy system (like the work of Jacobson and Howarth) need to be considered carefully. It concludes:
Academic research that promotes improvements to the power greed needs to be evaluated carefully with the understanding that the grid is a complex system full of interactions. Changes to the grid involve numerous hurdles. Language is often imprecise. For instance, when readers see a statement stating “Solar and wind could attain penetration levels of X”. What the statement really means is “Based on the factors I looked at and ignoring a vast number of critical requirements I have not looked at, solar and wind may be able to replace fossil resources at a level of X. But probably not.” Unfortunately, the statement is often interpreted as “Solar and wind can attain penetration levels of X with no significant concerns.”
Everyone wants to do right by the environment to the extent that they can afford to and not be unduly burdened by the effects of environmental policies. I submitted comments on the Climate Act implementation plan and have written over 250 articles about New York’s net-zero transition because I believe the ambitions for a zero-emissions economy embodied in the Climate Act outstrip available renewable technology such that the net-zero transition will do more harm than good. The opinions expressed in this post do not reflect the position of any of my previous employers or any other company I have been associated with, these comments are mine alone.
Climate Act Background
The Climate Act established a “Net Zero” target (85% reduction and 15% offset of emissions) by 2050. The Climate Action Council is responsible for preparing the Scoping Plan that outlines how to “achieve the State’s bold clean energy and climate agenda.” In brief, that plan is to electrify everything possible and power the electric gride with zero-emissions generating resources by 2040. The Integration Analysis prepared by the New York State Energy Research and Development Authority (NYSERDA) and its consultants quantifies the impact of the electrification strategies. That material was used to write a Draft Scoping Plan that was released for public comment at the end of 2021 and approved on December 19, 2022.
The buildings sector is currently the largest source of greenhouse gas (GHG) emissions in New York State. As a result, reducing emissions from home heating is a key component of the Scoping Plan implementation framework. Heat pumps are a prominent part of the state’s residential electrification plans and its narrative is that installing a heat pump is easy, cost-effective, and will provide a satisfactory level of comfort. The article notes that heat pumps are the most economical option to replace gas and other fossil fuels.
As has been the case for every component of the Plan that I have evaluated, there is more nuance and issues than the Climate Action Council admits. My concerns about home electrification have prompted me to submit comments on the Draft Scoping Plan, write a number of articles on home electrification (building shells, narrative, and costs), and even get interviewed about heating electrification conversions.
The New York State Energy Research & Development Authority (NYSEDA) is responsible for convincing homeowners to retrofit. Given the performance of modern fossil-fired furnaces I think that is an uphill battle. That difficulty is recognized by the state. For example, Table 11 of the Buildings Chapter in the Final Scoping Plan includes the theme “Expand New York’s commitment to market development, innovation, and leading-by-example in state projects contains strategy “B9: Scale up public awareness and consumer education”. In my opinion, public awareness and consumer education from NYSERDA about heat pumps is propaganda because it only shows the benefits and barely, if at all, mentions the downsides and caveats. Even the Scoping Plan recognizes that there are caveats for heat pump success: heat pumps must be properly chosen, appropriately sized, paired with an energy efficient building envelope or building shell, and installation must consider the appropriate minimum temperature. This post will address those caveats relative to this article.
New York State All Electric Home Article.
The article does a good job explaining why heat pumps will likely be mandated by the State. It correctly points out that now that the Scoping Plan is complete it is up to the governor, state agencies and legislators to implement the council’s recommendations. One of my concerns about the article is that it does not consider the possibility that the Scoping Plan could be flawed. For example, the Plan claims that 1 million to 2 million heat pumps will be installed in New York homes by 2030. However, that assumes that there is widespread consumer appetite to switch to all-electric homes. The article includes a description of a homeowner who has installed a heat pump. He is quoted as saying “His main goal was not to save money. He was out to fight climate change.” I investigated installing a heat pump for my home and the energy advisor said that most of the people who are installing them now have the same motive. The Scoping Plan hasn’t considered the fact that while many people say that they want to do something about climate change the number of people willing to spend significant money or can afford to do something is much smaller.
The article asks if “pricey electric heat pumps really keep homes warm in our frigid winters.” The article follows the party line when it states that “A new breed of “cold climate” air-source heat pump is a valid, energy-efficient heating option in Upstate New York.” I agree that heat pumps work but only if all four caveats noted in the Scoping Plan are considered.
The first caveat is that the heat pump must be properly chosen. If the heat pump is one of the new breed of cold climate systems it can meet that requirement. In a recent post I noted that in a recent presentation to the Climate Action Council it was explained that the Northeast Energy Efficiency Partnerships (NEEP) maintains a specification and product list that identifies specific air source heat pumps that work during extreme cold weather. If the heating, ventilation, and air conditioning (HVAC) contractor determines the appropriate extreme cold weather limits, then the furnace should be able to provide sufficient heat.
However, there are two complicating issues for choosing the proper heat pump. In the first place determining the appropriate cold weather constraint is not as straight-forward as the Scoping Plan suggests. At a recent Climate Action Council meeting there was a discussion of maps of worst-case cold temperatures that are used for this purpose but no recognition that there are multiple maps. Furthermore, temperatures are affected by local terrain conditions creating colder temperatures than shown on any state-wide map. The second issue is a design consideration. Heat pumps are more efficient than typical furnaces because they move energy from outside air into the home instead of creating it through combustion. However at some point even the most effective heat pump is not going to get enough energy out of extremely cold air to create enough heat to warm a house. Supporters argue that heat pumps are used successfully in the Scandinavian countries but the reason is that those homes have very effective building shells.
Based on my research and what I have seen, the building shell caveat has not received enough attention in the Scoping Plan, Integration Analysis or the NYSERDA marketing campaigns for heat pumps. Last summer I published a long article describing building shell issues. The Scoping Plan does not include a description of the building shell assumptions sufficient to differentiate between the reference, basic, and deep shell categories used in the Integration Analysis. I believe that the deep shell building envelope is necessary in order to ensure that New York homes can work without supplemental resistance heating capabilities. Unfortunately, the Scoping Plan does not provide sufficient information to determine what has to be included in order to meet that level.
The last caveat to discuss notes that the heat pump must be appropriately sized. The subtlety is that the entire system, including the ducts, has to be sized correctly. In the building shell post I documented my conversation with the energy advisor who described many of the issues related to improperly sizing the system. Heat pumps do not provide treated air that is as warm as a combustion furnace, so a big issue is that the ductwork may have to be made larger to provide sufficient heat. Tearing out the existing ductwork and installing larger ducts must be a disruptive project. In my case, this requirement led to his recommendation that it would be more cost-effective to install several ductless air-source heat pumps than to replace the existing central heating system.
The article discusses costs. The research I have seen agrees with the article that over the lifetime of the equipment that retrofit conversions will be cost effective for homes heated with oil, propane, or electric resistance heat but that is not true for natural gas. I have not seen analyses that incorporate the costs of building shell improvements but I my anecdotal discussion with the energy advisor he said that in my case those upgrades would never reduce energy use enough to pay for them.
The article references HeatSmart CNY, a Syracuse community organization, for its costs for installation of air source heat pumps. While I have my doubts that an organization whose sole reason to exist is to push heat pumps using NYSERDA funding could be considered an unbiased source of information the numbers provided appear reasonable. Based on their experience the “average cost of installation for a cold climate air-source heat pump has been about $20,000 to $25,000”. It is interesting that those costs are higher than the costs used in the Scoping Plan consistent with my findings that most of the cost numbers in the Plan are biased low. One of the arguments why the Climate Action Council claimed they could not provide costs to consumers was because rebates, tax credits and other subsidies availability isn’t known. HeatSmart CNY claimed that the homeowner typically pays more like $15,000 to $16,000 out of pocket when they are applied. The article also notes that additional rebates are expected for low- and middle-income homeowners as the result of the past year’s new Federal spending bills.
Earlier I mentioned that the Plan claims that 1 million to 2 million heat pumps will be installed in New York homes by 2030. However, HeatSmart CNY has only helped about 150 Central New York homeowners replace existing heating systems with heat pumps in the past four years. That suggests that there is going to have to be an enormous uptick in adoption rates for electric heating systems.
There is another cost issue that is never brought up in the advertising. The article mentions evolving technology being developed by the U.S. Department of Energy that includes a ”competition under way for manufacturers to develop heat pumps that will operate efficiently at temperatures as low as minus 15 degrees Fahrenheit” and “For now, many heat pumps in cold climates are installed with backup systems (using electric resistance heat or other sources) for extremely cold temperatures.” The Scoping Plan goal is to eliminate emissions from backup heat systems so their preferred backup alternative is electric resistance heat. The problem is that electric resistance heat is very inefficient and needs a lot of energy to operate. In order to provide that energy during periods of extremely cold temperatures when everybody who has all-electric homes and electric vehicles needs the energy the most, the distribution network and house service for many homes will have to be upgraded or the system will overload and blackout. The direct costs to upgrade home service and the indirect costs to upgrade the distribution network are a real hidden cost.
The article describes the experience of a homeowner who had a heat pump installed about 18 months ago. In addition to the heat pump, “he beefed up his insulation, installed a separate heat pump for hot water, and added a mechanical ventilation system to circulate fresh air.” The homeowner estimates the whole project cost $30,000 to $40,000 after rebates. Based on my work I think that is a more accurate reflection of the conversion costs. The article notes that there are efforts to subsidize low- and middle-income homeowners to make conversions less expensive but the fact remains that these conversions are costly.
Conclusion
This is a good article and covers many issues associated with residential home heating. However, despite its length and coverage it still did not address all the downsides of the Hochul Administration’s planned mandates to electrify homes. The Scoping Plan is only a framework. It does not begin to cover the “what if” questions like will any New York actions possibly affect climate change or what happens when there is an ice storm when everything is electrified. Finally, it does not include a detailed estimate of consumer costs.
New York’s Greenhouse Gas emissions are less than one half one percent of global emissions and since 1990 global those emissions have increased by more than one half a percent per year. While the fact that our emission reductions will get displaced by global emission increases in less than a year may not mean that New York should not do something, it does mean that we can step back and look at what can be done to ensure the State’s plan does not do more harm than good. The State’s arguments that we must act in haste are not supportable.
I have two concerns about doing more harm than good both related to the observation that “Death rates in winter months have been eight to 12 percent higher than in non-winter months”. The U.S. Environmental Protection Agency adds that “even moderately cold days can increase the risk of death for many people.” Home heating is obviously crucial to reducing those risks. My family survived two prolonged electricity outages and many more short outages in the 40 plus years we have lived in my home but never had any outage of our natural gas supply. When everybody has electrified everything what happens when there is an ice storm that causes an extended blackout in the winter? The other concern is whether all New Yorkers really afford all the costs for all-electric homes? How do we make sure that those least able to afford the investments necessary to convert to all-electric homes are not disproportionately dis-advantaged? Over 58% of current housing units are heated with natural gas and retrofitting those homes is not cost-effective. Will the State provide detailed cost estimates before they propose regulations to coerce us to convert?
The article cites the American Council for an Energy-Efficient Economy as saying that if the goal is to eliminate site emissions from households, natural gas will have to be phased out. My obsession to address New York’s net-zero transition boils down to fighting for my personal choice. I think that when all the benefits, costs, and tradeoffs are considered that natural gas is a better choice than electrification for me and my home. Anyone who agrees with me should let your legislators know of your concerns and demand answers to the inconvenient questions not addressed by the Scoping Plan framework when regulations are proposed.
In the past twelve months I have spent an inordinate amount of time evaluating the Climate Leadership and Community Protection Act (Climate Act) and the Scoping Plan implementation plan framework to meet the ambitious net-zero goal by 2050. Climate Action Council Co-Chair Harris recently made the claim that delaying climate action will cost New Yorkers more than acting now. However, that statement is misleading and inaccurate. This post shows that the claim is no more than a shell game gimmick.
Everyone wants to do right by the environment to the extent that they can afford to and not be unduly burdened by the effects of environmental policies. I submitted comments on the Climate Act implementation plan and have written over 250 articles about New York’s net-zero transition because I believe the ambitions for a zero-emissions economy embodied in the Climate Act outstrip available renewable technology such that the net-zero transition will do more harm than good. The opinions expressed in this post do not reflect the position of any of my previous employers or any other company I have been associated with, these comments are mine alone.
Climate Act Background
The Climate Act establishes a “Net Zero” target (85% reduction and 15% offset of emissions) by 2050. The Climate Action Council is responsible for preparing the Scoping Plan that will outline how to “achieve the State’s bold clean energy and climate agenda.” The Integration Analysis prepared by the New York State Energy Research and Development Authority (NYSERDA) and its consultants quantifies the impact of the strategies. That material was used to write a Draft Scoping Plan that was released for public comment at the end of 2021. The final Scoping Plan was approved by the Climate Action Council on December 19, 2022 and the Integration Analysis documentation was recently updated.
Documentation Shell Games
The Scoping Plan has been described as “a true masterpiece in how to hide what is important under an avalanche of words designed to make people never want to read it”. The Implementation Analysis quantitative assessment goes further. It does not even pretend to clearly include what is important to evaluate the numbers that are used in the Scoping Plan. There is no concise documentation that includes the costs, expected emission reductions and assumptions used for the control strategies included in the Integration Analysis documentation. Instead, these is a massive spreadsheet with key drivers and input assumptions for all aspects of the transition. The public is left to try to decipher what is included in each control strategy, figure out how the information was used, and then calculate what the results are for all control strategies.
The first shell game gimmick picks and chooses what control strategies are included in the costs of de-carbonization. In order to evaluate the effects of different policy options, The Integration Analysis model projects future conditions for a baseline case. The evaluation analysis makes projections for different policy options, and then the results are compared relative to the baseline. Standard operating procedure for this kind of modeling is to use a business-as-usual or status quo case for the baseline. Appendix G Section 3.4: Benefits and Costs argues that the costs of the control strategies should be considered relative to status quo or business as usual costs:
When viewed from a systems expenditure perspective (Figure 48), the NPV of net direct costs for Scenarios 2, 3, and 4 are moderate, roughly 11% as a share of the NPV of reference case system expenditures ($2.7 trillion). Because significant infrastructure investment will be needed to maintain business as usual infrastructure within the state irrespective of further climate policy, redirecting investment away from status quo energy expenditures and toward decarbonization is key to realizing the aims of the Climate Act.
Figure 51 from Appendix G is the documentation for the claim that the cost of inaction exceeds the cost of action by more than $115 billion. In my Draft Scoping Plan comments I argued that the figure is mis-leading because it presents the numbers relative to a Reference Case rather than a business-as-usual or status quo case that represents a future without decarbonization programs. I maintain that the true cost of New York’s net-zero transition by 2050 should include all costs associated with all programs designed to reduce GHG emissions. The authors of the Integration Analysis and Scoping Plan excluded decarbonization costs that I believe should be included and provided insufficient documentation to enable anyone to determine what is in or out of the Reference Case.
In the Scoping Plan shell game, the first thing to watch is the claim that “significant infrastructure investment will be needed to maintain business as usual infrastructure within the state irrespective of further climate policy, redirecting investment away from status quo energy expenditures and toward decarbonization is key to realizing the aims of the Climate Act” but at the same time including decarbonization costs for “already implemented” programs in the Reference Case. If a reader loses track of this shell, it is easy to assume that the costs presented are relative to a business-as-usual or status quo modeling scenario per standard procedures. Instead, the State compares mitigation scenario costs to a Reference Case that includes “already implemented” decarbonization costs.
There is another shell to watch. In my review of the Draft Integration Analysis supplement, I ended up searching the document for the phrase “reference case” to try to determine what “already implemented” decarbonization programs were included in the Reference Case. The following figure reproduces the page with the documentation on page 12 in Appendix G Integration Analysis Technical Supplement Section I. The documentation is buried in the footnote for the circled reference for the blank caption to Figure 4.
Given its importance to the cost/benefit claim, my Draft Scoping Plan comment noted that this reference case caveat should be clearly described in the text rather than in a footnote. What I missed in the draft was a reference to explanatory text in section 5.3 of the document. However, that text was not included in the draft document! The appropriate text is in the recently released Appendix G section 5.3: Scenario Assumptions chapter and lists the “already implemented” programs. It states:
The integration analysis evaluated a business-as-usual future (Reference Case) a representation of recommendations from CAC Advisory Panels (Scenario 1), and three scenarios designed to meet or exceed GHG limits and carbon neutrality (Scenarios 2 through 4). Scenarios 2, 3, and 4 all carry forward foundational themes based on findings from Advisory Panels and supporting analysis but represent distinct worldviews. A detailed compilation of scenario assumptions can be found in Annex 2.
For the record Annex 2 refers to a massive spreadsheet that is certainly detailed but most certainly does not provide an easily accessible compilation of scenario assumptions. In particular, the documentation does not provide explicit information to determine what costs are specifically included in the Reference Case relative to the other scenarios.
The Reference Case described as “Business as usual plus implemented policies” includes the following:
Growth in housing units, population, commercial square footage, and GDP
Federal appliance standards
Economic fuel switching
New York State bioheat mandate
Estimate of New Efficiency, New York Energy Efficiency achieved by funded programs: HCR+NYPA, DPS (IOUs), LIPA, NYSERDA CEF (assumes market transformation maintains level of efficiency and electrification post-2025)
Funded building electrification (4% HP stock share by 2030)
Corporate Average Fuel Economy (CAFE) standards
Zero-emission vehicle mandate (8% LDV ZEV stock share by 2030)
Clean Energy Standard (70×30), including technology carveouts: (6 GW of behind-the-meter solar by 2025, 3 GW of battery storage by 2030, 9 GW of offshore wind by 2035, 1.25 GW of Tier 4 renewables by 2030)
Figure 47 shows the total net present value (NPV) of direct costs relative to the Reference Case over the period 2020-2050. However, these bar charts provide little information.
It is more useful to look at a table of the values to try to understand how the Reference Case costs differ from the mitigation scenarios. That information is available in the IA-Tech-Supplement-Annex-2-Key-Drivers-Outputs-2022 spreadsheet. One thing that jumps out is the $3.45 billion difference for the Transportation Investment between the Reference Cased and the Low-Carbon Fuels Scenario. There are only two decarbonization programs included in the Reference Case: Corporate Average Fuel Economy (CAFE) standards and Zero-emission vehicle mandate (8% LDV ZEV stock share by 2030). In my opinion that $3.45 billion difference either indicates that most of the EV electrification costs are improperly included in the Reference Case or that the cost estimates are suspect.
I found that both issues contribute to the small difference between the Reference Case and the Low-Carbon Fuels scenario. According to the Scoping Plan the costs to replace light-duty vehicles, trucks, and buses with electric alternatives, provide the charging infrastructure to support those vehicles, and upgrade public transit services is only $3.45 billion over 30 years. For the most part the only reason for those expenses is decarbonization and whether it is explicitly part of the Climate Act or not, those costs should be included in the costs of the Climate Act. They have to be hundreds of billions of dollars. I have no doubts that proper accounting would reduce or reverse the alleged favorable benefit-cost ratio if just this is correctly attributed.
I believe that the cost estimates are also suspect. My Draft Scoping Plan Comment on Electric Vehiclesanalyzed the Integration Analysis spreadsheet documentation. The Integration Analysis presumes that the device costs for zero-emissions charging technology and the vehicles themselves decrease significantly over time. Home EV chargers and battery electric vehicles both are claimed to go down 18% between 2020 and 2030 alone. The following graph of electric vehicle costs shows that the costs for battery electric and hydrogen fuel cell vehicles that are the proposed solution go down over time. The costs for gas, diesel, and Plug-in Hybrid Electric vehicles are all identical and stay pretty constant. Given that PHEV also use batteries, why wouldn’t that technology cost decrease similar to the full battery EV. The overall cost decreases in the preferred technologies are so large that the total costs for the zero-emissions vehicles adoption is cheaper than using existing technology. My comments noted that I cannot accept this optimistic assessment of future cost reductions without documentation that addresses at least the potential for battery supply chain issues. The Climate Action Council “acknowledged” my comment by providing a link but never addressed the issues that I raised.
Conclusion
A shell game is defined as “A fraud or deception perpetrated by shifting conspicuous things to hide something else.” In the Scoping Plan shell game, the authors argue that energy costs in New York are needed to maintain business as usual infrastructure even without decarbonization policies but then include decarbonization costs for “already implemented” programs in the Reference Case baseline contrary to standard operating procedure to use a status quo baseline for this kind of modeling. The documentation for Reference Case assumptions was missing in the draft documents. Shifting legitimate decarbonization costs to the Reference Case because they are already implemented and hiding the documentation fits the shifting condition of the shell game deception definition perfectly.
The deceptions of the Scoping Plan are furthered by ignoring stakeholder input that ran contrary to their narrative. Climate Action Council Co-Chair Harris recently claimed that the stakeholder “comments, letters, and engagement have absolutely impacted this process and the plan it has produced for the better.” I see no evidence that the Climate Action Council addressed my Integration Analysis comments on the benefits and costs evaluation or any other stakeholder comments associated with quantitative Integration Analysis issues.
The Climate Act establishes a “Net Zero” target (85% reduction and 15% offset of emissions) by 2050. The Climate Action Council is responsible for preparing the Scoping Plan that will outline how to “achieve the State’s bold clean energy and climate agenda.” In brief, that plan is to electrify everything possible and power the electric grid with zero-emissions generating resources by 2040. The Integration Analysis prepared by the New York State Energy Research and Development Authority (NYSERDA) and its consultants quantifies the impact of the electrification strategies. That material was used by staff from various State agencies to write a Draft Scoping Plan that was released for public comment at the end of 2021. The Climate Action Council is finalized the Scoping Plan on schedule.
The December 19, 2022 meeting materials are available at the New York Climate meetings page including the meeting presentation and the meeting recording. In my previous article I noted that the it was unlikely that the Climate Action Council would not vote to approve the Scoping Plan because all but two of the 22 members were picked by the Democrats who passed the legislation I wondered if anyone would cast a symbolic “no” vote and was surprised that three members voted against approval. After the formal vote each member of the Council gave a statement supporting their decision. This post summarizes those statements in three categories: the Hochul Administration’s position, the at-large members who supported it and the three members who voted against approval. I am not going to provide any commentary on these summaries.
New York State Leadership Statement
Co-chair of the Climate Action Council and President & CEO of the New York State Energy Research & Development Authority Doreen M. Harris summed up the position of the Hochul Administration. Her statement said the plan “upholds three main principles of the work that we have advanced throughout this almost three-year process”:
Principle 1: Climate Action
This plan demonstrates that climate action is not only necessary, but that delay is to be avoided. Delaying climate action has been shown to cost New Yorkers more. Therefore, I am in favor of undertaking this action now so that we may begin delivering additional benefits to the New Yorkers we are acting on behalf of.
As we implement our climate actions, certainly we will consider the on-the-ground issues and immediate costs and concerns of citizens and businesses. This is how we implement policy in New York every day and will continue to do so.
But our eye is on the prize and we in New York are wise to take climate action and have it serve as a model to the rest of the country.
Principle 2: Climate Justice
We have a plan that demonstrates how success can only be claimed when we have been able to advance and implement our climate action in a manner that addresses the issues of past decisions.
Historically, underserved communities have not been included in the dialogue and that must change. Underserved communities have also not had sufficient access to clean energy in housing, education and career opportunities and that must also change.
This plan is demonstrating how all disciplines around this table – Energy, Environment, Education, Transportation, Labor, Health, Housing, Industry, Agriculture – have responsibilities to make sure that justice is an equal outcome to the changes in our day-in, day-out business operations.
To put it simply, business as usual is no longer an option.
Principle 3: Climate Economy
I do agree with comments made at previous meetings that the economic opportunities we are looking to create through our climate planning have often been an unspoken undercurrent in this process.
We simply do not succeed if our state economy is not better off for our activities in advancing this plan. I am beyond enthusiastic about the new industries and career opportunities that we are creating in New York. And, as a product of Upstate New York myself I have never seen the level of opportunity that is at our doorstep in all parts of the state.
But that is not to discount the attention that must be paid to New Yorkers – particularly my energy colleagues and workers – that will need to find their new opportunities in our decarbonizing economy. I pledge that I will do what I can to make sure we create all those opportunities and more so that you too can become part of the more than 200,000 jobs that we stand to gain.
At Large Member Supporters of the Scoping Plan
Four Council Members chosen for their ideology and not their energy system expertise all voted to approve the Scoping Plan. Their comments beg for responses but that will have to wait until another time.
The statement of Robert W. Howarth, Ph.D., the David R. Atkinson Professor of Ecology & Environmental Biology at Cornell University was very illuminating relative to the motives of the supporters. It is also very difficult to quote this without responding. For starters, Dr. Howarth basically takes credit for the law:
Assembly Person Steven Englebright was hugely instrumental in the passage of the Climate Leadership & Community Protection Act that established the Climate Action Council. I thank him for his leadership on this, and particularly for his support of the progressive approach on greenhouse gas emissions that is a central part of the CLCPA. I originally proposed this to Assembly Person Englebright in 2016, and he enthusiastically endorsed and supported it through multiple versions of the bill that finally led to passage of the CLCPA in 2019. In this accounting for greenhouse gases, a major government for the first time ever fully endorsed the science demonstrating that methane emissions are a major contributor to global climate change and disruption. Further, in passing the CLCPA New York recognized that consumption of fossil fuels (and not simply geographic boundaries) is what matters in addressing the climate crisis. New York wisely banned the use of high-volume hydraulic fracturing (“fracking”) to develop shale gas in our State. But since the time of that ban, the use of fossil natural gas has risen faster in our State than any other in the Union. Methane emissions from this use of shale gas are high, but much of that occurs outside of our boundaries in the nearby states of Pennsylvania, West Virginia, and Ohio. Through the CLCPA, the citizens of New York are taking responsibility for these out-of-state emission caused by our use of fossil fuels, particularly for fossil natural gas. The way to reduce these emissions is to rapidly reduce our use of fracked shale gas.
He went to claim that the Scoping Plan development process ” brought in a large number of experts and key stakeholders who worked diligently to advise the Council on our Scoping Plan”. After extolling the success of the stakeholder process and the staff members who contributed he explained why everything will work out:
I further wish to acknowledge the incredible role that Prof. Mark Jacobson of Stanford has played in moving the entire world towards a carbon-free future, including New York State. A decade ago, Jacobson, I and others laid out a specific plan for New York (Jacobson et al. 2013). In that peer-reviewed analysis, we demonstrated that our State could rapidly move away from fossil fuels and instead be fueled completely by the power of the wind, the sun, and hydro. We further demonstrated that it could be done completely with technologies available at that time (a decade ago), that it could be cost effective, that it would be hugely beneficial for public health and energy security, and that it would stimulate a large increase in well-paying jobs. I have seen nothing in the past decade that would dissuade me from pushing for the same path forward. The economic arguments have only grown stronger, the climate crisis more severe. The fundamental arguments remain the same.
Our final Scoping Plan from the Climate Action implicitly endorses the vision of the Jacobson et al. paper and is quite clear: we can meet the goals of the CLCPA and we can and will do so in way that is affordable and that will benefit all New Yorkers. Our State will be stronger as this plan is implemented, the health and well being of our citizens improved. Economic uncertainties and vulnerabilities will be reduced. Energy security will be enhanced. Our plan is also clear that the #1 priorities are to continue to move towards wind, solar, and hydro as our source of electricity; to move rapidly towards beneficial electrification as a source of heating and cooling in our homes and commercial buildings; and to move rapidly towards beneficial electrification in our personal and commercial vehicles.
The CLCPA provided us the promise and—through multiple provisions in the law—the guidance to make the right decisions on the pace and scale of the change needed. At its core, the CLCPA is about establishing standards into law so that New York does its share to create a planet that is healthy enough for humans to inhabit. What we learned through our process is that zeroing out all greenhouse gas emissions through a massive transformation of our economy is the only viable and certain path.
What truly makes the CLCPA the most ambitious of plans is the legal assurance that those disproportionately impacted by climate change and poor air quality will have their needs, health, and communities prioritized. That, and we will not leave any worker behind as the transition unfolds.
What we have developed is a solid blueprint to guide the public and lawmakers on how to secure the promises of our climate law.
The plan shows the pathway forward to provide big benefits, including:
Reducing energy bills
Improving our health and lowering health care costs
Reversing decades of environmental injustice that has caused such harm to those who live, work, and play in our state’s disadvantaged communities.
The costs of acting are not trivial, but the analysis that the council has agreed to revealed that the cost of inaction is greater than the cost of acting. Our plan shows that the quicker the public, the Governor and Legislature move to electrify all sectors, the faster we’ll realize the benefits.
Raya Salter Esq., Principal, Imagine Power LLC is “an attorney, consultant, educator and clean energy law and policy expert with a focus on energy and climate justice.” Highlights from her statement reflected her background:
The true credit for this Plan belongs to the thousands of activists across New York who have rallied, marched, wrote letters and demanded that this be the people’s plan. In 2019 I stood with activists not far from where we sit now, who shut down then-Governor Cuomo’s office in an action to demand the passage of what ultimately became the Climate Leadership and Community Protection Act. It is that law that required this process and plan.
The release of this final Scoping Plan is a landmark moment for climate action in New York State. The Plan, if implemented, will guide New York towards a just energy transition and away from fossil fuels.
I was a member of the Council’s Gas Transition Subgroup and worked on the Scoping Plan’s vision to retire fossil fuel plants and decarbonize the buildings sector. It includes a blueprint for the retirement of New York City’s most-polluting fossil fuel plants and their sites by 2030 that will inform broader planning to retire fossil fuel plants throughout the State. This is a win for environmental justice.
The Plan is not perfect. Ideas for market-based “cap and invest,” and biofuels schemes should be rejected if they can’t overcome design flaws and stakeholder concerns. While the state’s climate law should ultimately prohibit the use of most “alternative fuels,” like “renewable natural gas” and hydrogen for use in pipelines on an emissions basis, the Plan is wrong to contemplate these false solutions. Likewise, looks into so-called “advanced-nuclear” are a dangerous distraction.
The Scoping Plan, however, provides a comprehensive approach to reaching the state’s nation-leading climate goals with a focus on justice and equity. The next step is to see it fully implemented.
Dr. Paul Shepson, Dean, School of Marine and Atmospheric Sciences at Stony Brook University only offered a short statement:
I will start by noting and asking us to remember that people around the world have not been paying the actual costs of burning fossil fuels to meet our energy needs; and so it is exciting and just and honorable that we are now embarking on a better way, with far fewer collateral costs to the environment, in support of ALL living things on the planet. And so, I enthusiastically endorse the December 19, 2022 final version of the New York State Climate Action Council Scoping Plan. While the Scoping Plan incorporates multiple compromises in wording and orientation, given the diverse and sometimes divergent interests of components of the CAC membership, it is nonetheless a great statement of New York State’s commitment to national and global leadership in the effort to achieve climate stabilization. The Scoping Plan, which supports the implementation of the CLCPA, is a document of which I am proud, and feel fortunate to have been able to contribute to its completion. I am impressed by and grateful for the hard work and dedication of the agency staff members who worked to bring this effort to completion, and the fantastic leadership of our co-chairs and of Sarah Osgood, and want to thank my fellow CAC members for helping to make this process enjoyable, and successful.
Council Members who Voted Against the Scoping Plan
I don’t think it is a coincidence that three members of the Climate Action Council with the most energy system practical experience voted against approval of the Scoping Plan.
Donna L. DeCarolis, President, National Fuel Gas Distribution Corporation explained that she supported many aspects of the Scoping Plan. However her statement described why she voted against it:
Throughout my tenure on the Council, and from my perspective as the President of a utility in western New York serving communities with more than 1.6 million people, I have continued to express concerns about the Scoping Plan’s consumer impacts – for residential homeowners, small businesses and industrial interests in the state – and to offer perspectives and alternatives that will allow us to meet the requirements of the Climate Leadership and Community Protection Act (Climate Act) while preserving reliability (at both the wholesale power generation level and for homes and businesses), energy system resiliency and an affordable transition for consumers. I find the final Scoping Plan falls short in this regard, and there remain significant concerns that could jeopardize the reliable, resilient and affordable provision of energy for the state’s residents and businesses. Specifically, the Scoping Plan:
• Fails to adequately ensure grid reliability for consumers;
• Relies too heavily on a single energy source that is prone to weather-related disruption; and,
• Does not include a full assessment of impacts on consumer energy affordability.
Gavin Donohue, President and CEO, Independent Power Producers of New York also voted against approving the Scoping Plan. His statement overview is a good summary of his position:
Two years ago, I was appointed to the State’s Climate Action Council. The Climate Leadership and Community Protection Act (“CLCPA”) requires an economy-wide approach to addressing climate change and decarbonization, coupled with mandates to deliver 70% of New York’s energy from renewable resources by 2030 and 100% emissions-free electricity supply by 2040 (“100 by 40 target”). The Scoping Plan (“Plan”) was intended to inform New York residents and businesses about measures necessary to meet the requirements of the CLCPA. While the Council is required to update the Plan at least once every five years, it is essential that the inaugural Plan is practical, comprehensive, and contains provisions that send investment signals necessary to achieve the CLCPA’s requirements in a reliable and cost-effective manner. There is no backup plan to this one, and the manner in which the document is structured does not achieve the expectations set two years ago.
I am voting against the final Plan since it remains significantly lacking in these core areas, with additional concerns as discussed below:
Reliability is inadequately addressed, putting New York at risk for economy crushing blackouts and potential public safety risks.
High energy costs for energy consumers and the impact on their cost of living and on the competitiveness of New York businesses.
Insufficient programs to keep benefits of existing renewable facilities in this state.
Leaping to moratoriums and bans instead of developing innovative technologies.
Undefined wording and the lack of a glossary of terms creates ambiguity in some of the Plan’s language.
To help raise awareness for these concerns and ensure that New York’s clean energy transition is done in a more responsible manner, IPPNY, along with the New York State AFL-CIO, the New York State Building & Construction Trades Council, and Business Council of New York State, formed a unique coalition to develop a set of seven principles1 to advance New York’s clean energy goals and establish the criteria to be met by the Plan. This coalition put productive and positive ideas on the table to make the Plan better. Unfortunately, these principles were insufficiently addressed by the Council and the Plan.
Dennis Elsenbeck, Head of Energy and Sustainability, Phillips Lytle was the final Council member to vote against the Scoping Plan. He explained that he voted against the Plan because “we have fundamentally missed the mark on balancing environmental and economic sustainability, choosing one over the other, thereby limiting the potential to achieve either goal.” His statement included five key concerns that led to that decision. The first two concerns are:
Limiting our solutions by losing sight of our climate challenges
We must not lose sight of the challenges we are working to solve. The CLCPA set ambitious climate and clean energy goals to safeguard our state’s resources for future generations while reinvesting in disadvantaged communities. Much of our discussions appeared to be more about shutting down the natural gas transmission and distribution network than on achieving the 85% Greenhouse Gas (GHG) reduction by 2050. Although they may appear similar, shutting down the natural gas network and achieving the CLCPA’s GHG goals are separate objectives requiring different technical paths. Our focus should be meeting our GHG reduction goals. Any discussions surrounding the natural gas transition should explore, with equal weight, what we are transitioning from and what we may be transitioning to. In my experience, limiting options also decreases the probability of meeting aggressive goals, such as our GHG objective.
Readiness of our Electric System
Much of the CLCPA outlines a transition from a fossil fuel to an all-electric economy. In my opinion, New York’s current electric distribution infrastructure cannot handle the projected 50% increase in demand. I have been adamant throughout Council discussions that without action, such as a PSC Order requiring utilities to respond, the electric distribution system is not equipped to accommodate such a transition without major investment-the cost, timing and implementability of which is yet to be determined. The Scoping Document begins to frame this challenge but falls short on how to resolve the matter_ As with most states and countries, climate initiatives begin on the supply side of the electric system. Large scale renewable energy projects appear to be focused on land (and water) availability and not as much on proximity to load centers resulting ina need for additional transmission investment; we must anticipate the impact of electrification on the distribution system to fully explore non-traditional utility investment by engaging market participants. Subject matter experts such as regulatory agencies, the NYISO, NERC and the electric utilities must be given the opportunity to respond to the Scoping Document before it reaches the Governor’s desk. We should have a more balanced and mandated planning strategy that aligns supply, demand and delivery and advances the CLCPA’s goals and our state’s economic development aspirations for business expansion, attraction and site readiness. We need to resolve the issue of dispatchable supply through continued exploration of the role of long duration storage, nuclear, hydrogen, renewable natural gas and other non-fossil-based approaches to ensure that we have a stable electric system in concert with how we progress with any gas transition strategy.
Conclusion
These statements give a good overview of the positions and motivations of Council membership. Needless to say, I strongly endorse the statements of the three members who voted against the Scoping Plan. When I find time I intend to address some of the more egregious claims of the proponents.
The Plan is just a framework that does not include a feasibility analysis to ensure the strategies proposed will maintain current standards of electric system reliability or the reliability of any other energy system components for that matter. Readers of this blog are well aware of the affordability crises that similar programs at other jurisdictions that are further along are experiencing this winter. The statements presented include a couple of references to a claim that the costs of inaction are greater than the cost of action. Earlier this year I posted an article describing the machinations used to make that misleading and inaccurate claim. I made those arguments to the Council in my verbal comments and followed up with detailed written comments but there was no acknowledgement of them by the Council. This whole process has been rigged from the start to get the pre-ordained answer.
The proponents of the Climate Act Scoping Plan are bound and determined to dive into this net-zero transition plan. Unfortunately, they don’t want to check to see if there is any water in the pool.
Roger Caiazza blogs on New York energy and environmental issues at Pragmatic Environmentalist of New York. More details on the Climate Leadership & Community Protection Act are available here and an inventory of over 250 articles about the Climate Act is also available. This represents his opinion and not the opinion of any of his previous employers or any other company with which he has been associated.
will be held on Monday, December 19, 2022, at 1:00 p.m. This post describes my overview impression of the process and the likely outcome of the vote. I think it is relevant outside of New York because it gives a template for implementing a net-zero transition program.
Climate Act Background
The Climate Act establishes a “Net Zero” target (85% reduction and 15% offset of emissions) by 2050. The Climate Action Council is responsible for preparing the Scoping Plan that will outline how to “achieve the State’s bold clean energy and climate agenda.” In brief, that plan is to electrify everything possible and power the electric grid with zero-emissions generating resources by 2040. The Integration Analysis prepared by the New York State Energy Research and Development Authority (NYSERDA) and its consultants quantifies the impact of the electrification strategies. That material was used by staff from various State agencies to write a Draft Scoping Plan that was released for public comment at the end of 2021. The Climate Action Council is required to finalize the Scoping Plan by the end of the 2022 so this meeting will meet that requirement. If anyone has a masochistic desire to view the meeting, details are available at the Climate Act meetings and events page.
Legislation enacting net-zero targets by 2050 are political ploys catering to specific constituencies. The prime narrative of the Climate Act is featured on their web page:
Our Future is at stake and that’s why New York State is committed to the most aggressive clean energy and climate plan in the country. Each of us has a role in protecting our communities and ensuring a sustainable future for every New Yorker. If we each do our part, we’ll lower harmful emissions in the air we breathe while transforming New York’s economy, creating new jobs, and building more resilient communities.
The authors of the Climate Act legislation believed that meeting the net-zero target was only a matter of political will. I believe that any similar legislation will follow the script used in New York. Despite the apparent objectivity of the implementation framework, it is just is a façade. The Climate Act established the Climate Action Council to direct the development of the Scoping Plan. It consists of 22 members that were chosen by ideology not expertise. There are 12 agency members: all appointed by the Governor, and 10 at-large members: two non-agency representatives appointed by the Governor, three representatives appointed by the Speaker of the Assembly, one representative appointed by the minority leader of the Assembly, three representatives appointed by the Temporary President of the Senate, and one representative appointed by the minority leader of the Senate. Not surprisingly, the legislation passed when both the Senate and Assembly were controlled by the Democratic party so all but two Council members are slanted one way. The upcoming vote on the Scoping Plan must pass by a super majority of 15 votes but it is purely a formality because of the makeup of the Council. The only question is whether anyone will cast a symbolic “no” vote for approval.
Public Comments
Similar programs will make a big deal about public participation. The Council has bragged about their stakeholder process noting that the comment period was longer than required. The Climate Act public comment period covered six months and included eleven Public Hearings where 700 people spoke. Approximately 35,000 comments were received but around 25,000 comments were “potentially the same or substantially similar”, i.e., form letters. That left on the order of 10,000 unique comments. It was obviously impossible for the Council members to read them all so agency staff had to read, categorize, and summarize all the comments. That filter certainly shaped the response to the comments because they got to pick and choose which comments received attention.
Agency staff presentations to the Council described themes of the comments with very little specificity. There was clear bias in the theme presentations – anything inconsistent with the narrative was disparaged, downplayed, or ignored. I recently noted that the Climate Action Council treatment of stakeholder comments basically ignored anything that conflicted with the narrative of the Climate Act. I suspect that any similar program will also have a phony public participation process.
There is another problem I believe will be common with other initiatives. The Council emphasis was on the language in the Draft Scoping Plan and not on any technical issues. I spent an inordinate amount of time evaluating technical issues associated with the Integration Analysis this year and prepared a summary that described all my comments. No comments associated with Integration Analysis technical methodology or errors were discussed at any of the Climate Action Council meetings and it is not clear that the Council members are even aware that specific integration analysis issues were raised. I have no illusions that my comments were necessarily important but the fact that technical comments from organizations responsible for the New York electric grid were also ignored is beyond troubling.
What’s Next
The political motivation for the Climate Act was we must do something to address the existential threat of climate change. In the political calculus the important thing was to establish a politically correct target and ignore implementation details. In New York the biggest missing piece was how to fund all the necessary components of the net-zero transition. When something similar comes to your state watch the bait and switch between supporting legislation that is subject to voter disapproval and agency regulation which is more or less at the whim of the Administration.
Next year the Department of Environmental Conservation (DEC) will promulgate enforceable regulations to ensure achievement of the Statewide GHG emission limits. The regulations will be based on the Scoping Plan framework. The Plan does not include a feasibility analysis so it is not clear how regulations can be promulgated when the implementation risks to reliability, affordability, and the environment are unknown. When questions arose about those nasty little details came up at Council meetings the response by the leadership was that the Scoping Plan was just an outline and those issues would be addressed later. I fully expect that when the regulations are discussed in the public consultatin process the nasty little details will be ignored because the Hochul Administration will say the Scoping Plan is a mandate of the legislation. The circular argument can only end badly.
Conclusion
The New York Scoping Plan approval vote will be on December 19. I predict that the vote will be overwhelmingly in favor of approving the Plan. Each council member will be given the opportunity to make a statement when they vote. I predict those statements will be laden with emotion and likely fact-free. I also predict that if the ideologues continue control the implementation process then costs will sky rocket, that there will be a catastrophic blackout that causes death and destruction, and that blanketing the state with wind mills and solar panels will cause significant environmental harm.
I will publish an update with the highlights of the meeting when they post the link to the meeting recording.
The Climate Leadership and Community Protection Act (Climate Act) final draft Scoping Plan framework for the transition plan has been released. It has become clear recently that the Hochul Administration approach to the net-zero transition is to follow the narrative that meeting a net-zero by 2050 target is simply a matter of political will. As with all political descriptions, the components of this narrative are overly simplified and conflicting information is ignored or disparaged. This post discusses the heat pump “solution” to home heating.
Everyone wants to do right by the environment to the extent that they can afford to and not be unduly burdened by the effects of environmental policies. I submitted comments on the Climate Act implementation plan and have written over 250 articles about New York’s net-zero transition because I believe the ambitions for a zero-emissions economy embodied in the Climate Act outstrip available renewable technology such that the net-zero transition will do more harm than good. The opinions expressed in this post do not reflect the position of any of my previous employers or any other company I have been associated with, these comments are mine alone.
Climate Act Background
The Climate Act establishes a “Net Zero” target (85% reduction and 15% offset of emissions) by 2050. The Climate Action Council is responsible for preparing the Scoping Plan that will outline how to “achieve the State’s bold clean energy and climate agenda.” In brief, that plan is to electrify everything possible and power the electric gride with zero-emissions generating resources by 2040. The Integration Analysis prepared by the New York State Energy Research and Development Authority (NYSERDA) and its consultants quantifies the impact of the electrification strategies. That material was used to write a Draft Scoping Plan that was released for public comment at the end of 2021. The Climate Action Council is required to finalize the Scoping Plan by the end of the 2022.
I have published a couple of recent articles about this process. I noted that the Climate Action Council treatment of stakeholder comments basically ignored anything that conflicted with the narratives of the Draft Scoping Plan so the Council lost the opportunity to correct any deficiencies. The second article pointed out that the Hochul Administration has not included responses to stakeholder comments in the process. As a result, it is not clear whether the issues raised were even considered.
The buildings sector is currently the largest source of greenhouse gas (GHG) emissions in New York State. As a result, reducing emissions from home heating is a key component of the Scoping Plan implementation framework. Heat pumps are a prominent part of the state’s residential electrification plans and its narrative that installing a heat pump is easy, cost-effective, and will provide a satisifactory level of comfort. If you are interested in more home heating background information, an article describing my interview with Susan Arbetter at Capital Tonight gave an overview of heat pump technology and described building shells. In the energy efficiency world, building shells refer to the insulation, infiltration, window treatments and ventilation components of the building.
Political narratives over-simplify their solutions and this is a major flaw in the heat pump story preached in the Scoping Plan and by its acolytes. Last summer I did an article about heat pump technology that concluded that it can work in New York State. However, I showed that it is not simply a matter of swapping out a fossil-fired furnace for a heat pump. The potential for the conversion to be done improperly is high because there are numerous complications. Based on a discussion with an expert HVAC technician I now understand that it is not just the furnace but the whole heating system and building shell that needs revisions too. The air infiltration, inflow, interior duct, and exhaust requirements are much higher priorities than I realized. Some of these issues are mentioned by the Hochul Administration in the Scoping Plan and the public education indoctrination public service advertising but the implications on heat performance are ignored.
This article addresses one detail of the residential home heating challenge that I believe did not receive proper emphasis in the Draft Scoping Plan. It is based on comments that I submitted that to this point have not been acknowledged. The Council has recently repeated its promise that comments will be acknowledged but has not clarified what that means. In particular, I am going to discuss the New York regional differences in climate presentation at the November 21, 2022 Climate Action Council meeting.
Council Presentation New York Regional Differences in Climate
During the buildings discussion of the staff response to Climate Action Council comments two slides were included. The discussion of the first slide explained the importance of cold temperatures for heat pump performance. Apparently, the Council asked why three regions were called out in the Draft Scoping Plan text as the coldest regions of the state. The presentation noted that the Draft said that the North Country, Mohawk Valley, and Capital regions are the coldest and went to say that heating systems there are designed to keep buildings warm even when temperatures fall below zero Fahrenheit.
The Hochul Administration narrative is that “These cold climate air source heat pumps do work well in New York’s climate” and this point was explicitly included in the presentation. The presentation mentioned the appropriate qualifiers shown in the figure that equipment quality, proper design and installation, envelope efficiency, and the temperature difference between indoors and outdoors also impact performance.
The presentation explained that Northeast Energy Efficiency Partnerships (NEEP) maintains a specification and product list that identifies specific air source heat pumps that work during extreme cold weather. The presentation noted that “in very cold conditions the heating capacity, or output from the heat pump efficiency drops.” The explanation noted that the NEEP list includes equipment that report the heating capacity at 5o F and meets or exceed a specified efficiency at that temperature.
The discussion of the regional differences in temperature claimed that in southern and coastal regions and along the Great Lakes the minimum winter temperatures stay above 5o F. The map on the preceding figure was used to show this visually. The implication was that as long as you use an air source heat pump from the NEEP product list that meets the 5o F criterion that you are good to go.
The next slide includes a table with 99% design values for heating capacity calculations. This is the outdoor temperature that a location stays above 99% of the hours in a year, based on a 30-year average. The presentation claimed that the North Country, Mohawk Valley, and Capital regions had the lowest heating design temperatures so that was the basis for their being listed in the text as the coldest regions.
Caiazza Comments on Residential Heating Electrification
My residential heating electrification comments on the Draft Scoping Plan noted that home electrification is a primary concern for New Yorkers given the importance of affordability and the impact to every household. The Draft Scoping Plan considers two aspects of residential heating electrification in Appendix G: Integration Analysis Technical Supplement. The first aspect is conversion of furnaces.The second aspect is the energy efficiency and building shell improvements necessary. In order to determine which technologies are needed for a particular location, the regional differences in climate within New York State must be considered. The Appendix G documentation includes NYSERDA climate zone categories for each county. As far as I can tell, these climate zones use the International Energy Conservation Code. As shown below there are only three climate zones and they are similar but not the same as the normal minimum January temperature map in the presentation described ablove.
Figure 1: New York State Climate Zones in the Integration Analysis
My written comments argued that there is a better, more detailed climate zone map for building shell upgrade estimates. The United States Department of Agriculture plant hardiness map has nine zones for New York (Figure 2). It uses the average annual extreme minimum temperature for its classification that I believe that is a better indicator for building shells when using heat pumps. Notably there are prominent differences that I believe make a more refined classification system appropriate. In my comments I argued that the average minimum is above zero for only two of the nine zones, corresponding roughly to Integration Analysis climate zone 3. I categorized this as zone 4. For the most part it appears that New York Climate zone 5 should correspond to NYSDA zones 6a and 6b. As a result, I limited zone 5 to the lower Hudson Valley and counties along the Great Lakes. I categorized all the counties in the Mid- and Upper Hudson Valley as zone 6 as well the counties along the Pennsylvania border except Chautauqua County along Lake Erie. If the average annual extreme minimum temperature is less than equal to -10oF (USFDA zones 3b, 4a, 4b, 6a, and 6b) then I believe another climate zone should be included. I categorized Allegheny and Cattaraugus counties as well as counties in the Adirondacks as climate zone 7 to meet this criterion.
Figure 2: USDA Plant Hardiness Map
My comments used this more refined climate zone categorization and found that the building shell categorization used in the Draft Scoping Plan underestimates the level of building shell upgrades needed for effective air source heat pump installations. The Draft Scoping Plan claims only 26% of New York residences need deep shell upgrades. I estimate that more than half will need to have deep shell upgrades. Consequently, the Integration Analysis cost estimates for electrifying residences significantly underestimates the costs and the ease of implementation for air source heat pumps.
Discussion
There has been no acknowledgement that my comments were made known to the Climate Action Council and certainly no indication that the Council considered them in their comments to the Agency Staff who are responsible for the final draft of the Scoping Plan. Nonetheless, there is a link between the response to the cold region question in the presentation at the November 21, 2022 meeting and my comments. My comment that a different approach (such as Figure 2) to define the appropriate heating technology requirements than the climate zones shown in Figure 1 was inadvertently confirmed by this presentation. In the presentation they showed a different graphic to describe the climatic differences and referenced an even better metric – the 99% design values.
I believe that a comparison of a map of the 99% design values and the plant hardiness zone map would show much better agreement than the NYSERDA climate map does to the 99% design values. I do not believe that the Integration Analysis did not used the 99% design values when they estimated the cold-climate air source heat pump requirements or the appropriate building shell upgrades necessary to make air source heat pumps effective in New York’s climate. I found that a better metric nearly doubled the number of residences that would have to be upgraded to a better building shell standard. The presentation did not mention the relevant issue that I brought up in my comments.
The Hochul Administration narrative is that cold climate air source heat pumps work well in New York’s climate and that is true but with a whole host of caveats that make a difference. Cold climate air source heat pumps all have a drop off in performance if the outside temperature gets cold enough. If the only consideration was the quality of the heat pump, then I believe the overarching issue would be the acceptability criterion. If the heat pump works acceptably 99% of the time that means there still are 87 hours a year when they will not provide sufficient heat. It would be useful to the public if the differences between the 99% design values and the plant hardiness zone maps were explained because the county-wide 99% design value may not be appropriate everywhere in the county. The greatest flaw in the Scoping Plan narratives is that “what if” questions are not addressed like what will happen when heat pumps are improperly installed and there isn’t sufficient heat.
Another aspect of political narratives is over-simplification. The presentation did include the appropriate qualifiers explaining that in addition to the heat pump other factors, like proper design and installation; appropriate specification of the design value; and envelope efficiency must be considered. The impact of these considerations and any related stakeholder comments was not discussed. In my opinion this furthers the incorrect impression that simply installing in a cold-climate air source heat pump is easy and effective.
Conclusion
The November 21, 2022 Climate Action Council meeting discussion of the cold regions of New York exposed several flaws in the Hochul Administration’s Draft Scoping Plan revision process. In response to the question about the cold regions a different description of the New York cold temperature climatology was used than what was in the Integration Analysis documentation. My comments on the Draft Scoping Plan argued that the Integration Analysis cold regions were not detailed enough and the choice of a different document supports that. In my opinion the heating 99% heating design values are an even better indicator of cold regions in New York.
I believe that a comparison of a map of 99% design values and the plant hardiness zone map I porposed would show much better agreement than the NYSERDA climate map does to the 99% design values. The important point is that the Integration Analysis did not use the 99% design values when they estimated the appropriate building shell upgrades necessary to make air source heat pumps effective in New York’s climate. I found that a better metric nearly doubled the number of residences that would have to be upgraded to a better building shell standard. The presentation did not mention the relevant issue that I brought up in my comments.
I conclude that the residential home heating plan proposed in the Scoping Plan under-estimates the degree of difficulty of this transition. The political narrative suggests that residential heating electrification is mostly just about installing heat pumps. However, proper design and installation, envelope efficiency, and the temperature difference between indoors and outdoors impact performance as much as the installation of a high-quality heat pump. The State is doing a disservice to the residents by not clearly acknowledging the complications for an adequate electric heat source. Finally, they have yet to propose a plan when heating is electrified and an ice storm knocks off power for days in the winter. It is very disappointing that my comments in this regard have been ignored.
The last several years I have spent an inordinate amount of time evaluating the Climate Leadership and Community Protection Act (Climate Act) and its legal mandate for New York State greenhouse gas emissions to meet the ambitious net-zero goal by 2050. I recently published an article describing some of the overarching issues that have not been adequately addressed in the transition plan to meet the net-zero goal. I used the Climate Action Council’s failure to protect prime farmland from utility-scale solar development as one example. This post highlights recently signed legislation and an announcement by Governor Hochul that provides further proof that when the government says we are here to help it is likely a day late and a dollar short.
Everyone wants to do right by the environment to the extent that they can afford to and not be unduly burdened by the effects of environmental policies. I submitted comments on the Climate Act implementation plan and have written over 250 articles about New York’s net-zero transition because I believe the ambitions for a zero-emissions economy embodied in the Climate Act outstrip available renewable technology such that the net-zero transition will do more harm than good. The opinions expressed in this post do not reflect the position of any of my previous employers or any other company I have been associated with, these comments are mine alone.
Climate Act Background
The Climate Act establishes a “Net Zero” target (85% reduction and 15% offset of emissions) by 2050. The Climate Action Council is responsible for preparing the Scoping Plan that will outline how to “achieve the State’s bold clean energy and climate agenda.” The Integration Analysis prepared by the New York State Energy Research and Development Authority (NYSERDA) and its consultants quantifies the impact of the strategies. That material was used to write a Draft Scoping Plan that was released for public comment at the end of 2021. The Climate Action Council is required to finalize the Scoping Plan by the end of the 2022.
In order to meet the net-zero target the general strategy is to electrify everything primarily using newly developed wind and solar resources. According to the NYISO 2021-2040 System & Resource Outlook there were 1,985 MW of land-based wind and 2,148 MW of solar in 2019. The Draft Scoping Plan spreadsheet Appendix G: Annex 2: Key Drivers and Outputs projects that in 2040 when all the electricity in New York must be zero emissions that there will be 12,242 MW of land-based wind and 43,342 MW of solar. I documented that the solar projects in the Article Ten queue in 2020 averaged 9.3 acres of equipment area per MW. Using that estimate of land required, the Draft Scoping Plan mitigation scenarios would require over 900 square miles of solar equipment.
This post explains why the state’s response to the impact of the land needed for these developments is too little and too late to prevent serious issues. I have written enough articles on solar siting issues that I have setup a page that summarizes them all. Given the massive amount of projected utility-scale solar generation capacity required to meet Climate Act goals the rush to develop solar projects could easily lead to the permanent loss of significant amounts of prime farmland that will hurt farming communities and endanger Climate Act strategies to sequester carbon in soil. Solar developers argue that a landowner gets revenue when a solar project is developed. However, when land is taken out of production it will reduce farm jobs and the economic activity may be improved during construction but once the facility is operational there are very few economic benefits to essential local businesses. Furthermore, taking the land out of production may make other farmers who have been renting that land to make their operations viable will not be able to support investments made in facilities, livestock, or equipment.
State Actions to Protect Farmlands
First, let me describe New York’s inaction. In a recent post describing the Climate Action Council’s transition plan approach I explained that there are already serious land use issues because there is no implementation plan in place. Because there is no policy regarding utility-scale solar siting requirements relative to prime farmland the developers are thumbing their noses at the Department of Agriculture and Markets. The Department has a policy in place to protect prime farmland but developers claim that there is “no statutory or regulatory support” for the policy so it can be ignored. The Hochul Administration permitting authorities have apparently placed renewable development as the highest priority without any assessment of the impacts identified by its regulatory agencies.
On December 12, 2022 Governor Hochul announced that “a special working group of state agencies and agricultural community stakeholders will collaborate to support New York farmers and help boost the agricultural industry”. The press release stated that “This working group will be critical to tackling several challenges within New York’s agricultural industry, and my administration will continue to work with farmers to address their needs and reimagine farming in our state.” The press release explains that:
The Task Force will initially focus on, but not be limited to, the following topics:
Transportation – address challenges involving the movement of agricultural commodities and products while understanding the needs for investment in roads, bridges and other vital infrastructure to bring products to market.
Labor – identify and build the next generation of farmers and farmworkers to support a diverse industry with the skills and workers required to operate modern farms.
The environment – address and remove obstacles to capital investments in manure management, on-farm energy production, and the transition to alternative fuel sources that limit the ability of some farms to meet the State’s climate goals and become carbon neutral.
Housing for workers – increase worker housing to provide workers with a safe living environment that is close to farms and assures for sustained and daily production.
Taxation – provide clearer guidance on property tax administration and improve access to existing tax relief programs.
Farmland protection – review existing programs and identify ways that the State can ensure that productive farmland remains accessible, in production, and continues to feed New Yorkers.
Expand procurement – of local food products by various state agencies to build local food supply chains and better connect with New York farms.
On December 6, 2022 Senate bill (S8889A) to create the Agricultural and Farmland Viability Protection Fund was signed. It will bolster efforts to protect agricultural land from being permanently removed from farming to make way for solar development. The press release for this states:
Currently, all solar projects receiving funding through NYSERDA’s NY-Sun incentive program that site projects on active farmland must pay a penalty, which currently goes into the State’s General Fund. S8889A-Hinchey requires that all penalty money collected be deposited instead into the new Agricultural and Farmland Viability Protection Fund and allocated to state and local farmland protection programs.
I apologize but I am not going to get into the details of this legislation. I applaud the intent to get the money where it should logically go to try to redress the problem. However, it does not seem likely that it will be much help to a farmer who lost the land he needed and was renting to a solar developer that can afford to pay more. Furthermore, NY-Sun is the state’s initiative to expand distributed solar so this law does not cover the utility-scale solar projects that are my primary concern.
The most frustrating thing is that a solution is readily available. Last December I described a webinar hosted by New Yorkers for Clean Power (NYCP) and Alliance for Clean Energy NY (ACENY) entitled “What’s the Deal with Renewable Energy & Agriculture?” that discussed the compatibility of renewable energy and agriculture in New York State. One part of the solution discussed during the presentation could be the New York State Energy Research & Development Authority Agricultural Technical Working Group. This group released an interim final report last May that described “strategies to integrate renewable energy sources into working landscapes with minimal impact on agriculture, including the need for more research; the potential for financial incentives; and proposed tools for State and local governments”. Protection of prime farmland is a prime component of this report.
Incredibly it gets even more tone deaf in New York. The NY-Sun program is New York State’s initiative to encourage distributed generation solar. The projects participating in the NY-Sun program are “typically five MW alternating current or smaller, and do not fit the definition of a Major Renewable Energy Facility”. The interim final report notes that:
On April 19, 2022, the Public Service Commission approved the Roadmap, charting a path towards achieving an expanded goal of at least 10 gigawatts of distributed solar by 2030 and continues the NY-Sun program. NY-Sun Commercial/Industrial (C/I) projects located in an agricultural district must comply with AGM’s Solar Construction Guidelines. If the project utilizes over 30 acres of MSG 1-4, it is required to make Agricultural Mitigation Payment to the fund administered by NYSERDA. Since being implemented, these requirements have already demonstrated their effectiveness. In 2021, all 50 distributed solar projects subject to these requirements, totaling 1,037 acres of affected area, have committed to avoiding and minimizing impacts to important agricultural lands in consideration of the solar layout and complying with the Solar Construction Guidelines.
The bottom line is that there is a solar siting policy that addresses my concerns in place but only for the small solar projects. Since I started tracking solar development project approvals late last year, a total of five applications have been approved for a total of 1,120 MW. The total project areas cover 14,812 acres and the project footprints total 5,728 acres. Despite the best efforts of Department of Agriculture and Markets staff to prevent the loss of Prime Farmland, the area that will be unavailable for farming in these projects totals 3,920 acres or 26% of the combined project areas. This is bad enough but all three Draft Scoping Plan mitigation scenarios call for over 40,000 MW of solar development and there are no protections.
Conclusion
Hochul’s press release for the special working group included statements of support from New York State Department of Agriculture and Markets Commissioner Richard A. Ball; New York Farm Bureau President David Fisher; Brian Reeves, President of the New York State Vegetable Growers Association; Tonya Van Slyke, Northeast Dairy Producers Association Executive Director; Jim Bittner, owner of Bittner Singer Orchards and Interim Director of the New York State Horticulture Society; and Jeffery M. Fetter, President of Scolaro Fetter Grizanti & McGough, P.C. and Chairman of the Business and Tax Practice and Agricultural Services Groups. If these people truly care about the agricultural sector, then they should demand a moratorium on utility-scale solar developments until a responsible solar siting policy is put in place for utility-scale solar development.
The moratorium would be lifted when the special working group develops policy recommendations. At a minimum that utility-scale solar developments should adhere to the Department of Agriculture and Markets goal for projects to limit the conversion of agricultural areas within the Project Areas, to no more than 10% of soils classified by the Department’s NYS Agricultural Land Classification mineral soil groups 1-4, generally Prime Farmland soils, which represent the State’s most productive farmland. It would be best if the same farmland protection criteria contained in the Public Service Commission distributed solar Roadmap were applied to all solar projects.
I have met people affected by these huge utility-scale solar projects. It is so frustrating that their concerns and the viability of neighboring farms are being ignored when there are protections in place for smaller solar projects when the solutions are in place for small projects. I wonder why and the only thing I can think of is that money talks.
The last several years I have spent an inordinate amount of time evaluating the Climate Leadership and Community Protection Act (Climate Act) and its legal mandate for New York State greenhouse gas emissions to meet the ambitious net-zero goal by 2050. Over the past two years I have watched with disbelief as the folks charged with developing the framework for the transition used their positions to push their personal agendas at the expense of the people of New York. Rather than addressing fundamental overarching issues, the Council has been bogged down arguing about emotional issues and details. This post describes the lost opportunities for the Council to improve, correct, or clarify the Scoping Plan so that the transition to net-zero will result in an affordable and reliable energy system with minimal adverse environmental impacts.
Everyone wants to do right by the environment to the extent that they can afford to and not be unduly burdened by the effects of environmental policies. I submitted comments on the Climate Act implementation plan and have written over 250 articles about New York’s net-zero transition because I believe the ambitions for a zero-emissions economy embodied in the Climate Act outstrip available renewable technology such that the net-zero transition will do more harm than good. The opinions expressed in this post do not reflect the position of any of my previous employers or any other company I have been associated with, these comments are mine alone.
Climate Act Background
The Climate Act establishes a “Net Zero” target (85% reduction and 15% offset of emissions) by 2050. The Climate Action Council is responsible for preparing the Scoping Plan that will outline how to “achieve the State’s bold clean energy and climate agenda.” The Integration Analysis prepared by the New York State Energy Research and Development Authority (NYSERDA) and its consultants quantifies the impact of the strategies. That material was used to write a Draft Scoping Plan that was released for public comment at the end of 2021. The Climate Action Council is required to finalize the Scoping Plan by the end of the 2022.
The meeting presentation for the 5 December 2022 Climate Action Council meeting described the remaining steps for 2022. The meeting discussed any final desired revisions to the draft of the Final Scoping Plan. One slide notes that the “Co-Chairs of the Council may make non-substantive, editorial or grammatical changes deemed necessary for clarity or accuracy of the Scoping Plan (e.g., correcting footnotes) prior to its publication”. They plan to share the Executive Summary the week of December 5 and the final version of the Scoping Plan for voting will be circulated the week of December 12. Voting is scheduled for December 19, 2022. The final Scoping Plan will be submitted to the Governor, the speaker of the Assembly, and the Temporary President of the Senate and made available to the public shortly after the voting meeting on December 19 on the Climate Act website.
In 2023 the Department of Environmental Conservation (DEC) will promulgate enforceable regulations by the end of the year to ensure achievement of the Statewide GHG emission limits. That process will include public workshops and consultation with the Climate Action Council, the Environmental Justice Advisory Group, the Climate Justice Working Group, representatives of regulated entities, community organizations, environmental groups, health professionals, labor unions, municipal corporations, trade associations and other stakeholders. At least two public hearings and a 120-day public comment period must be provided. Only after this extensive stakeholder process concludes is DEC authorized to propose the 2024 Implementing Regulations.
This is a very ambitious schedule and it will be hampered by the fact that the Scoping Plan is only a framework. It does not include a feasibility analysis so it is not clear how regulations can be promulgated when the risks to reliability, affordability, and the environment are unknown. Without that information a regulated schedule for transition components runs the risk of unacceptable impacts. There are already obvious issues associated with the lack of an implementation plan. Finally, the cumulative environmental impact statement mandated by state law has not been updated to incorporate the latest estimates of the resources necessary for the net-zero transition. This post will address these three lost overarching opportunities for the Climate Action Council.
Climate Action Council
The Climate Act established the Climate Action Council to develop the Scoping Plan. It consists of 22 members that were chosen by ideology not expertise. There are 12 agency members and 10 at-large members: two non-agency representatives appointed by the Governor, three representatives appointed by the Speaker of the Assembly, one representative appointed by the minority leader of the Assembly, three representatives appointed by the Temporary President of the Senate, and one representative appointed by the minority leader of the Senate. The upcoming vote on the Scoping Plan must pass by a super majority of 15 votes. Note that the Governor has 14 appointees on the Council: all the agency heads and two direct picks.
I am very disappointed by the response to comments. The comment period ran from the beginning of the year to early July, but it was treated as an obligation not as an opportunity to improve, correct, or clarify the Scoping Plan. If they were serious about addressing comments then the process would have been on-going from the start of the year. Staff should have been reviewing comments as they came in and categorizing them. For example, some comments addressed specific non-controversial problems such as typographical errors. Others addressed specific methodological issues in the Integration Analysis. Because those had a direct bearing on the veracity of the Draft Scoping Plan they should have been summarized and responses developed for Council review and consideration. Instead, the staff presented the Council with summaries of the themes of the comments submitted.
The political theater of the public comment period included eleven Public Hearings where 700 people spoke. Approximately 35,000 comments were received but around 25,000 comments were “potentially the same or substantially similar”, i.e., form letters. That left on the order of 10,000 unique comments and it was obviously impossible for the Council members to read them all. As a result, agency staff had to read, categorize, and summarize all the comments. It appears that agency staff who were charged with reading them did not start in earnest until the end of the comment period so the very real issues associated with processing got short shrift. Publicly all I saw was presentations to the Council that listed themes of the comments with very little specificity and it is not clear if other documentation was available to the Council. There was clear bias in the theme presentations – anything inconsistent with narrative was disparaged, downplayed, or ignored. No comments associated with Integration Analysis methodology or errors were discussed at any of the Climate Action Council meetings and it is not clear that the Council members are even aware that specifc integration analysis issues were raised.
I think that the Hochul Administration decided early on to treat stakeholder comments only as an obligation. At one of the Council meetings, it was stated that all comments would be “acknowledged” and they promised to make the comments available to the public. During the last attempt to develop a New York Climate Plan the State provided a copy of all the comments and a response to each one of them. I am sure that the State will argue that they were overwhelmed by 10,000 unique comments but on the other hand they are proposing to completely change the energy system of the state and commit New Yorkers to higher costs and significant reliability risks. I thought that they would do something similar to the previous program but there is no sign that is the case. The comments are not even publicly available at the same time the revised draft of the Scoping Plan has been finalized. It is a slap in the face to all the people who submitted comments that it appears that there will be no acknowledgement of their concerns until the Scoping Plan is completed. What better way to say “we don’t care and you don’t matter.”
Lost Opportunities
Regrettably, the Climate Action Council actions over the last 12 months have concentrated on specific political narratives. The Hochul Administration’s narrative is appeasement of the constituencies that view as their political base. For example, in the presentations on comments received, specific comments raised by the Climate Justice Working Group were addressed. There was no similar acknowledgement of comments from the New York Independent System Operator on the vitally important electric grid. The revisions to the Draft Scoping Plan appear to be more reflective of the issues raised by the ideologues on the Council than anything submitted by stakeholders. The staff presentations describing stakeholder comments were quick to acknowledge numbers that supported the ideological narrative and were quicker to disparage anything that did not even if there were many comments making the point.
The result is that the focus of the Council has been on specifics, and only parts of the specifics, but not overarching issues. This section will describe the lost opportunities for my three major concerns: reliability, affordability, and environmental impacts.
Reliability
One of the more frustrating aspects of the last year is the presumption of expertise by some Climate Action Council members who have no relevant background or experience on topics on which they confidently preach. Astoundingly, when it comes to electric grid reliability, they have gone so far to state anyone who disagrees with them is a mis-informer. For example, Paul Shepson, Dean, School of Marine and Atmospheric Sciences at Stony Brook University, (starting at 23:39 of the 26 May 2022 Council meeting recording said:
Mis-representation I see as on-going. One of you mentioned the word reliability. I think the word reliability is very intentionally presented as a way of expressing the improper idea that renewable energy will not be reliable. I don’t accept that will be the case. In fact, it cannot be the case for the CLCPA that installation of renewable energy, the conversion to renewable energy, will be unreliable. It cannot be.
Robert Howarth, Professor, Ecology and Environmental Biology at Cornell, starting at 32:52 of the recording) picked up on the same issue. He said that fear and confusion is based on mis-information but we have information to counter that and help ease the fears. He stated that he thought reliability is one of those issues: “Clearly one can run a 100% renewable grid with reliability”, although he did admit it had to be done carefully.
Two quotes from a recent New York Independent System Operator presentation directly contradict them: “Significant uncertainty is related to cost / availability of Dispatchable Emissions Free Resource (DEFR) technologies, as well as regulatory definition of ‘zero-emissions’ compliant technologies” and “Some scenarios do not represent realistic system performance but are helpful in identifying directional impacts and sensitivity to key variables”. I have explained that is as close as a technical report can come to saying this won’t work as you can get without actually saying it. For more information about the required but currently unavailable DEFR technologies see my DEFR page.
DEFRs that provide sustained on-demand power and system stability will be essential to meeting policy objectives while maintaining a reliable electric grid. While essential to the grid of the future, such DEFR technologies are not commercially viable today. DEFRs will require committed public and private investment in research and development efforts to identify the most efficient and cost-effective technologies with a view towards the development and eventual adoption of commercially viable resources. The development and construction lead times necessary for these technologies may extend beyond policy target dates.
I recently gave a presentation describing my skeptical concerns about the Climate Act. I wrote it as if I were trying to persuade folks like Shepson and Howarth that there are legitimate reliability concerns. In my blog post summary of that presentation, I described the basics of the electric grid making the point that our electric grid system has taken decades to reach the current reliability levels using resources that can be dispatched as needed. A system that relies on wind and solar needs DEFR to provide the operators with an option to match load when it is needed the most. I believe that all the experts who are responsible for electric reliability are concerned that a plan that relies on any technology that is not commercially viable today to replace resources by 2040 has significant inherent risks.
I am disappointed that the Hochul Administration did not make it clear that debating reliability arguments were beyond the scope of the Council. They should have accepted the input of the organizations responsible for electric grid reliability that warn there are issues. Rather than debating whether there are risks, the Climate Action Council should have been discussing what they should be doing about that risk. The biggest question is whether any reduction in reliability standards is acceptable in order to meet the Climate Act transition to net-zero targets. Most of the expert concern revolves around the aggressive schedule. The Council should have discussed whether a conditional schedule based on the availability of DEFR might be necessary and made recommendations for the criteria that should be used to determine whether that is necessary.
Affordability
If the Hochul Administration would bother to ask the public about the Climate Act I suspect the first question that the public wants answered is how much is this going to cost? It is amazing that the only information provided to the Council and public was the claim that the costs of inaction are greater than the costs of action based on various versions of the following figure. There is no documentation for the expected specific costs and emission reductions of the control strategies proposed so very little meaningful critiques are possible. The Council should have demanded better documentation than what was provided.
My comments eviscerating their claim that the costs of inaction are greater than the costs of action is the most egregious example of irresponsible replies to stakeholder comments. I made verbal comments at the Syracuse Draft Scoping Plan public hearing on April 26 and submitted written comments that explained why the costs of inaction are greater than the costs of action claim based on this figure are misleading and inaccurate. I followed up later with a more detailed explanation in another submitted written comment. There is no way that the reviewers of the written comments or the members of the Council that were present at the Syracuse can say that they were not aware of my comments.
I am sure that they were ignored because they destroy the narrative. The claim is misleading because the values shown are relative to the Reference Case rather than a Business-as-usual case that is usually used in these analyses. The Reference Case includes the Statewide zero-emissions vehicle mandate among other things because it is “already implemented.” Does anyone really believe that the zero-emissions vehicle mandate is anything but a necessary component of the Climate Act costs? Excluding that program alone means that $700 billion in costs are not included in the costs for the Climate Act shown in the figure. Furthermore, the benefits incorrectly count the societal benefits of avoided carbon emissions multiple times. The claimed $235 to $250 billion in those benefits should be no more than $60 billion. If just those two “tricks” are corrected then the costs far exceed the benefits.
Obviously, this is a basic underlying presumption of the Draft Scoping Plan that the Council should have discussed. My claims should have been described and the authors of the Integration Analysis should have been held accountable to explain why they did what they did and why they disagree with my arguments. Only then could the Council discuss and decide whether this claim is appropriate.
There is a bigger problem however. Every jurisdiction that has tried to implement a similar transition plan has seen significant price increases of electricity. The Climate Act Council should have discussed affordability. If the costs exceed some threshold, then I believe there should be a response. It is up to the Council to define that affordability threshold. The NY REV Energy Affordability Policy intends to limit energy costs to no more than 6% of income as per the 2016 order from the Public Service Commission. The Council should have determined where the State stands with respect to this metric now. I have tried multiple times to find where the state stands relative to this or any other energy poverty metric but have been unable to find it. The Council should have demanded that this metric be made readily available so that it can be tracked as the transition plan progresses. Then their discussion could have turned to the “what if” question if the metric gets worse what should be done.
I am also disappointed that the Council did not work with the Climate Justice Working Group on the topic of affordability for those least able to afford energy price increases. For all the social justice concerns addressed why wasn’t prevention of regressive energy price increases a priority. The poor will be hit hardest by any energy price increase and there was nary a peep of concern. There should have been a push to provide the energy poverty metric determined by census tract so that any disproportionate impacts on disadvantaged communities could be tracked and addressed.
Environmental Impacts
The complete lack of concern relative to the cumulative environmental impacts of the massive amounts of wind, solar, and energy storage required for the net-zero transition is another disappointment. On September 17, 2020 the Final Supplemental Generic Environmental Impact Statement (SGEIS) for the Climate Leadership and Community Protection Act was released. I estimated that the Draft Scoping Plan calls for at least 497 more onshore wind turbines, 493 more offshore wind turbines and 602 more square miles covered with solar equipment than was considered in that cumulative impact statement. In addition, the environmental impacts of battery energy storage were not addressed and it is impossible to project the impacts of the environmental impacts of the dispatchable emissions-free resource that it included in the capacity projections because a technology has not been specified. I commented that an updated impact statement that addresses all these issues is necessary but this topic was not mentioned as a theme at Council meetings.
The Climate Action Council should have considered whether thresholds for unacceptable cumulative environmental impacts are appropriate. I believe that without addressing this problem that it is likely that the environmental impacts from the massive wind and solar resource developments will have far worse impacts than anything that can be ascribed to climate change caused by New York emissions but this issue was never discussed. For example, I project that at least 216 Bald Eagles could be killed every year when there are 9,445 MW of on-shore wind. There were 426 occupied bald eagle nest sites in New York in 2017. I am not a wildlife biologist but those numbers indicate to me that there will be major threats to the survivability of Bald Eagles in New York. I recommended that the Final Scoping Plan include proposed thresholds for unacceptable environmental impacts like this but the comment was never mentioned as a theme at the Council meetings.
There is another environmental impact aspect that I think the Council should have addressed. I have written enough articles on solar siting issues that I have setup a page that summarizes them all. I became aware of the particular issues of utility-scale solar development on agriculture after I had a couple of people contact my blog describing issues that they had and suggested that I look into the issue. The problems that they raised are real, the solutions are available, but in the rush to develop as many renewable resources as quickly as possible, the Hochul Administration has dropped the ball on responsible utility-scale solar development. Given the massive amount of projected utility-scale solar generation capacity required to meet Climate Act goals the rush to develop solar projects could easily lead to the permanent loss of significant amounts of prime farmland that will hurt farming communities and endanger Climate Act strategies to sequester carbon in soil.
I submitted a comment to the Council in March calling for a moratorium on utility-scale solar siting in March but that too has been ignored. Since I started tracking solar development project approvals last year, a total of five applications have been approved for a total of 1,120 MW. The total project areas cover 14,812 acres and the project footprints total 5,728 acres. Despite the best efforts of Department of Agriculture and Market staff to prevent the loss of Prime Farmland, these projects were approved and the prime area lost for farming in these projects totals 3,920 acres or 26% of the combined project areas. This is bad enough but all three Draft Scoping Plan mitigation scenarios call for over 40,000 MW of solar development so imagine how much more prime farmland will be lost if nothing changes. The Climate Action Council should have addressed this issue and decided whether responsible solar siting guidelines similar to the policy option roadmap for the proposed 10 GW of distributed solar development should be instated. As a result of Hochul Administration inaction there will be significant and irreplaceable loss of prime farmland and damage to farming communities across the state.
There is another aspect of this that the Council should have addressed. The New York State Department of Agriculture and Markets (AGM) “discourages the conversion of farmland to a non-agricultural use”. With respect to utility-scale renewable energy projects, “The Department’s goal is for projects to limit the conversion of agricultural areas within the Project Areas, to no more than 10% of soils classified by the Department’s NYS Agricultural Land Classification mineral soil groups 1-4, generally Prime Farmland soils, which represent the State’s most productive farmland”. The latest solar development permit application that was approved included this response to AGM concerns:
In addition, no statutory or regulatory support is cited for AGM’s proposed 10% or less Prime Farmland soil conversion “goal” that “the production of food is more essential than the generation of [renewable] electricity,” or that soil classifications 1-4 should be avoided, even if it means interfering with the development of a renewable facility contracted to sell renewable energy credits to NYSERDA. The Certificate Conditions conserve and protect agricultural lands; it is the responsibility of AGM, and not private solar developers, to encourage the development of farming. That charge cannot be used to thwart the renewable energy goals of the State.
While Council members spent time arguing over their personal agenda issues out-of-state developers are coming into the State throwing up as much renewable energy as possible completely disregarding the New York regulatory agencies charged with protecting the State’s larger issues. The Hochul Administration has apparently placed renewable development as the highest priority without any assessment of the impacts identified by its regulatory agencies. The Council should have discussed whether the agencies will be allowed to do their jobs and protect the interests of the state as a whole or will be muzzled and ignored all in the name of the Climate Act.
There is one final point that I raised in comments that the Council has apparently never addressed. New York’s contribution to global emissions of greenhouse gases is too small to expect that there will be any measurable improvement to the alleged effects of climate change on New York. Moreover, as shown in the following graph New York’s emissions have been consistently less than the global increase in emissions since the early 1990’s. I found that New York’s emissions are less than one half of one percent of global emissions and that the average increase in global emissions is greater than one half of one percent. In other words, even if we eliminate our emissions the increase in global emissions will be replace them in less than a year. Considering this information, Why is not a conditional and measured transition approach warranted? Why didn’t the Council consider these tradeoffs.
Conclusion
I spent a lot of time preparing comments on the Draft Scoping Plan trying to improve, correct, and clarify it so that the transition to net-zero will more likely result in an affordable and reliable energy system with minimal adverse environmental impacts. I have seen absolutely no sign that the Hochul Administration ever had any intention of making changes to the Scoping Plan framework for the future energy system based on comments that ran contrary to their politically driven agenda. There are no indications that any of my comments made it past the agency staff screening step to reach the Climate Action Council membership for consideration.
The Climate Action Council revisions to the Draft Scoping Plan has focused on details and ignored overarching issues. If the Council were truly doing its job, they would be working with the New York Independent System Operator and the New York State Reliability Council to determine if the current reliability standards are adequate or must modified for the future electric grid. If the Hochul Administration was truly worried about disadvantaged communities they would have required the Council to recommend an energy poverty metric and would have set up a clear and transparent tracking system for it at the census tract level. If Co-Chair of the Council and DEC Commissioner Basil Seggos took his responsibility for the environment seriously, he would have had a cumulative environmental impact statement completed that addressed the Integration Analysis projected renewable resource development levels and had the Council discuss environmental impact acceptability thresholds. If Co-Chair of the Climate Action Council and President of the New York State Energy Research & Development Authority Doreen Harris wanted her organization to provide objective information and analysis, the issues I raised relative to the misleading and inaccurate cost benefit analysis would have been addressed by the Council. If Council member and Commissioner of the Department of Ag and Markets Richard Ball truly cared about New York farms he would have demanded a responsible solar siting policy for utility-scale solar development that protects prime farmland.
The Hochul Administration’s treatment of the stakeholder comments has been an insult to anyone who took the time to develop comments. This does not portend well for the public consultation process mandated for next year. Unfortunately, the ultimate issue is that if the zero-emissions electric grid plan is inadequate because the Council ignored critical issues raised by stakeholders, people will freeze to death in the dark.


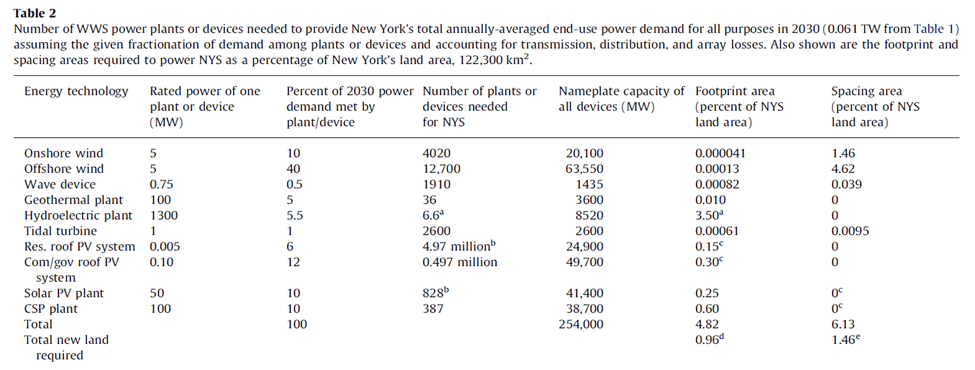

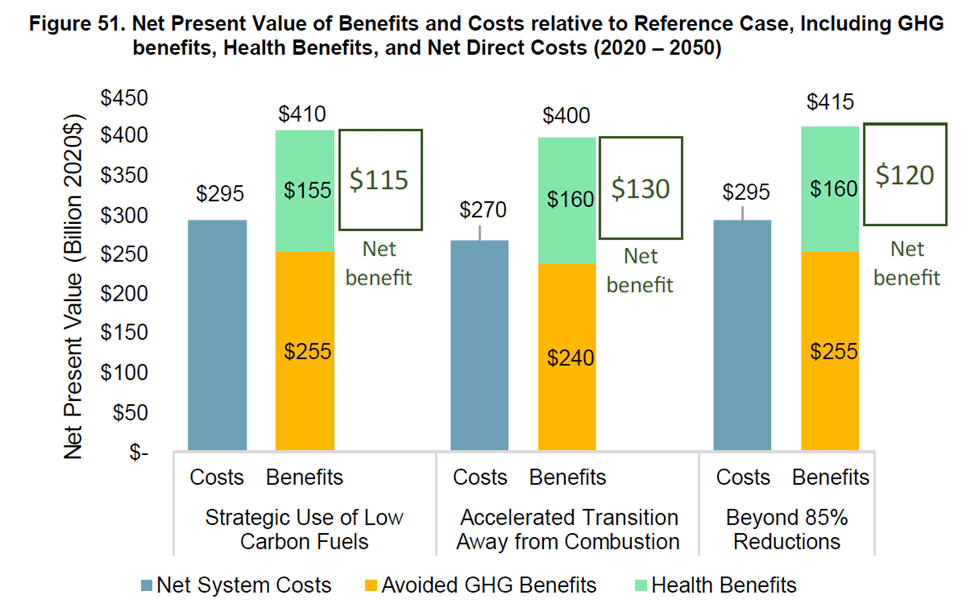
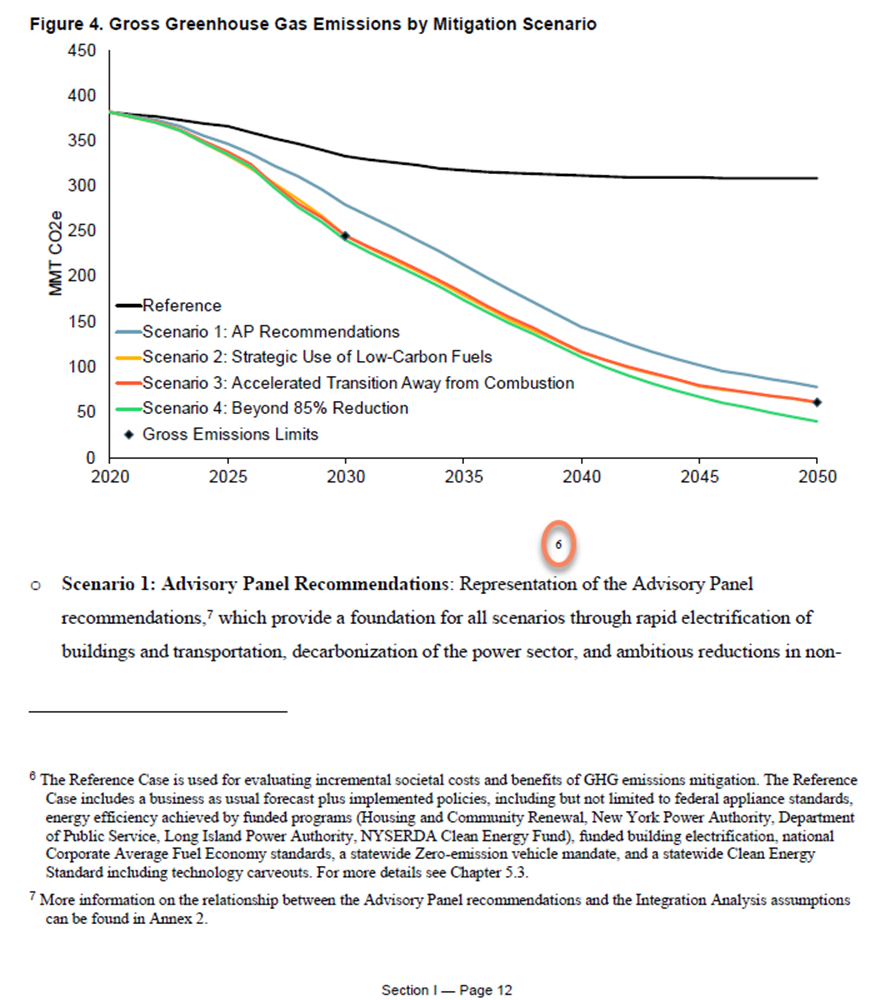
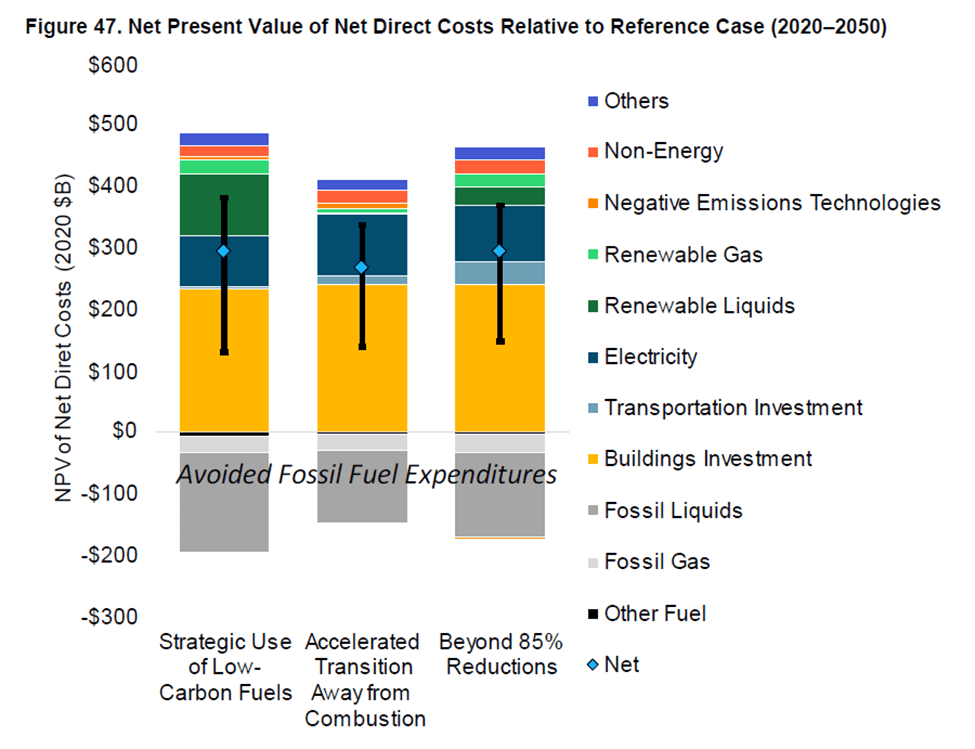
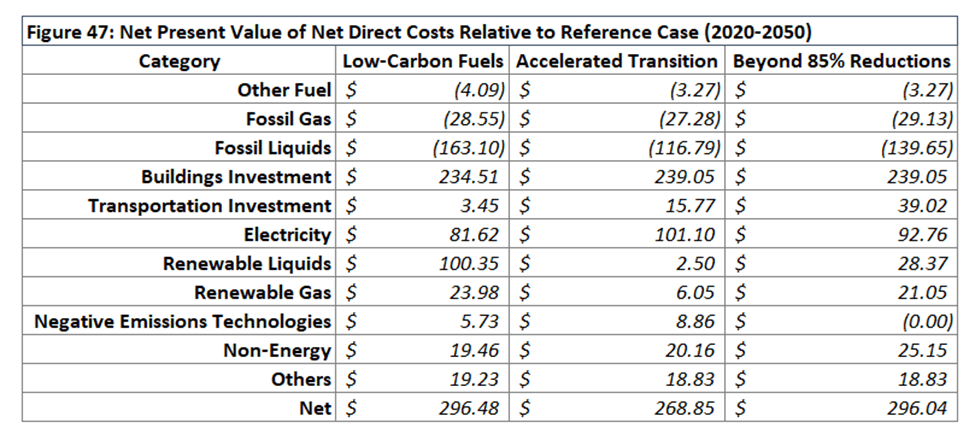
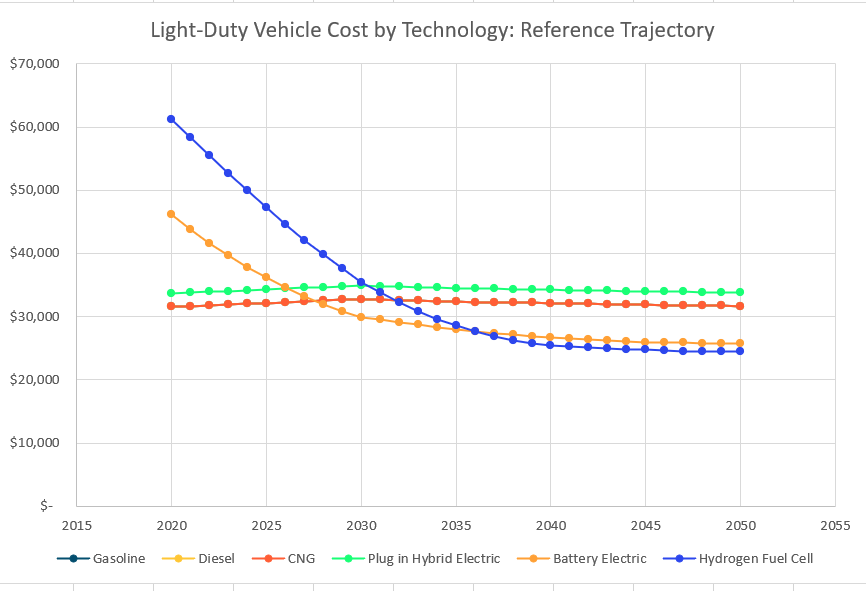
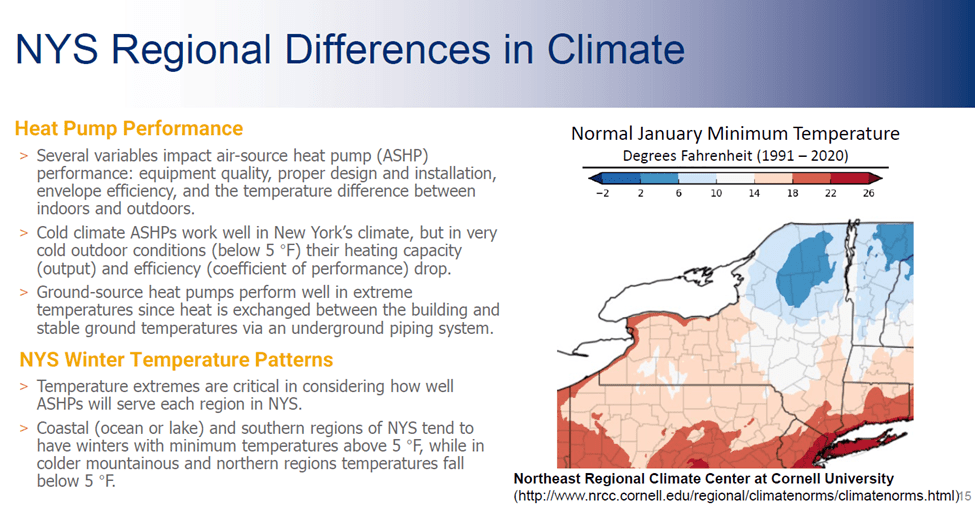
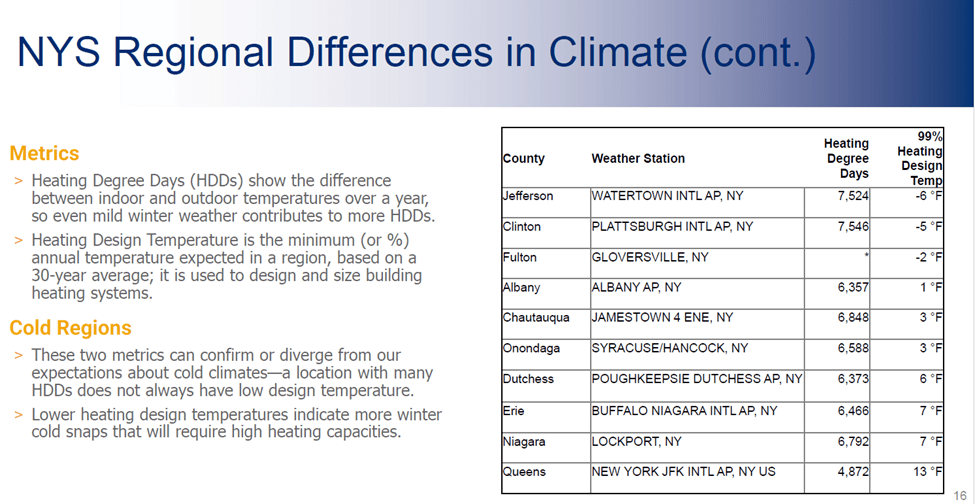
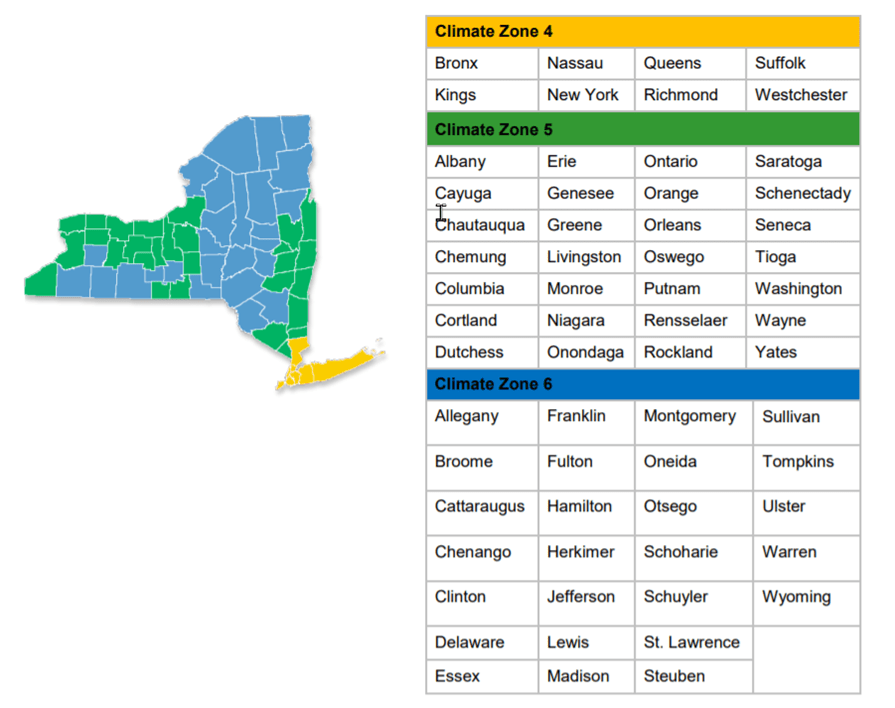
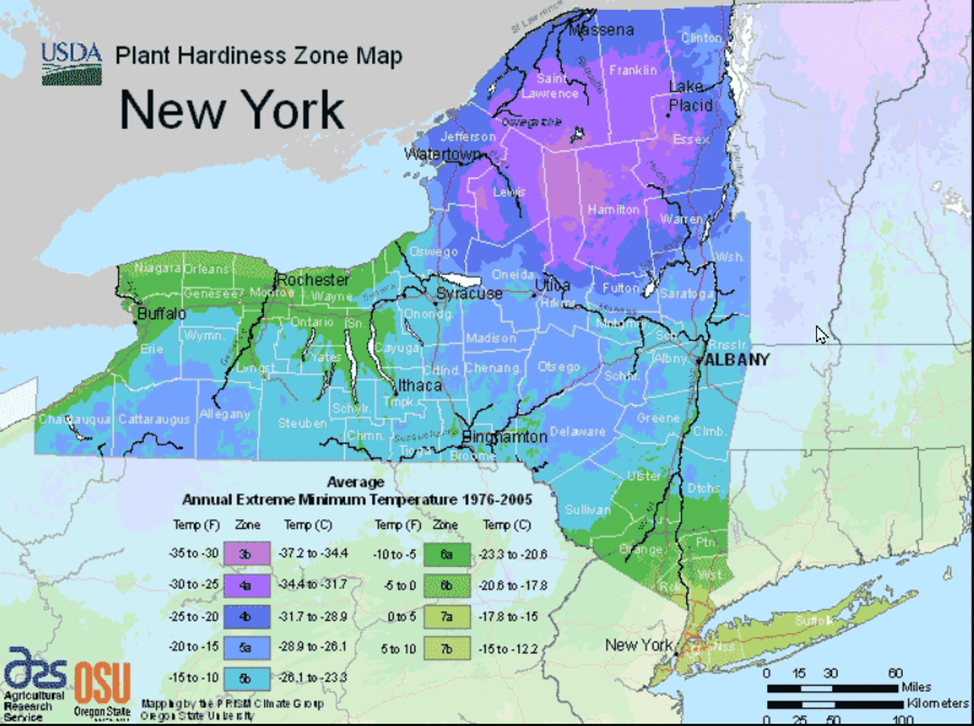
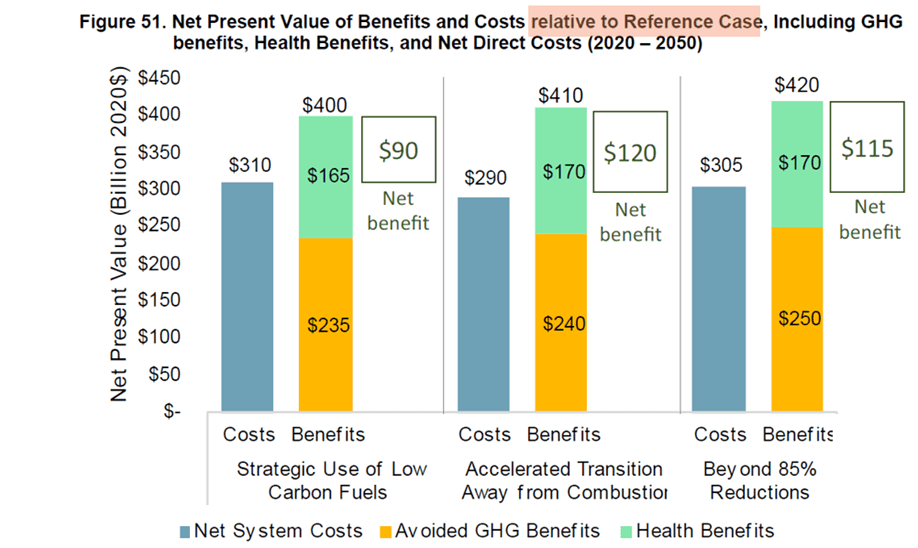
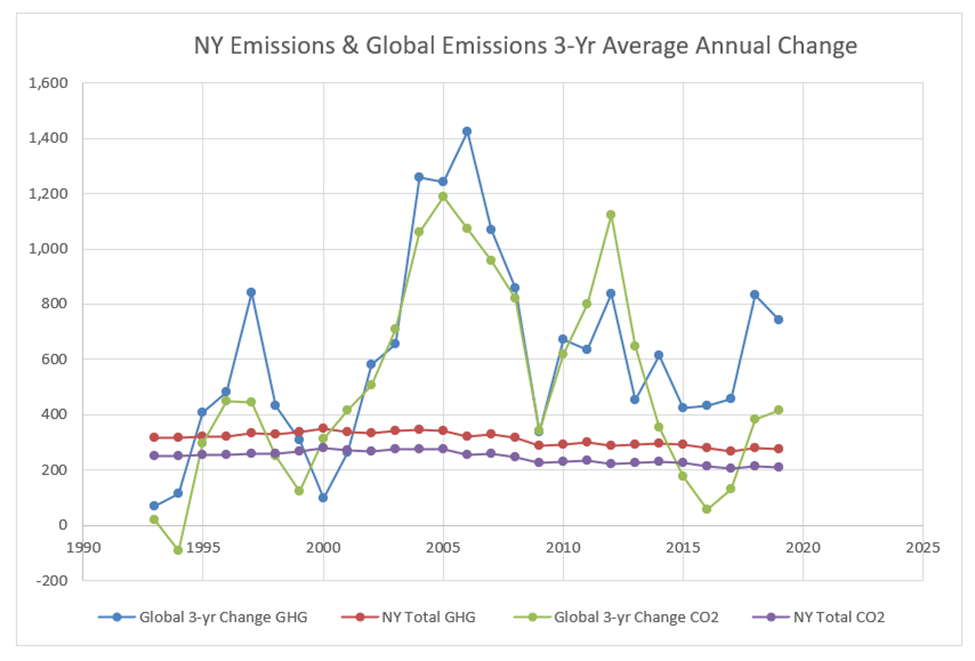
