NYISO Short-Term Assessment of Reliability October 2025 – Peaker Recommendations

On October 13, 2025 the New York Independent System Operator (NYISO) released its quarterly assessment of reliability of the bulk electric system.  I recently published an overview of the report that mentioned I was uncomfortable about some aspects of the recommendations.  This post describes the unique reliability rules for New York City that I think were not fully addressed relative to the replacement of New York City (NYC) peaker units. 

I am convinced that implementation of the Climate Act net-zero mandates will do more harm than good because of reliability and affordability risks.  I have followed the Climate Act since it was first proposed, submitted comments on the Climate Act implementation plan, and have written nearly 600 articles about New York’s net-zero transition.  The opinions expressed in this article do not reflect the position of any of my previous employers or any other organization I have been associated with, these comments are mine alone.

STAR Report and New York City

The NYISO 2025 Quarter 3 Short-Term Assessment of Reliability (STAR report) was released on October 13, 2025. If you want background information about the report I refer you to my take and what Richard Ellenbogen had to say. 

Environmental Justice organizations have made peaking power plants in New York City into an overblown issue, insisting that all peaking power plants must be shut down as soon as possible.  Even though the presumption of egregious harm from these plants is based on selective choice of metrics, poor understanding of air quality health impacts, and ignorance of air quality trends, pressure by this special interest constituency resulted in the Build Public Renewables Act of 2023 (BPRA) that mandates shutdown of New York Power Authority peaking power plants by 2030.  The NYPA units are state of the art, highly efficient, extremely low emissions, and only 27 years old. 

The STAR report findings of interest for this post relate to two old, inefficient, and high emitting peaking turbine facilities that were supposed to be retired earlier based on a Department of Environmental Conservation (DEC) rule if the shutdown did not threaten reliability.   The STAR report explains:

In this 2025 Quarter 3 STAR, the Gowanus Gas Turbine 2-1 through 2-8, Gowanus Gas Turbine 3-1 through 3-8, Narrows Gas Turbine 1-1 through 1-8 and Narrows Gas Turbine 2-1 through 2-8 units (collectively “Gowanus and Narrows”) have completed their generator deactivation notices and are now all Initiating Generators, requiring the NYISO and Con Edison to evaluate in this STAR if there are any Generator Deactivation Reliability Needs.

The STAR report identified a short-term reliability need beginning in summer 2025 within New York City primarily driven by a combination of forecasted increases in peak demand and the assumed unavailability of certain generation in New York City affected by the DEC regulation to limit emissions of nitrogen oxides, known as the “DEC Peaker Rule”.  The report states:

In accordance with the DEC Peaker Rule, the Gowanus and Narrows generators may extend operation for up to an additional two years (until May 1, 2029) if the NYISO or Con Edison determine that the reliability need still exists and a permanent solution has been identified and is in the process of construction but not yet online. The DEC Peaker Rule, however, does not provide for peaker generators to continue operating after this date without meeting the emissions requirements.

This STAR report concluded these facilities are needed until Bulk Power Transmission Facilities (BPTF) can replace them. 

NYC Reliability Rules

Before discussing the Bulk Power Transmission Facilities (BPTF) solution it is necessary to understand the unique reliability rules in NYC.  I acknowledge the use of Perplexity AI to generate a summary of these rules.  The reason for these rules is that NYC is a load pocket and within the City there are areas that are also considered load pockets.  To keep the lights on the following rules have been implemented:

  • Locational Capacity Requirements Framework – This rule establishes a minimum amount of capacity relative to the expected peak load.
  • Reliability Rule G.1: New York City System Operations – This rule includes a set of more stringent requirements than used in the rest of the state. 
  • Reliability Rule G.2: Loss of Gas Supply – New York City – This rule requires the system to be operated so that the loss of a single gas facility does not cause a blackout.  To meet this rule gas-fired units in the City must be able to burn liquid fuel.

STAR Solutions

This STAR report concluded that the Gowanus and Narrows facilities are needed until BPTF can replace them.  A BPTF is basically all the components of the transmission system (lines, transformers, and control systems) needed to move large amounts of electricity to where it is needed.

Consistent with the findings in 2023, this STAR continues to find that the New York City locality (Zone J) would be deficient in the summer through the entire five-year horizon without the completion and energization of future planned projects. This includes deficiencies on the BPTF and non-BPTF within Zone J.

Keep in mind that these facilities are needed to provide power during system peak loads.  There are four future BPTF projects described as components of the solution.

Gowanus-Greenwood 345/138 kV feeder – This project will upgrade the electric grid to resolve a local problem in NYC.  I do not see any issues with this project.

Champlain Hudson Power Express, 1,250 MW HVDC – This project brings hydropower from Quebec through a dedicated transmission line to NYC.  When it first was proposed the peak loads were in the summer.  The contract does not guarantee power from Hydro Quebec if it is needed within the province.  In the future of the Climate Act, peak loads will shift to the winter when New York winter peak loads increase due to heating electrification. Because this is when Quebec peak loads occur there is a high probability that power will not be available when NYC needs it.  I am not sure how the reliability rules will handle that contingency.

Empire Wind, 816 MW offshore wind –  According to Perplexity AI, this project is “under active construction and approximately 40% complete as of fall 2025. The project is progressing toward its targeted commercial operation date of 2027.”  Summer peak loads occur during heat waves and the meteorological conditions that favor the warmest temperatures are high pressure systems that cause light winds.  Those conditions will undoubtedly reduce offshore wind output.  Without sufficient storage this facility will not provide anywhere near 816 MW of power when it is needed most.

Propel NY Public Policy Transmission Project According to Perplexity AI, is a major electric transmission infrastructure initiative developed jointly by the New York Power Authority (NYPA) and New York Transco LLC to strengthen the electric grid and enable greater renewable energy delivery across southeastern New York State.  The infrastructure creates transmission capacity to deliver at least 3,000 megawatts (MW) of offshore wind energy from Long Island into the broader New York grid,  This has the same limitation as the Empire Wind project.  Without storage it will not provide energy when needed most.  In addition, there are issues associated with additional offshore wind development that suggest that 3,000 MW of offshore wind is unlikely.

The STAR report explains that these projects could address the identified reliability needs. Note however that there is a caveat that these projects must “demonstrate their planned power capabilities before the Gowanus and Narrows generating stations can be retired.”  Even then the STAR report mentions potential issues:

The range in the demand forecast for expected weather is driven by key assumptions, such as

population and economic growth, energy efficiency, the installation of behind-the-meter renewable energy resources, and electric vehicle adoption and charging patterns.

Once CHPE, Empire Wind, and the Propel NY Public Policy Transmission Project enter service and demonstrate their planned power capabilities, the margins improve substantially assuming all existing generators remain available, but gradually erode as forecasted demand for electricity grows. Even with the future planned projects delivering power according to schedule, there remains a risk of a Zone J deficiency in summer 2029, following the deactivation of Gowanus and Narrows, assuming all other generators in Zone J are available.

In my overview article on the STAR report I noted that there were issues associated with timing issues associated with the DEC Peaker Rule retirement deadline of May 1, 2029.  In my opinion,I think it is unlikely that in-kind replacements will be available by the May 1, 2029 deadline and that means the regulation must be modified. 

The Build Public Renewables Act of 2023 compounds the problem requiring retirement of New York Power Authority (NYPA) peaking plants.  The STAR report notes that “Beyond 2030, these deficiencies are further exacerbated with increasing demand for electricity and the planned deactivation of the NYPA small plants.”

Discussion

Although NYISO has become increasingly more vocal about the challenges meeting peaking load in the absence of natural gas peaker generating units, I am uncomfortable with the proposed BPTF projects proposed to solve the Gowanus and Narrows energy shortfall. 

The primary reason for the unique NYC reliability rules is experience with blackouts.  For example, the NYC blackout of July 1977 occurred when a storm knocked out transmission lines coming into the city and there was insufficient in-city generation to keep the system going.  Reliability Rule G.1 includes provisions for special operating rules during severe weather, enhanced operating reserves, and operating the system for a more stringent shutdown contingency that address the problems that led to the blackout.

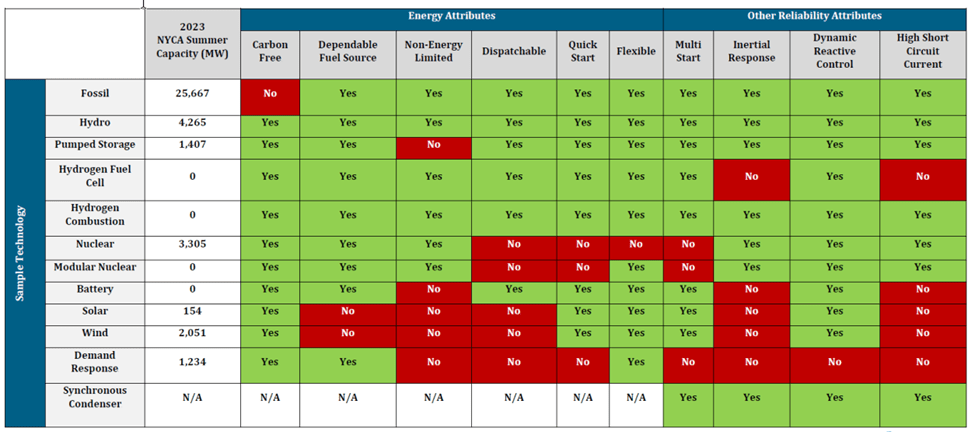
I have great respect for the state’s electric resource planners.  The electric system has been called the most complex machine because it is an extraordinarily intricate and vast network involving thousands of generating plants, millions of miles of transmission and distribution lines, and hundreds of millions of users continuously relying on it.   The NYISO operators balance load and generation on a second-by-second basis, and the resource planners have provided the resources necessary for them to prevent blackouts.  Those peaking units s all provide dispatchable power without weather limitations and provide other ancillary electric system services precisely where needed.  Losing those resources makes the challenges even more difficult.

The STAR report warns that the grid is at a “significant inflection point” with converging threats including an aging generation fleet, rapid load growth, and difficulty developing new supply resources due to policy constraints, supply chain issues, and rising equipment costs.  In the future Climate Act grid, the renewable resources are going to require Dispatchable Emissions Free Resources (DEFR) during dark doldrums when wind and solar resources are low to non-existent for extended periods to ensure that sufficient energy is available.  Complicating the challenge is the fact that those conditions are also associated with extreme temperatures and peak loads.  These factors all tweak the system in complex ways that may be too complicated to anticipate.

I know the NYISO and New York State Reliability Council planners are considering the impact of increasing reliance on weather-dependent resources.  However, in my opinion, NYISO is not adequately acknowledging the intractable problem with an electric system that relies on renewables.  To date the primary concerns about the commercially unavailable DEFR technology are expected to occur in the late 2030’s as renewable penetration increases.  This may give time to address the issue.

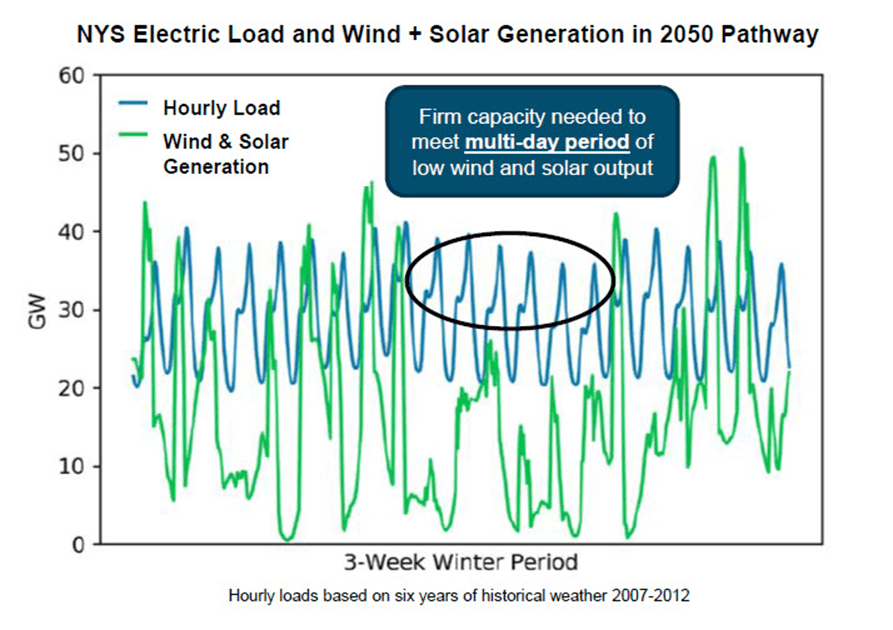
However, I worry that this problem could become an issue in NYC sooner.  The CHPE, Empire Wind, and the Propel NY Public Policy Transmission Project projects are all weather dependent, and I think there is underappreciated correlation between the generating sources.  For an intense wintertime dark doldrum CHPE would not provide power if Hydro Quebec needs it for its ratepayers.  If the dark doldrum started with a strong snowstorm that ushered in a large high-pressure system, NYC’s rooftop solar units could be covered with snow reducing their output.  At the same time, the offshore wind resources could be becalmed.  In that scenario short-term energy storage will not be sufficient, DEFR would be needed. 

In a recent Capital Tonight segment Susan Arbetter interviewed Earthjustice attorney Rachel Spector..  I made a transcript and added my comments because I think the responses to her questions exemplify the position of environmental organizations that support the Climate Act.  It is troubling that in response to a question about the implications of the STAR report, Spector said “Well, this is a complicated issue, and I could talk for a while about what the NYISO put forward but I will say New York is not facing an energy crisis and the reports that are coming out are extremely conservative.”

Fortunately, the NYISO recognizes their responsibility to protect the citizens of New York requires conservative approaches based on decades of experience.  The STAR report recognizes that the BPTF projects must demonstrate their planned power capabilities before the peaking units can be retired.  Furthermore, the  Draft State Energy Plan found that reliability considerations will prevent the shutdown of any of the peaking power plants for the foreseeable future.  If the NYISO warnings are heeded and the ideological zealots are ignored the worst-case catastrophe should be avoided.

Conclusion

Keeping the lights on in NYC during peak load conditions is challenging.  In the future, the problem will become even more challenging because the meteorological conditions that cause the peak loads also are associated with low wind resource availability.  The STAR report lays the foundation to address these challenges but the usual suspects are whining that their recommendations are too conservative.

The NYC peak load problem addressed by the STAR report cannot be endangered by risky unproven environmentalist strategies.  Keeping the lights on is incredibly challenging at the best of times and a rushed transition away from existing system components is too risky to consider.  The STAR report describes a safe transition approach.  I believe that there is adequate time to address my concerns about the over-reliance on weather-dependent resources in the BPTF projects proposed.

Wind Energy Reasons to Pause

I am very frustrated with the New York Climate Leadership & Community Protection Act (Climate Act) net zero transition because the reality is that there are so many issues coming up with the schedule and ambition of the Climate Act that it is obvious that we need to pause implementation and figure out how best to proceed.  This article describes reasons to pause implementation associated with wind energy deployment.

I am convinced that implementation of the Climate Act net-zero mandates will do more harm than good because the proposed green energy programs are crimes against physics.  The energy density of wind and solar energy is too low and the resource intermittency too variable to ever support a reliable electric system relying on those resources. I have followed the Climate Act since it was first proposed, submitted comments on the Climate Act implementation plan, and have written over 500 articles about New York’s net-zero transition.  The opinions expressed in this article do not reflect the position of any of my previous employers or any other organization I have been associated with, these comments are mine alone.

Overview

The Climate Act established a New York “Net Zero” target (85% reduction in GHG emissions and 15% offset of emissions) by 2050.  It includes an interim reduction target of a 40% GHG reduction by 2030. The Climate Action Council (CAC) was responsible for preparing the Scoping Plan that outlined how to “achieve the State’s bold clean energy and climate agenda.”  After a year-long review, the Scoping Plan was finalized at the end of 2022.  Since then, the State has been trying to implement the Scoping Plan recommendations through regulations, proceedings, and legislation. 

The Scoping Plan Strategic Use of Low-Carbon Fuels scenario projects that 13,096 MW of onshore wind and 13,484 MW of offshore wind will be needed for the electric system to be “zero emissions” in 2040.  If the onshore wind turbines are like the Alle-Catt 340 MW project that has 117 turbines, then each turbine will be 2.9 MW and 4,516 turbines will be needed.  If the offshore wind turbines are similar to the Empire Wind project that proposes 15 MW turbines then  899 offshore turbines will be needed.

This post describes problems with wind energy in recent articles.

Wind Curtailment

Parker Gallant keeps track of wind energy production in Ontario and the problem of what to do with excess wind energy when the production from Ontario exceeds the load.  The current strategy is to dump the excess power into Quebec, New York, and Michigan at a low price which has short-term consumer benefits to those jurisdictions.  However, Gallant has documented that through 4/20/25 dumping the excess wind and solar energy has cost Ontario taxpayers and ratepayers $64 million.  On April 21 the total bill was another $12,3 million.  On April 26, the total for the month had reached $101 million which is about $20 per Ontario household.

He explains what happened on April 21:

Even though our Peak Hour was a little bit higher reaching 16,250 MW at Hour 20 we still didn’t need what the IWT and solar were generating so IESO were selling it for deep discounts to our neighbours as the average HOEP (hourly Ontario energy price) was a piddly $17.80/MWh (1.8 cents/kwh). IESO had forecast those IWT would generate 88,811 MW (75.5% of capacity) but only accepted 81,846 MW meaning they curtailed 7,000 MW which we paid for. Solar generation was small (not much sun) and generated only 1,326 MW! IESO’s intertie data indicates they sold 89,574 MW to our neighbours which means we Ontario ratepayers and taxpayers ate $12.3 million of their respective costs along with a few dollars for the other exported power which probably was baseload nuclear and hydro!

This is another reason to pause the implementation because in 2040 when there are over 5400 wind turbines running, we will have the same problem.  I must believe that the problem will get worse for Ontario because they at least got paid something but, in the future, when our turbines are producing too much we will not be a market so they will just have to eat the curtailment costs.  When our neighbors install their turbines, then we will have to eat our costs too.  How is this supposed to work for New York ratepayers?

European Experience

Tallbloke’s Talkshop poses the renewables question whether “endless subsidies for a so-called ‘energy transition’ are affordable for those forced to cover the costs, especially when the things being subsidised are creating daily problems for electricity supply and grid stability due to the erratic nature of the technology?  He describes an article in the Europe section of an OilPrice.com opinion piece that addresses the question.

Certainly, there are plenty of industries that rely on state subsidies, but how many of these, it’s worth asking, rely on these subsidies for their very survival?

The answer is inconvenient for the transition lobby. These are the only industries that literally cannot survive without massive and consistent state financial support. And that essentially makes them unviable in a natural market environment.

For recent proof, look no further than Europe. There is no anti-transition government in Europe. There is no Trump or anything like him at the helm of any European country. And yet it was in Europe that the chief executive of Danish Ørsted insisted that the government step up their financial support for the offshore wind industry to ensure its survival.

As reported by the Financial Times, which spoke to Rasmus Erbroe, “European capitals to commit to consistent annual support for the industry in order to meet offshore wind targets and help reverse rising costs.”

“If you want to deliver on energy security, energy independence, affordability for Europe for the coming decades and meet the targets, then we need to make this change,” the executive said, quite likely believing every word that came out of his mouth was the holy truth. In fact, there is nothing affordable about an energy that cannot absorb its own costs and turn in a profit without government guarantees of that profit.

Surely the question whether wind energy can ever turn a profit without government guarantees of that profit is a valid question that needs to be addressed before New York squanders more money on this technology.

Wake Physics

I described the Scoping Plan projections for wind energy earlier in this article.  Those are underestimates because the projections for the expected annual output are too optimistic.  In other words, if reasonable estimates were used then even more wind turbines would be needed.  Pierre Gosselin describes another nuance that could affect the number of turbines needed.  Klimanachrichten explains that wakes from upwind turbines reduces the output of downwind turbines.  He notes:

The expansion of offshore wind energy in the North Sea is a central component of the European energy transition. However, two of the biggest players in the industry are now warning of negative effects: Ørsted and Equinor have jointly calculated that the planned 1.5 gigawatt wind farm ‘Outer Dowsing’ could cause significant so-called wake losses. These are yield losses that occur when the wind is weakened by upstream wind farms, causing downstream turbines to produce less electricity.

This might be included in the Scoping Plan, but the documentation is so poor that it is impossible to know.  If I had to bet then I would bet the ranch that this nuance is not included.

Ultimate Problem

Regular readers of this blog are undoubtedly tired of me constantly whining about the insurmountable challenges associated with extended periods of extended periods of light winds.  Chris Morrison describes notes that in the first quarter of 2025 “low levels of renewable generation and high demand drove gas-fired power production to its highest level since 2021”.  He continues:

But this gas rescue act came at a large cost since Britain’s increasingly unstable electricity supply, which provides some of the highest prices in the world, showed wild cost swings in windless days in January. On at least two freezing winter days, wind production was more-or-less zero. Not untypical winter weather conditions also saw the sun fail to shine for a number of consecutive days. Some periods saw the wholesale peak-time electricity price top £160 per megawatt hour ((MWh). On January 8th, when winter high pressure stopped the wind blowing across the UK, the wholesale price soared to £300 MWh, while the sophisticated clearing price needed to balance the non-storable supply with instant demand soared to £2,900 MWh.

Rafe Champion agrees with my concern.  He recently wrote:

The wind and solar system is vulnerable to wind droughts. It is not entirely fanciful to plan a book titled How Wind Droughts Almost Destroyed Civilisation based on these articles: The late discovery of wind droughts, We have to talk about wind droughts, and The “wind drought trap.”

The Scoping Plan analyses were not sophisticated enough to incorporate these costs into their projections.  So this massive problem was downplayed by the Climate Action Council.

Killing Eagles

I recently received an email about a seminar addressing bird kills associated with wind turbines.  Proponents argue that wind turbines kill only “a fraction as many as are killed by house cats, buildings, or even the fossil fuel operations that wind farms replace.”  Of course, when asked about raptor kills there is no response.  David Wojick continues his great coverage of the impacts of wind turbines on eagles with a post about eagle kill offset rules.    He explains the problem:

Every operating wind power facility has a US Fish and Wildlife Service (FWS) permit to kill eagles on an ongoing basis and many do kill eagles. Each permit depends on eagle-kill offset rules which appear to be false. If so then the killing is illegal, a violation of the Bald and Golden Eagle Protection Act.

The eagle kill offset rules are not protecting eagles.  This is another unacknowledged issue in the Scoping Plan.

Accountability for Wind Farms in France

There was an encouraging article.  A court in France took action when an eagle was killed:

The recent shutdown of the Bernagues wind farm in Hérault, France, marks a long-overdue reckoning with the lethal impacts of wind energy on wildlife—particularly raptors like the golden eagle. On April 9, 2025, a French court ordered the entire site to cease operations for one year following the confirmed death of a golden eagle, a protected species, that collided with one of the farm’s turbine blades in January 2023. The decision also slapped Energie Renouvelable du Languedoc (ERL), the farm’s operator, with a €200,000 fine, half of which was suspended, and imposed an additional €40,000 fine on the company’s director.

I don’t think that it is very likely that a New York judge would take such an action.  Nor do I expect that the Department of Environmental Conservation to step up until it has become obvious that 5,000 wind turbines could destroy the comeback of the Bald Eagle in New York State and by then it would probably be too late.

Breaking the Law in the US

Unfortunately in the United States the Federal government has been charging ahead with offshore wind development and it is not clear that they are following the law

The Save the Right Whales Coalition has joined legal challenges to the Bureau of Ocean Energy Management’s (BOEM) approval of the Vineyard Wind 1 project and ten other offshore wind facilities. In a newly filed amicus brief, SRWC argues that BOEM broke federal law by rewriting statutory language, bypassing public rulemaking, and using compensation to justify harm — all to advance offshore wind at any cost.

Despite the offshore wind advocates arguments that the massive development of offshore wind will not affect the endangered Right Whale, I believe that it will.  There are just too many potential impacts that will accumulate and overwhelm the few whales left.

Conclusion

Evidence continues to mount that issues associated with every component of the Climate Act transition plan are so great that a pause to re-assess the plan is necessary.  New York Public Service Law  § 66-p (4). “Establishment of a renewable energy program” includes safety valve conditions for affordability and reliability that are directly related to wind energy deployment.  The failure of the Hochul Administration to establish criteria for those safety vales and provide public tracking of the status must be corrected before implementation proceeds.

Why New York Renewables?

On December 18, 2024, the New York Assembly Committee on Energy held a public hearing to gather information about New York State Research & Development Authority (NYSERDA) revenues, expenditures, and the effectiveness of NYSERDA’s programs.  During questioning, members of the committee asked NYSERDA and New York Department of Public Service staff questions about implementation of the Climate Leadership & Community Protection Act (Climate Act).  This article discusses the response to the question can New York rely solely on wind and solar.

This is the 800th post at this blog.  I am convinced that implementation of the New York Climate Act net-zero mandates will do more harm than good if the future electric system relies only on wind, solar, and energy storage because of reliability and affordability risks.  I have followed the Climate Act since it was first proposed, submitted comments on the Climate Act implementation plan, and have written over 480 articles about New York’s net-zero transition.  The opinions expressed in this article do not reflect the position of any of my previous employers or any other organization I have been associated with, these comments are mine alone.

Overview

The Climate Act established a New York “Net Zero” target (85% reduction in GHG emissions and 15% offset of emissions) by 2050.  It includes an interim 2030 reduction target of a 40% GHG reduction by 2030. Two targets address the electric sector: 70% of the electricity must come from renewable energy by 2030 and all electricity must be generated by “zero-emissions” resources by 2040. The Climate Action Council (CAC) was responsible for preparing the Scoping Plan that outlined how to “achieve the State’s bold clean energy and climate agenda.” The Integration Analysis prepared by the New York State Energy Research and Development Authority (NYSERDA) and its consultants quantified the impact of the electrification strategies.  That material was used to develop the Draft Scoping Plan outline of strategies.  After a year-long review, the Scoping Plan was finalized at the end of 2022.  Since then, the State has been trying to implement the Scoping Plan recommendations through regulations, proceedings, and legislation. 

The New York Assembly Committee on Energy hearing was intended to gather information about NYSERDA’s revenues and expenditures in order to gain a broader perspective on effectiveness of NYSERDA’s programs.  I submitted written testimony describing NYSERDA’s RGGI program effectiveness that included two documents: my public statement and an attachment that documented the analysis of the trends and cost-effectiveness.  I also included a link to the spreadsheet that generated all the trends and graphs.

At the end of this article is a complete transcript of the questions and responses.  The body of the article is not going to provide specific references.  Assembly Member Philip Palmesano asked the question about renewables that is the subject of this article.  Jessica Waldorf, Chief of Staff & Director of Policy Implementation, New York State Department of Public Service and John Williams, Executive Vice President, Policy and Regulatory Affairs, New York State Energy Research and Development Authority responded.

Why Renewables

I frequently make the point that New York GHG emissions are less than one half of one percent of global emissions and global emissions have been increasing on average by more than one half of one percent per year since 1990.  Even if New York were to successfully eliminate its GHG emissions the increases elsewhere we supplant our efforts in less than a year. 

Palmesano made the same point that New York emissions are not going to affect global warming and asked what impact the emission reduction programs are going to have.  I think that is an obvious question and it appeared that Waldorf and Williams had prepared to respond to it.

Waldorf said that there are other reasons “to build renewable energy resources in New York that are not just related to emissions.  She gave two reasons: energy security and price volatility.  Palmesano followed up early in her response questioning whether the emphasis on wind and solar was putting all our eggs in one basket provided energy security. 

Waldorf’s explanation of energy security mentioned “localizing energy production here”.  She went on to state:

The other thing I would say about energy security is price volatility.  Customers are beholden to the winds of the fossil fuel industry and the up and down markets that we see from fossil fuels.  Localizing our energy production and renewables allows us for price stability.  That is definitely a benefit of building resources here. 

With regards to energy security, my interpretation is that the Agency position believes that if we develop the wind and solar resources called for in the Scoping Plan that we will not be dependent upon other jurisdictions for our electricity.  That ignores the fact that the supply chain for the rare earth elements necessary for wind, solar, and energy storage has significant risks:

Despite their global importance, the production of rare earth elements has become increasingly concentrated in China over recent years. Not only does this present a geopolitical and economic risk to most of the developed world, but it is also indicative of possible future supply constraints which could interrupt progress toward a decarbonized future.

There is another flaw in this vision for New York electricity system independence using wind and solar – weather variability.  In my comments on the Draft Scope of the Energy Plan I argued that this is an unresolved issue that must be addressed sooner rather than later.  All solar goes away at night and wind lulls can affect all of New York and adjoining regional transmission organization (RTO) areas at the same time. Therefore, when a future electric grid relies on wind and solar those resources will correlate in time and space.  This issue is exacerbated by the fact that the wind lulls occur at the same time the highest load is expected.  I do not believe we can ever trust a wind, solar, and energy storage grid because if we depend on energy-limited resources that are a function of the weather, then a system designed to meet the worst-case is likely impractical.  For example. I believe that in the last 70 years the worst-case weather lull occurred in 1961.  I cannot imagine a business case for the deployment of enough of any Dispatchable Emissions Free Resources (DEFR) technology that will only be needed once in 63 years.  For one thing, the life expectancy of the candidate technologies is much less than 63 years

At first glance, the price volatility argument is persuasive because we have all experienced the impact of increased fuel costs in recent memory.  However, in the last two months the European electric market has shown what happens when an electric system becomes overly dependent upon wind and solar:

From November 2 to November 8 and from December 10 to December 13, Germany’s electricity supply from renewable energies collapsed as a typical winter weather situation with a lull in the wind and minimal solar irradiation led to supply shortages, high electricity imports and skyrocketing electricity prices.

The electric transmission connections to other countries raised prices elsewhere.  Prof. Fritz Vahrenholt says they went up so much in Norway that the energy minister “wants to cut the power cable to Denmark and renegotiate the electricity contracts with Germany”.  Swedish Energy Minister Ebba Busch stated: “It is difficult for an industrial economy to rely on the benevolence of the weather gods for its prosperity.” He went on to respond directly to Habeck’s green policy: “No political will is strong enough to override the laws of physics – not even Mr. Habeck’s.

Finally, note that the DEFR technologies are proposed as backup with expected operations of under ten percent per year.  Those resources will have to be paid very high rates during those hours when needed to be economically viable.  That makes price volatility of a wind and solar electric system inevitable.

Waldorf also responded to Palmesano’s question about over-reliance on wind and solar:

The other thing I would say is we’re not putting all our eggs in one basket when it comes to generation resources.   The points that were discussed earlier and in the zero by forty proceeding, we are looking at other zero emission resources and the value that they can bring into the grid.  So, it’s not the case that we’re just looking at solar and wind.  We are looking at energy storage, at nuclear, and at other resources and how they fit into the picture.

At other times during their response to questions Waldorf and Williams touched on the need for DEFR to back up wind and solar resources during extended periods of calm winds and low solar availability.  In that context, they said the state was looking at these other resources.  They are trying to make the need for DEFR resources a feature not a flaw. 

Responsible New York agencies all agree that new DEFR technologies are needed to make a solar and wind-reliant electric energy system work reliably.  No one knows what those technologies are.  I believe the only likely viable DEFR backup technology is nuclear generation because it is the only candidate resource that is technologically ready, can be expanded as needed, and does not suffer from limitations of the Second Law of Thermodynamics. I do concede that there are financial issues that need to be resolved for nuclear, but this is an issue for any of the DEFR options. 

Waldorf and Williams ignore the following point.  If the only viable DEFR solution is nuclear, then the wind, solar, and energy storage approach they are advocating cannot be implemented without nuclear.  I estimate that 24 GW of nuclear can replace 178 GW of wind, water, battery storage.  Developing nuclear eliminates the need for a huge DEFR backup resource and massive buildout of wind turbines and solar panels sprawling over the state’s lands and water.  If I had the opportunity to ask them a question I would have asked if it would be prudent to pause renewable development until a DEFR technology is proven feasible because the choice and even the viability of any DEFR technology will affect the entire design of the future electric structure necessary to meet the Climate Act net-zero energy system.  Throwing money at renewable energy without knowing that there is a viable backup resource is the last thing we should do because New York cannot afford to invest in “false solutions”.

One last point, Waldorf and Williams did not mention the effect of global warming conceding the fact that New York emission reductions are not going to make any difference.

Conclusion

I have always wondered how state agencies would respond to the point that New York GHG emissions are smaller than the observed increase in global emissions thus making our efforts inconsequential.  The energy security and price volatility response given at this hearing was rehearsed and flawed. 

The “localized” energy security advantage for the wind, solar, and energy storage approach is easily rebutted.  Deployment of the resources is dependent upon supply chains that are anything but secure.  Because all New York wind and solar resource availability is correlated, that means we will be reliant upon resources outside of New York for support.  Finally it is hardly secure that we must develop and deploy new DEFR technologies that are not currently commercially available on an ambitious schedule.

The intermittency of wind and solar has two impacts on price volatility.  During peak demands and likely low renewable resource availability we need DEFR technologies that will likely be expensive.  Even in the absence of DEFR, European experience shows that extreme price volatility occurs during these periods.

There are so many unanswered questions and unresolved issues that the only logical next step is a pause in Climate Act implementation until we truly understand how to decarbonize our electric system without adversely affecting affordability and current reliability standards.    

Transcript of the Why Renewables Question

There is a video of the entire presentation available at the NYS Assembly website.  The question and response is in the video available in the sub-listing of questions in Assemblyman Palmesano’s second link.  The following is a transcript of the entire exchange that I captured using the Dictate application in Microsoft Word and then edited for clarity.

Palmesano Question during second round of questions at 2:05:32

New York contributes 0.4% of total global missions.  China contributes 30%, has 1000 coal plants and is building more every week.  In fact they expanded their coal generating capacity actually by 70 gigawatts, double our total generating capacity including wind, solar, hydro, nuclear, and natural gas.  What true impact are we really making with this process?  Are we just driving out more families, farmers, small businesses, and manufacturers because this only affects New York.  It doesn’t affect China, India, or Russia which is 42% of total emissions.  It doesn’t affect Pennsylvania.  What impact are we truly going to make?

Waldorf response at 2:06:11

I’ll respond to that first and say that there are other reasons to build renewable energy resources in New York that are not just related to emissions.  Some of them relate to things like energy security so localizing energy production here.  Some of them also relate to a point that one of my colleagues made earlier which is a lot of the different fuel sources that provide our energy today are …. 

Palmesano interrupted her here.

Palmesano follow up question at 2:06:32

You mentioned energy security.  I’m supportive of wind and solar and support wind and solar as part of the energy portfolio but you’re putting all your eggs in one basket of full electrification. We don’t have the technology out there for 2040.  Natural gas is used by 60% percent of New York homes for heating.  Natural gas should be a part of the portfolio just like the diversified 401K.  That’s what we should be doing with her energy portfolio if you want to stabilize prices and have energy security in New York You’re going away from that.  It’s not gonna work.  It’s not very successful.  It’s gonna be very costly.

Waldorf response at 2:07:10

The other thing I would say about energy security is price volatility.  Customers are beholden to the winds of the fossil fuel industry and the up and down markets that we see from fossil fuels.  Localizing our energy production and renewables allows us for price stability.  That is definitely a benefit of building resources here.  The other thing I would say is we’re not putting all our eggs in one basket when it comes to generation resources.   The points that were discussed earlier and in the zero by forty proceeding we are looking at other zero emission resources and the value that they can bring into the grid.  So, it’s not the case that we’re just looking at solar and wind we looking at energy storage, at nuclear, and at other resources and how they fit into the picture.

On electrification we’re certainly mindful of the breakdown of how customers get their heating and electricity services today.  In things like gas transitioning and our gas policy planning proceeding we are looking at the best way to make an equitable transition and what that looks like for the current customers that rely on those fuels today.  It is not the case that we’re asking everybody to make the switch tomorrow.  We see this as a transition that’s going to span several years, several decades in terms of meaningful returns transitioning away those customers that currently rely on natural gas to a cleaner source.  It’s not the case that it is an overnight switch.  We are really looking at the long term and trying to achieve those objectives.  

Williams response at 2:08:35

If I could just add on the long-term objectives, focusing particularly on the generation aspects.  We are in the midst of an energy plan process.   We recently launched that and we had a meeting of the planning committee last week where we brought in a representative of the North American electric reliability council and representatives from the New York independent system operator.  What we were asking them to really inform us about was how we should be approaching planning, over the next 15 years that’s our energy plan horizon.  We asked what the nature of the resources that we should be bringing in.  They responded that we must look at all the attributes that various resources can bring into the system.   The emissions aspect is one thing, but we have to understand the varying different contributions to all of the engineering that’s necessary to run a secure and reliable electricity system.  It’s not just a question of just the energy but we need to look at all of those other aspects of electricity whether it’s frequency or voltage. What are the nature of the resources that are necessary to do that.   We are going to be taking a look at that through our energy plans.

September New York Dunkelflaute or Wind Lull

I have been meaning to write this article for several months.  In September Parker Gallant noted that industrial wind turbines (IWT) in Ontario “show up at the party, almost always, after everyone has left” in a post that described poor performance of the province’s wind turbines over a five day period in September.  I looked at New York data, found that wind data was also poor in the state at the same time, and planned to do a post.  Other issues came up but a recent Dunkelflaute wind lull in Germany has spurred me to complete the post.  Better late than never, here it is. 

I have followed the Climate Leadership & Community Protection Act (Climate Act) since it was first proposed, submitted comments on the Climate Act implementation plan, and have written over 470 articles about New York’s net-zero transition.  The opinions expressed in this article do not reflect the position of any of my previous employers or any other organization I have been associated with, these comments are mine alone.

Overview

The Climate Act established a New York “Net Zero” target (85% reduction in GHG emissions and 15% offset of emissions) by 2050.  It includes an interim 2030 reduction target of a 40% GHG reduction by 2030. Two targets address the electric sector: 70% of the electricity must come from renewable energy by 2030 and all electricity must be generated by “zero-emissions” resources by 2040. The Climate Action Council (CAC) was responsible for preparing the Scoping Plan that outlined how to “achieve the State’s bold clean energy and climate agenda.” The Integration Analysis prepared by the New York State Energy Research and Development Authority (NYSERDA) and its consultants quantified the impact of the electrification strategies.  That material was used to develop the Draft Scoping Plan outline of strategies.  After a year-long review, the Scoping Plan was finalized at the end of 2022.  Since then, the State has been trying to implement the Scoping Plan recommendations through regulations, proceedings, and legislation.  Unfortunately implementation efforts to date have short-changed addressing issues that have been identified.

Dunkelflaute

The German description of a wind and solar resource lull is Dunkelflaute.  Iowa Climate Science Education explains that the term refers to “dark doldrums”.  A large high pressure system has recently affected wind and solar resources in Europe.  Daniel Wetzel notes that:

At 5 p.m. on Wednesday, solar power was only supplying a single megawatt hour. The 1602 offshore wind turbines in the North and Baltic Seas – each one the size of the Eiffel Tower – were at a complete standstill. Zero electricity production.

Earlier in the week the British electric system faced a similar situation.

Ontario Dunkelflaute

Parker Gallant’s article provided a great example:

Looking at the following IESO Power data chart from September 13th to late in the day on September 18th it is evident Ontario Demand (solid green line) clearly demonstrates the daily swings in Ontario demand during those “summery” days. It is evident, demand fluctuates by almost 6,000 MW from the middle of the night to later in the day!  Those swings in demand are even higher when you examine the data in respect to “market demand” (blue line) which reflects our imports and exports via our intertie connections with our neighbours.

From the top of the chart:  the tiny “red” represents biofuel generation and “yellow” represents generation supplied by solar panels. The “green” tells us what those industrial wind turbines are generating hourly! The “dark blue” is generation from our natural gas plants and the “light blue” is power being supplied by our hydro generation stations some of which are classified as “baseload”! The solid unwavering “orange” represents what our baseload nuclear plants provide us with!

He describes the charts:

Looking at the six days illustrated, the highest peak demand occurred September 16th reaching 21,547 MW at Hour 17 (hour ending at 5 PM) and the lowest peak demand was September 14th reaching 19,288 MW at Hour 17! Interestingly Hour 17 was the peak hour on all six days.

As the Supply chart clearly demonstrates those natural gas plants (dark blue) fluctuated widely as needed to ensure we were able to avoid blackouts each and every day by either ramping up or ramping down as required! Hydro generation also played a role by also modestly, ramping up or down in addition to supplying some of the baseload.

Gallant went on to describe how the IWT performed:

Well, the high for generation by those IWT occurred at Hour 24 (ending at midnight) September 14th when they generated 2,199 MWh or 44.8% of their capacity and the low generation occurred at Hour 11 on September 13th when they only managed to generate 22 MWh or 0.5% of their capacity. Interestingly at Hour 24 on September 14th IESO reported our net-exports were 2,956 MWh at the low price of $24.07/MWh so we apparently didn’t need that power and were forced to sell it off for a cheap price! Also IWT over the six days hit their peak generation at Hours 23, 24 or Hour 1 when peak demand is always near its lowest for each and every day! Coincidently their low generation over the same  6 days occurred at either Hours 10 or 11 when demand is accelerating!

New York Wind Data

I attempted to access the Ontario IESO generation data for the period but could not find it.  On the other hand, the New York Independent System Operator (NYISO) provides access to their data.  New York fuel-mix load available at the NYISO Real-Time Dashboard where there is a link to historical data.

The Real-Time Fuel Mix panel includes links to current and historical five-minute generation (MW) for energy generated in New York State.  I processed that data to calculate hourly averages.  The generator types include “Hydro” that includes pumped storage hydro; “Wind”, mostly land-based wind but does include 136 MW of offshore wind; “Other Renewables” that covers solar energy (394 MW of “front-of-the-meter solar”), energy storage resources (63 MW), methane, refuse, or wood; “Other Fossil Fuels” is oil; “Nuclear”; “Natural Gas”; and “Dual Fuel” which are units that burn both natural gas and oil. As an aside, oil capability is maintained as a reliability measure.

The following graph shows the hourly fuel type generation throughout the period.  Note that there are similarities with the Ontario data.  New York does not have as much nuclear, but both control areas use it as solid, unwavering baseload power. New York hydro has more diurnal variation because there are pumped storage hydro facilities used for load following.  In both control areas natural gas is relied on to provide power when needed.  New York has dual-fuel units that probably burned natural gas during this period.

The focus of this article is the Dunkelflaute, so the wind data are of most interest.  The following figure lists the wind data only.  Because I could not combine data sets, we can only consider a qualitative comparison between New York and Ontario.  The wind output is the similar – low when needed most and picking up when demand drops.

Because I have access to the actual data, I can summarize just how bad the wind was over this 192-hour period.  New York has 2,454 MW of wind capacity.  The maximum wind capacity occurred on 19 September at hour 21 when 502 MW of wind power was generated, an unimpressive 20.5% of the total capacity.  The minimum wind capacity occurred on 13 September at hour 12 when 0.2 MW of wind power was generated.  I summarized the hourly totals by category in Table 1.  There were 96 hours representing half the period when the capacity of all the wind generation in New York was less than 5%.  All but one of the hours had a capacity factor of less than 20%.

Table 1: Categorial Hourly Totals for New York State Wind Power from 12 September 2024 hour 0000 to 19 September 2024 hour 2300

The NYISO Operations Report for September 2024 Wind Performance Figure shows daily wind production over the entire month.  Those data show that the daily capacity factor was less than 10% from 9/10/24 to 9/20/24. 

Discussion

In my opinion, climate scientists tend to over-emphasize potential global warming drivers when explaining weather observations.  For example, I saw a news segment where a climate scientist claimed that warmer temperatures associated with global warming increased the rainfall associated with Hurricane Helene in western North Carolina by 15 to 20% exacerbating the flooding.  Baloney, I say.  The supposed rationale is that warmer weather increases the amount of moisture that the atmosphere can hold and climate change models are used provide numbers for these attribution statements.  I addressed the Helene hype claims earlier.  Given that there was a storm in 1916 that produced higher flood levels I don’t think that moisture content was the primary driver for the flood.  Instead, I believe that an unusual weather pattern caused the storm to stall over the region.  Even if there was some greater water capacity effect, it was small relative to the weather pattern impact.

My whole diatribe was a lead-in to make a point about weather patterns and the observed data in September 2024.  Light winds over 11 days are only possible if there is a large, slow-moving high-pressure system.  I have never seen any observational analyses claiming that they are trends in this kind of weather pattern.

More importantly, there are implications of these observations relative to the Climate Act transition to an electric system that relies on wind, solar, and energy storage capacity.  The fact that all of the New York wind generation only produced 0.2 MW during one hour must mean that the stagnant high pressure system was at least as big as New York including the offshore wind facility south of Long Island. It is hard to conclusively pick out the Ontario wind generation during the worst hour but it appears that there is very little wind generation at that time.  I maintain that to fully understand the geographical implications that a detailed analysis of meteorological data and expected wind and solar generation for New York and all the adjoining electric system control areas is necessary.  Lastly, I believe that the weather pattern that caused this wind lull could occur at any time of the year.  It may be more likely during certain times of the year but there is no reason that similar conditions could occur anytime.  This exacerbates the problem because the high-pressure systems that cause light winds often are accompanied by the most extreme temperatures which are when the observed peak loads occur.

My primary reliability concern is the challenge of providing electric energy during these periods of extended low wind and solar resource availability.  This period perfectly exemplifies this kind of extended wind lull period.  To address this problem the organizations responsible for New York State electric system reliability agree that a new Dispatchable Emissions-Free Resource (DEFR) is need as described here.  In addition to the geographical considerations noted above, planning for must evaluate as long a period as possible.  That work must consider when wind and solar can charge energy storage capacity and when short-term energy storage must be discharged to meet system requirements.  The challenge of that analysis is obvious when looking at these wind output graphs.

Conclusion

The Dunkelflaute wind lull phenomenon occurs worldwide.  The comparison of Ontario and New York data shows that these conditions can cover both jurisdictions.  The New York data show the severity of the wind lull.  It is essential that electric system planners consider the impacts of the Dunkelflaute.  I believe that New York is addressing this issue.  However, I will only feel comfortable that they have considered the worst-case situation when they assess a longer period of data covering adjacent electric system control areas.

Unfortunately, clean energy advocates continue to dismiss the extent of the problem.  Even worse, some do not acknowledge that wind, solar, and energy storage cannot be relied on during those periods and that when the power is needed the most it is most likely to be in a resource lull.  These advocates are simply wrong and should be ignored.

Zero Emissions by 2040 Gap Characterization

A different version of this article was published at Watts Up With That.

As part of the Department of Public Service Proceeding 15-E-0302 a technical conference was held on December 11 and 12, 2023 entitled Zero Emissions by 2040.  A  zero-emissions electric system is a key part of New York’s Climate Leadership & Community Protection Act (Climate Act) and all credible projections for the generating resources needed for the zero emissions Climate Act target  have noted that a new category of generating resources called Dispatchable Emissions-Free Resources (DEFR) is necessary to keep the lights on during periods of extended low wind and solar resource availability.  Previously I published an article describing the slide presentation by Zachary Smith from the New York Independent System Operator (NYISO) describing DEFR.  The video of the meeting is available now and this article describes the first session of the meeting – Gap Characterization.

I have followed the Climate Act since it was first proposed, submitted comments on the Climate Act implementation plan, and have written over 400 articles about New York’s net-zero transition. The opinions expressed in this post do not reflect the position of any of my previous employers or any other organization I have been associated with, these comments are mine alone.

Overview

The Climate Act established a New York “Net Zero” target (85% reduction in GHG emissions and 15% offset of emissions) by 2050.  It includes an interim 2030 reduction target of a 40% reduction by 2030 and a requirement that all electricity generated be “zero-emissions” by 2040. The Climate Action Council (CAC) was responsible for preparing the Scoping Plan that outlines how to “achieve the State’s bold clean energy and climate agenda.”  In brief, that plan is to electrify everything possible using zero-emissions electricity. The Integration Analysis prepared by the New York State Energy Research and Development Authority (NYSERDA) and its consultants quantifies the impact of the electrification strategies.  That material was used to develop the Draft Scoping Plan outline of strategies.  After a year-long review, the Scoping Plan was finalized at the end of 2022.  In 2023 the Scoping Plan recommendations were supposed to be implemented through regulation, PSC orders, and legislation.  Not surprisingly, the aspirational schedule of the Climate Act has proven to be more difficult to implement than planned and many aspects of the transition are falling behind.  DEFR is a particularly challenging problem.  When political fantasies meet reality, reality always wins.

Gap Characterization

The Department of Public Service (DPS) convened a two-day technical conference on December 11,  2023.  The conference focused on characterization of the potential “gap” discussed in the May 14, 2023 Proceeding 15-E-0302 Order and technologies that could shrink or fill that gap.

The first session (video) of the conference was titled Characterizing the potential “gap”.  It addressed resource adequacy, transmission security, and grid stability arising from shuttering fossil fuel-fired resources and increased loads due to the Climate Act electrification strategies.  It was moderated by Schuyler Matteson from DPS.  There were four panelists and I have included links to the location in the video with their introductions: 

  • Deidre Altobell, Chief Transmission Planning Engineer Consolidated Edison.  She represented the concerns of the New York City electric system provider.  New York City has unique issues within the New York State electric power market that are a particular challenge for a transition to a system dependent upon renewables.
  • Prof. C. Lindsay Anderson, Chair of Department of Biological and Environmental Engineering Cornell.  Professor Anderson provided an independent check on the work of other electric system planning analysts because her group has modeled resources necessary for the New York electric system transition.
  • Zach Smith, VP System Resource Planning, New York Independent System Operator (NYISO).  NYISO is “responsible for operating wholesale power markets that trade electricity, capacity, transmission congestion contracts, and related products, in addition to administering auctions for the sale of capacity.”  As part of those responsibilities NYISO has done extensive modeling resource projections of the net-zero transition.
  • Kevin Steinberger, Director, Energy and Environmental Economics (E3).  As part of the New York Climate Act transition plan an Integration Analysis was performed that included an assessment of the electric system net-zero transition resources.  E3 provided the quantitative analysis for that effort.

The description for the meeting described the items for discussion:

  • Existence of a “gap,” based on physical and planning requirements of the grid.
  • Resource adequacy, transmission security, and grid stability components of the potential resource-reliability gap that is expected to emerge in New York as fossil-fired generation resources are shut down pursuant to CLCPA requirements.
  • How models used by NYISO, the Climate Action Council, and others identify this “gap” and estimate its size and timing.
  • Information to seek/develop through additional studies conducted as part of the Coordinated Grid Planning Process and/or ongoing NYISO Reliability Needs Assessment.

This article only discusses one of the sessions in the Technical Conference.  The DPS website provides information on the other sessions and links to the videos of the discussions.  There is plenty of fodder for additional posts, but I also have a long list of obligations and other topics to cover so I am not going to address anything else here.

Gap Characterization Session

After the introductions the moderator asked a series of questions.  This section lists the questions with a link to that location in the video.  I highlight some of my concerns and points made by the panelists

The first questions was: “How do we know if there is a gap?”  Professor Anderson described an analysis her group did.  They made projections for expected loads and potential resources then used 22 years of hourly historical data to model the system.  Without considering cost constraints they assessed system vulnerabilities to evaluate periods where there was insufficient generation to meet projected loads.  Even with optimistic projections they found there will be periods during the coldest and hottest periods where there will be insufficient generation from wind, solar, and energy storage resources.  Steinberger also responded that their modeling consistently showed the need for a new resource that is firm, dispatchable, and has no emissions that can power the system for days without significant recharge from wind and solar resources.  He stressed the importance of considering actual historical meteorological conditions because renewable energy production is dependent on weather conditions.

Zachary Smith gave an overview summary presentation of the DEFR issue that was the focus of an earlier post of mine.  In his first slide (shown below) he gave an overview of the generating resource outlook to make the point that a large amount of new generating resources needs to be developed.  The estimates shown are from the 2021-2040 System & Resource Outlook and represent two plausible load projections.  He noted that there are “a lot of attributes that fossil fuel resources provide today that wind, solar, and energy storage simply cannot provide”.  He also made the point that the DEFR replacements do not have to be a single technology but could be several technologies that in aggregate can replace the fossil generation.

The ultimate problem for reliability in an electric system that depends on wind and solar is illustrated in the following slide from Smith’s presentation.  It highlights a 7-day wind lull when the wind, solar, and energy storage are insufficient to meet demand.  The replacement resources must be able to ramp up quickly, stay online for a long period, and provide ancillary services to support the transmission system.  The sum of the grey area under the curve during that period is the amount of energy (MWh) that must be provided by DEFR sources based on an analysis of historical weather data. If there are insufficient resources during a wind lull, then the load cannot be met.  The consequences of that situation would be catastrophic.

To meet this need for dispatchable resources Smith explained that dispatchable emission-free resources (DEFRs) must be developed and deployed throughout New York:

  • As resources shift from fossil generators to zero emission resources, essential grid services, such as operating reserves, ramping, regulation, voltage support, and black start, must be available to provide New Yorkers with a reliable and predictable electric system that consumers require.
  • DEFRs will be required to provide both energy and capacity over long durations, as well as the reliability attributes of retiring synchronous generation. The attributes do not need to be encapsulated in a singular technology, but in aggregate the system needs a sufficient collection of these services to be reliable.

The NYISO must toe the political correctness line, so Smith downplays the enormity of the challenge to bring DEFR online in the timeframe necessary to meet the arbitrary Climate Act schedule.  I have no such restrictions so I will note that I think that anyone who thinks that this can be done is crazy.  Smith lists the attributes needed by DEFR in his presentation.  In the following I offer my comments on his list of attributes.

Smith’s first attribute for DEFR is that it must have “dependable fuel sources that are carbon free and allow these resources to be brought online when required”.  Clearly intermittent wind and solar do not meet this fundamental requirement. 

The second DEFR attribute is that it must be “non-energy limited and capable of providing energy for multiple hours and days regardless of weather, storage, or fuel constraints”.  This is a particular concern of mine.  Wind and solar resources correlate in time and space.  In other words, when the wind is light at one wind farm in New York it is very likely that all the wind farms in the state are experiencing light winds.  The seven-day wind lull example in the dispatchable resources needed figure illustrates the problem.  If there are insufficient resources during that wind lull, then the load cannot be met.  My concern is that I think we do not know what the worst case low renewable resource availability period is.  Until there has been more analysis done then I believe that planning to prevent reliability issues is inadequate.

The NYISO operators balance generation with load constantly.  Smith describes several attributes necessary for this requirement.  DEFR must be able to “to follow instructions to increase or decrease output on a minute-to-minute basis”.  There must be “flexibility to be dispatched through a wide operating range with a low minimum output”. Finally, DEFR must be “fast ramping to inject or reduce the energy based on changes to net load which may be driven by changes to load or intermittent generation output”. 

In addition to the attributes needed when units are operating, there are startup attributes.  DEFR must be “quick start to come online within 15 minutes” and capable of “multiple starts so resources can be brought online or switched off multiple times through the day as required based on changes to the generation profile and load”.  Smith explains that a range or DEFR generation will likely be required.  Not every DEFR must be capable of every attribute for matching load but sufficient amounts each attribute for the system requirement will be required.

In addition to the generating requirements that cannot be supplied by wind and solar, there are ancillary support services for the transmission system.  Smith describes three transmission support DEFR attributes:

  • Inertial Response and frequency control to maintain power system stability and arrest frequency decline post-fault;
  • Dynamic Reactive Control to support grid voltage; and
  • High Short Circuit Current contribution to ensure appropriate fault detection and clearance.

Smith’s presentation lists the attributes of twelve sample technologies in the following slide.  This represents the NYISO opinion of the capability of different technologies to meet the attributes necessary to maintain a reliable system.  In the future grid the insistence that all fossil fired units must be shut down means that numerous technologies that meet some of the necessary attributes will be required.  The added complexity of these technologies does not increase resiliency because wind, solar, battery and demand response are all energy limited.  Ancillary support services will be a major consideration because wind, solar and battery do not provide those services.  Just from this overview, it is clear that affordability and reliability will be challenges.

Attributes of Sample DEFR Technologies

The moderator asked for Altobell’s reaction relative to the situation in New York City.  She noted that Con Ed agrees with NYISO analyses and that their work has shown similar results.  She made the point that there is a minimum amount of generation that must be on-line in New York City to provide reactive support.   She explained that the location of that generation is important.  Importantly, she noted that we cannot let any more fossil retire until replacement services are provided.

Altobell also described some of the reliability standards that they are required to address.  For example, the reliability standard N-1-1 addresses the loss of the two largest components on the system and the ability to recover from the loss of those two components.  This criterion is considered on a daily and on a long-term basis.  Currently the system relies on quick start units to get the system back to normal after the loss of large components but the peaking turbines that have historically been used for this are being retired which complicates compliance with the requirement.

In another example of a hidden cost of the net-zero transition Altobell explained that the New York City transmission system needs to be modified to eliminate load pockets.  Historically Con Ed has relied on generating resources that were located to serve those load pockets.  To replace those resources, the load pockets have to be eliminated to open up the system.  This is complicated by the fact that there isn’t much room available for infrastructure like substations.

I was interested in her comments on inverter-based resources relative to a dispatchable resources.   She noted that 1,000 MW of offshore wind is equivalent to 100 MW of dispatchable resources in transmission security analyses.  That means to replace the 2,000 MW of dispatchable Indian Point power that the State shut down, 20,000 MW of offshore wind must be deployed.  Note that the Climate Act mandates 9,000 MW of offshore wind which is far less than what is needed to simply replace Indian Point.

The next question from the moderator addressed the quantity of resources necessary to address the gap.  Specifically, he asked can wind, solar, short-duration solar, and improvements to the transmission system eliminate the gap.  Professor Anderson explained that her team’s work found that adding more of each technology is not going to solve the gap problem.  It is not just that we need more, we need it in the right places. 

The moderator reflected the consensus of the panelists when he noted the New York gaps cannot be solved using existing technology because of the physical characteristics of the grid and the location of load in the state.  He followed up by asking Steinburg when the gap will show up, how quickly do we need to react, and what is the magnitude of the resources necessary to respond.  Steinburg said the work his group did for the Integration Analysis showed that the timing of the gap problem depends on the rate of electrification and retirements of existing fossil resources.  The problem will be worse in the winter once the load peak shifts to account for electric heating and electric vehicles.  Smith noted that the NYISO expects that New York will be a winter peaking system in the ”early to mid- 2030’s”.

Schyler Matteson, the moderator, pointed out that before the DEFR resources can be deployed a long period of planning, permitting, construction, and inter-connection is required.  He stated that this could be on the order of seven years.  He followed up with a question to Smith about how planning for the system reserve margins and the local transmission security issues most prevalent in New York City will affect the process to develop DEFR to replace existing fossil.  Smith emphasized the point that this is a challenge that will require extensive collaboration between agencies.  In order to address the retirement issues NYISO has instituted a quarterly “short-term assessment of reliability” process.  While this reactively addresses generator deactivation notices, NYISO is also trying to consider longer-term issues.  In particular, the Department of Environmental Conservation has a rule promulgated to retire old peaking combustion turbines.  In that process, NYISO temporarily extended the retirement dates until reliability solutions could be deployed.  Smith emphasized that a similar process needs to be incorporated as part of the Climate Act net-zero transition.  Smith went on to point out that some of the DEFR required is not yet commercially available so there is even more lead time than required to simply deploy the resources.  Altobell explained that there is another consideration – outage scheduling.  The existing system still has to operate and the outages when changes can be made without threatening reliability are getting smaller and smaller.

The moderator gave his summary of the panel discussion and asked for comments.  He said a gap “definitely exists”, that gap is flexible based on the future load characteristics, the generation mix, load profiles, and transmission constraints.  The gap is starting to show up around 2035 and is definitely an issue by 2040.  DEFR needs to be commercially available during the deployment planning period.  Three different analyses showed that on the order of 20 to 30 GW of capacity is needed.  Gaps of four maybe five days occur as much as every few years.  Smith pointed out that future planning also has to address extreme events and the need for resilience.

The session ended by discussing a question raised in the chat.  The question raised was how do we characterize what the maximum DEFR need is?  Smith replied that more analysis is needed.  He mentioned that the New York State Reliability Council is charged with addressing this issue.  It is necessary to define the worst-case conditions and then decide how to design the system to deal with it.  Altobell supported his comments and pointed out that the Reliability Council has an Extreme Weather Working Group that is looking at gap characteristics.  They are also addressing the reliability rules that will be needed when the projected amounts of inverter-based resources (wind, solar, and energy storage) are deployed. 

Discussion

At the Climate Action Council meeting to vote on the approval of the Scoping Plan Dr. Robert Howarth summarized his statement  supporting his vote to approve the Scoping Plan.  His statement notes that:

I further wish to acknowledge the incredible role that Prof. Mark Jacobson of Stanford has played in moving the entire world towards a carbon-free future, including New York State. A decade ago, Jacobson, I and others laid out a specific plan for New York (Jacobson et al. 2013). In that peer-reviewed analysis, we demonstrated that our State could rapidly move away from fossil fuels and instead be fueled completely by the power of the wind, the sun, and hydro. We further demonstrated that it could be done completely with technologies available at that time (a decade ago), that it could be cost effective, that it would be hugely beneficial for public health and energy security, and that it would stimulate a large increase in well-paying jobs. I have seen nothing in the past decade that would dissuade me from pushing for the same path forward. The economic arguments have only grown stronger, the climate crisis more severe. The fundamental arguments remain the same.

The position that “it could be done completely with technologies available at that time” had an out-sized influence on the Climate Action Council decision to approve the Scoping Plan.  After all, if there are no technological barriers then it is simply a matter of political will. 

This session is proof that this belief is wrong.  The work of  Prof. C. Lindsay Anderson, Chair of Department of Biological and Environmental Engineering Cornell; Zach Smith, VP System Resource Planning, New York Independent System Operator; and Kevin Steinberger, Director, Energy and Environmental Economics all found that a new resource that has all the attributes of fossil-fired peaking units but without any emissions is needed.  Ultimately, the failure of the Hochul Administration to step and point out that the Integration Analysis that formed the basis of the Scoping Plan pointed out the need for this resource will have serious implications.

I have two worries. The first concern is that there are resource candidate technologies that are not commercially available.  There is a long road between theory and lab prototype tests and having a technology available that can be deployed to maintain reliability.  It is likely that many of the candidate technologies will fail this test.  Secondly, even if the technologies are viable there are issues related to deployment time and costs.  The Climate Act net-zero transition includes an ambitious schedule and there are affordability concerns.  Neither issue can be addressed at this time.

A more immediate concern is the push to retire existing fossil-fired resources as soon as possible.  This panel discussion showed that the belief that wind, solar, and energy storage are resources that can just be plugged into the New York City electric system to replace peaking power plants is dangerous.  Those existing facilities provide much more than electric energy and wind, solar, and energy storage don’t provide those other necessary services.  The session made the point that location matters and that there are spatial limitations in the City that could very well preclude development of alternative technology with different footprint requirements.  Eventually, someone is going to have to stand up and tell the vocal environmental justice advocates that their demands to shut down peaking power plants cannot be met.

Conclusion

It is not clear where the Department of Public Service is going to go with issues raised at this technical conference.  So far, the transition plan narrative has been based on the misplaced belief that no new technologies are needed.  This gave the crony capitalists selling the wind, solar, and energy storage resources the opportunity to make the plan all about building as much as possible as fast as possible.  Is there any chance that these technical issues will cause a change in direction? 

New York Zero-Emissions Resource Proceeding

The New York State Public Service Commission (PSC) recently initiated an “Order initiating a process regarding the zero-emissions target” that will “identify innovative technologies to ensure reliability of a zero-emissions electric grid”.  Implementation of the Climate Leadership & Community Protection Act (Climate Act) started soon after the law was passed at the end of 2019.  It was recognized early that “as renewable resources and storage facilities are added to the State’s energy supply, additional clean-energy resources capable of responding to fluctuating conditions might be needed to maintain the reliability of the electric grid” but here we are three and half years later finally getting around to address this critical requirement.  This post summarizes the proceeding, gives an overview of the questions raised by the PSC, and describes the comments I submitted.

I have been following the Climate Act since it was first proposed. I submitted comments on the Climate Act implementation plan and have written over 300 articles about New York’s net-zero transition.  I have extensive experience with meteorological aspects of electric generation because I have worked in the sector as a meteorologist for over four decades.  I have devoted a lot of time to the Climate Act and the issues raised in this proceeding because I believe the ambitions for a zero-emissions economy embodied in the Climate Act outstrip available renewable technology such that the net-zero transition will do more harm than good.  I represent the Environmental Energy Alliance of New York on the New York State Reliability Council Extreme Weather Working Group.  The opinions expressed in this article do not reflect the position of the Alliance, the Reliability Council, the Extreme Weather Working Group, any of my previous employers or any other company I have been associated with, these comments are mine alone.

Climate Act Background

The Climate Act established a New York “Net Zero” target (85% reduction and 15% offset of emissions) by 2050 and an interim 2030 target of a 40% reduction by 2030. The Climate Action Council is responsible for preparing the Scoping Plan that outlines how to “achieve the State’s bold clean energy and climate agenda.”  In brief, that plan is to electrify everything possible and power the electric grid with zero-emissions generating resources by 2040.  The Integration Analysis prepared by the New York State Energy Research and Development Authority (NYSERDA) and its consultants quantifies the impact of the electrification strategies.  That material was used to write a Draft Scoping Plan.  After a year-long review the Scoping Plan recommendations were finalized at the end of 2022.  In 2023 the Scoping Plan recommendations are supposed to be implemented through regulation and legislation.  The zero emissions analysis is part of that effort.

Overview of Process

The press release describes the process to “identify innovative technologies to ensure reliability of a zero-emissions electric grid”:

The New York State Public Service Commission (Commission) has initiated a process to examine the need for resources to ensure the reliability of the 2040 zero-emissions electric grid mandated by the Climate Leadership and Community Protection Act, or Climate Act.

“The Commission’s action reaffirms efforts to ensure New York has the needed clean-energy resources to replace existing fossil fuel-fired power plants,” said Commission Chair Rory M. Christian. “I am proud that New York continues to lead by advancing important clean energy initiatives, such as the one commenced today.”

The Climate Act, passed by the State Legislature in 2019, directs the Commission to establish, among other things, a program to ensure that by 2030, at least 70 percent of electric load is served by renewable energy, and that by 2040, there are zero emissions associated with electrical demand in the State. The initiative will help deliver on the Climate Act zero-emissions electric grid mandate and will enable the necessary types of clean energy to reach all New Yorkers. The Commission’s decision follows a substantial climate package announced by Governor Kathy Hochul in the FY24 enacted State Budget that will advance sustainable buildings, clean energy, and an affordable Cap-and-Invest program.

Today’s action recognizes that as renewable resources and storage facilities are added to the State’s energy supply, additional clean-energy resources capable of responding to fluctuating conditions might be needed to maintain the reliability of the electric grid. The Commission’s work to meet the Climate Act targets must include exploration of technologies that can support reliability once fossil generation has been removed from the system. The order initiates a process to identify technologies that can close the anticipated gap between the capabilities of existing renewable energy technologies and future system reliability needs. Within the order, the Commission asks stakeholders a series of important questions, including how to define ‘zero-emissions’ for purposes of the zero emissions by 2040 target, and whether that definition should include cutting edge technologies such as advanced nuclear, long duration energy storage, green hydrogen, and demand response. The order further elicits feedback from stakeholders on how to best design a zero-emissions by 2040 program, consistent with the Climate Act’s requirement of delivering substantial benefits to disadvantaged communities and New York State’s electric grid reliability rules, while also leveraging other state and federal efforts to research, develop, and deploy zero-emission resources.

After a 60-day public comment period, Commission staff will convene at least one technical conference to examine a series of issues and questions raised in this important proceeding. The Commission may take additional actions on zero-emission resources based on the information obtained through those processes.

Questions Asked

I have included the questions asked with some brief commentary.  I chose to only address one question related to my expertise and one short-coming in the Proceeding.  The Commission wants answers to “assist the Commission in determining what, if any, subsequent actions should be taken, which may include refinements to existing policies or establishing new policies.”

Question 1: How should the term “zero emissions,” as used under PSL §66-p(2)(b), be defined?

It has taken three and a half years to define what qualifies as “zero emissions” and address the problems associated with this resource.  Given its importance this should have been an immediate and high priority for the Climate Action Council.  The Order notes:

Following enactment of the CLCPA, the Commission issued the Order Adopting Modifications to the Clean Energy Standard, which aligns the existing Clean Energy Standard (CES) with the CLCPA renewable energy targets.

The pathway established by the CES Modification Order focuses on options for procuring sufficient renewable energy resources to meet CLCPA requirements. However, several studies indicate that renewable energy resources may not be capable of meeting the full range of electric system reliability needs that will arise as fossil generation is replaced. These studies suggest that there is a gap between the capabilities of existing renewable energy technology and expected future system reliability requirements. The Independent Power Producers of New York, Inc., New York State Building and Construction Trades Council, and New York State AFL-CIO (Petitioners) also raised this issue in a petition filed in this proceeding on August 18, 2021 (Zero Emissions Petition or Petition).

I did not provide any comments on this question.

Question 2: Should the term “zero emissions” be construed to include some or all of the following types of resources, such as advanced nuclear (Gen III+ or Gen IV), long-duration storage, green hydrogen, renewable natural gas, carbon capture and sequestration, virtual power plants, distributed energy resources, or demand response resources? What other resource types should be included?

If I were to respond to this question, I would simply say the only one of these resources that has a realistic chance of providing the services necessary is advanced nuclear.  That answer is obvious to anyone who has looked at the other options pragmatically.  I do not believe that a state that shut down 2,000 MW of operating nuclear will ever pivot to nuclear so I am not going to dilute my comments by stating the obvious.

Question 3: How should a program to achieve the Zero-Emission by 2040 Target address existing and newly constructed nuclear energy resources. Should the program be limited to specific types of nuclear energy technologies and exclude others?

It is obvious that keeping existing nuclear in operation as long as it is safe should be a priority but this is New York.  Responding to the specific types of nuclear question is beyond my existing knowledge and I do not have time to research a response.

Question 4: Should new measures adopted to pursue compliance with the Zero-Emission by 2040 Target focus exclusively on generation and resource adequacy, or should they also encompass a broader set of technologies that could be integrated into the transmission or distribution system segments, or installed and operated behind-the- meter?

Responding to this is beyond my existing knowledge and I do not have time to research a response.  My impression is that the broader technologies being considered are all magical solutions that are only being included to appease the green energy advocates.  They may play a role but it will be inconsequential.

Question 5: Should any program to achieve the Zero-Emission by 2040 Target specify subcategories of energy resources based on particular characteristics, such as ramp rates, the duration of their operational availability, or their emissions profile with respect to local pollutants?

I am sure that New York’s reliability experts will address the technical aspects of the energy resources needed.  I am not qualified to do so.  My comments do address the duration of the operational availability of this resource.

Question 6: What role does technology innovation need to play to meet the CLCPA’s Zero-Emission by 2040 Target?

Given that the Commission by way of this proceeding, the New York Independent System Operator (NYISO), and the New York State Reliability Council (NYSRC) all agree that there is no commercially available resource available that meets the need identified for dispatchable emissions free generation, I would say that technology innovation is an obvious prerequisite to the 2040 target.  My comments address the reliability and affordability implications of the technological innovations needed.

Question 7: Should life cycle emissions impacts be considered when characterizing energy resources? If so, how?

It would be inappropriate for me to respond to this question because my comments would be unprofessional.  I doubt that something along the lines of the following would be considered: “Why would the State want to start becoming unbiased in its consideration of energy resources now?  All of the possible life cycle impacts of fossil sources are included and none of the life cycle impacts of wind and solar are considered.  When there was no obvious characterization methodology for fossil fuel impacts available, they just made something up – so do the same.”

Question 8: Given that the feedstocks and other resources required to produce renewable natural gas are limited and will be in demand in other sectors of New York’s economy, how should this fuel be considered in the context of this proceeding?

This question answers itself.  There will never be enough renewable natural gas available to provide a meaningful contribution.  On the other hand, there are instances where emission reductions will be required and the capture and use of renewable natural gas makes sense.

Question 9: In what ways might a program to meet the Zero-Emission by 2040 Target require reexamination and possibly revision of different tiers of the Clean Energy Standard? Should one or more of the policy approaches that have been used to implement the CES be considered to meet the Zero-Emission by 2040 Target?

Responding to this is beyond my existing knowledge and I do not have time to research a response. 

Question 10: What is necessary to align a program to meet the Zero- Emission by 2040 Target with the priority of just transition embedded within the CLCPA?

The Just Transition rubric is a political construct.  I pride myself on pragmatic comments that balance impacts, costs, and benefits.  Those are not considerations that will be included in the just transition priorities so I did not submit a response to this question.

Question 11: How might the benefits of a program to meet the Zero- Emission by 2040 Target be measured for the purpose of ensuring that, consistent with PSL §66-p(7), it delivers “substantial benefits” to Disadvantaged Communities?

The substantial benefits to Disadvantaged Community rubric is another political construct.  It is disappointing that the State has so far ignored the benefits of a reliable and affordable electric grid relative to the alleged benefits and significant affordability and reliability risks to Disadvantaged Communities.

Question 12: NYISO has adopted an effective load carrying capacity (ELCC) rubric and treatment of Zones J and K as load pockets with special resource adequacy requirements. How should these constructs and other NYISO market rules inform design of a program meant to support the development and deployment of resources capable of achieving a zero emissions grid?

Responding to this is beyond my existing knowledge and I do not have time to research a response. 

Question 13: What additional studies, if any, should the Commission undertake with respect to the development and deployment of resources capable of achieving a zero emissions grid?

In the following section I describe my response to this comment.

Question 14: Given that New York is not the only jurisdiction investigating options and opportunities for the research, development, and deployment of new technologies capable of achieving a zero emissions grid, how should the State seek to coordinate with and otherwise draw upon efforts that are underway elsewhere?

This is another question that answers itself.  Given the challenges we need all the help we can get.  How to do that is beyond my pay grade.

My Comments

My comments addressed two concerns: duration of the operational availability of the zero-emissions resources and the need to address the feasibility and affordability conditions in  New York Public Service Law  § 66-p (4). “Establishment of a renewable energy program”.

In order to determine whether any of the innovative technologies to “ensure reliability of a zero-emissions electric grid” are adequate it is necessary to determine how much energy they can provide relative to the amount needed in the worst case.  I have been whining about the ultimate problem in the Integration Analysis for nearly three years.  On September 16, 2020 In their presentation to the Power Generation Advisory Panel E3 included a slide titled Electricity Supply – Firm Capacity.  Their presentation states: “As the share of intermittent resources like wind and solar grows substantially, some studies suggest that complementing with firm, zero emission resources, such as bioenergy, synthesized fuels such as hydrogen, hydropower, carbon capture and sequestration, and nuclear generation could provide a number of benefits.”  Those are the zero-emissions resources addressed by the Proceeding.  Of particular interest is the graph of electric load and renewable generation because it shows that this problem may extend over multiple days.

My comments explained that in New York the winter solar resource is poor because the days are short, the irradiance is low because the sun is low in the sky, and clouds and snow-covered panels contribute to low solar resource availability.  If there is a period of low winds, then the zero-emissions resource is needed to provide an economically viable resource solution.  Note that the magnitude of the zero emissions resource needed to address this issue will be a  significant percentage of system peak load and that the technology (green hydrogen, long-term battery, etc.) does not presently exist for utility scale application.

I also pointed out that the reliability concern is exacerbated for several reasons.  The future peak load will be in winter because the primary decarbonization strategy is electrification.   During extreme cold weather periods, natural gas used at power plants is diverted to other users and power plants must switch to oil.  There are fewer plants that have dual-fuel capability and over an extended event or a series of events the oil in storage could be depleted.  Finally, the coldest periods are also associated with wind lull periods because extreme cold is associated with large high-pressure systems that suppress wind resources.

If there are insufficient generating resources available to serve peak loads, then a disastrous blackout will result.  In February 2021, the Texas grid was unable to provide support load and resulted in as many as seven hundred deaths and billions in damages.  I stated that this proceeding must ensure that this situation does not happen in New York.

I described the NYISO resource adequacy planning process in my comments.  It has developed over many years and provides reliability planning projections based on the current mix of electric generating resources.  One of the important characteristics of the current system is that there is insignificant correlation between the unavailability of generating resources.  I believe that one of the significant findings of the New York State Reliability Council (NYSRC) Extreme Weather Working Group (EWWG) will be the observed correlation of the frequency and duration of low-wind episodes across the entire state, including the offshore wind development areas.  I emphasized that this finding must be considered in future planning. 

I have no doubt that these issues will eventually be addressed in the resource adequacy planning process and the reliability standards for the electric system.  However, in order to determine how to do this it is necessary to understand the worst case. In order to determine how large the DEFR capacity needs to be, the State must know how much energy was available for low renewable resource episodes of different lengths.  The EWWG is addressing this issue.  However, because of its importance I believe a more extensive analysis and possibly independent analysis by different organizations would be appropriate.  It is too important to rely on a single analysis of the expected worst-case availability.  Therefore, I recommend this study be addressed as part of this Proceeding.

My comments on this topic recommended what should be included in a worst-case analysis.  The most important aspect of any such analysis is to use as long an analysis period as possible.  Fortunately, meteorological reanalysis data generated by modern weather forecast models but using original observations since 1950 are available for this application.  The analysis should identify potential periods of low wind and solar availability and their frequency and duration.  Once worst case periods are identified, modeling that projects the specific resource availability during the worst periods should be performed.  That information can be used for future resource planning.

My second comment addresses the feasibility and affordability conditions in  New York Public Service Law  § 66 “Establishment of a renewable energy program”.  The Hochul Administration has not acknowledged that there is a “safety valve” if the implementation does not work out as imagined in the Scoping Plan.

Specifically, New York Public Service Law  § 66-p (4) states: “The commission may temporarily suspend or modify the obligations under such program provided that the commission, after conducting a hearing as provided in section twenty of this chapter, makes a finding that the program impedes the provision of safe and adequate electric service; the program is likely to impair existing obligations and agreements; and/or that there is a significant increase in arrears or service disconnections that the commission determines is related to the program”.  The plain reading of that is that if implementation cannot feasibly maintain reliability standards or adversely affects affordability can “temporarily suspend or modify the obligations” of the Climate Act.

In my opinion, if the Climate Action Council had spent time looking at overarching issues rather than getting bogged down in arguments about wording and the pet concerns of its members then this would have been addressed.  In this instance, they should have defined the reliability obligations, and affordability conditions for the commission.  They could have specified the metrics to be used and the limits at which it would be appropriate to pause implementation.  Because the Climate Action Council failed to provide recommendations, I commented that the Commission must establish those criteria.

Once the criteria are established then they can be used as a test for the acceptability of the proposed zero emissions resources.  As part of the process a feasibility analysis for each resource to determine the technological risks for the resource and potential costs must be prepared.  If the analysis projects that the § 66-p (4) criteria will be exceeded then the resource should not be considered.

Finally, I noted that my primary problem with the Climate Act is the mandate to go to zero without consideration of tradeoffs.  In this instance that mandate precludes an obvious solution.  New York’s oil-fired steam-electric generating stations could be used to provide the dispatchable generation needed for the worst-case extremes.  The facilities have on-site storage, significant capacity availability, and experience operating units that run rarely.  The units could be kept on-line, used for testing, training, and to be available for use in these extreme events.  The extreme events are easily forecasted days in advance so the units can be brought on-line to be available as needed.  I suspect that the cost to maintain those facilities will be far less than the cost of any zero-emission resource.  Overall, the emissions and air quality impacts will be far less of an issue than the ramifications of a blackout.  I recommended that this option be considered as part of this Proceeding.

Conclusion

This proceeding puts to rest the myth that the technology necessary for the electric system transition is available today.  In order to meet the 2040 “zero emissions” electric generating resource requirement, this zero emissions resource is needed. 

My comments were confined to two overarching issues that must be resolved in order to evaluate New York’s “zero-emissions” resources.  The energy that the resource needs to provide to replace wind and solar resources during low availability periods must be known in order to determine how much will be needed.  I recommended that an analysis that uses as long a period as possible be included as part of the Proceeding.  My other concern is that the acceptability of zero-emissions resources should be based on well-defined standards of reliability feasibility and affordability.  I recommended that the Proceeding define these criteria.

This is a necessary component of the net-zero transition.  Unfortunately the need for this Proceeding has been known since the implementation began and it should have been part of the discussions of the Climate Action Council in 2020. 

The Problem with Overbuilding Wind and Solar

The Climate Leadership & Community Protection Act (Climate Act) net-zero transition plan includes a requirement for “zero-emissions” electric generating by 2040.  New York’s irrational energy policies preclude the only proven zero-emissions choice (nuclear energy) to meet that requirement.  Instead, the emphasis is on solar and wind development.  A recent post at Trust, yet verify includes a great graphic that illustrates an inherent flaw with wind and solar that Climate Act implementation must address.

I have been following the Climate Act since it was first proposed. I submitted comments on the Climate Act implementation plan and have written over 300 articles about New York’s net-zero transition. The opinions expressed in this post do not reflect the position of any of my previous employers or any other company I have been associated with, these comments are mine alone.

Climate Act Background

The Climate Act established a New York “Net Zero” target (85% reduction and 15% offset of emissions) by 2050 and an interim 2030 target of a 40% reduction by 2030. The Climate Action Council is responsible for preparing the Scoping Plan that outlines how to “achieve the State’s bold clean energy and climate agenda.”  In brief, that plan is to electrify everything possible and power the electric grid with zero-emissions generating resources by 2040.  The Integration Analysis prepared by the New York State Energy Research and Development Authority (NYSERDA) and its consultants quantifies the impact of the electrification strategies.  That material was used to write a Draft Scoping Plan.  After a year-long review the Scoping Plan recommendations were finalized at the end of 2022.  In 2023 the Scoping Plan recommendations are supposed to be implemented through regulation and legislation. 

Implementation

In order to get a sense of the magnitude of the renewable resource development necessary to implement the Climate Act this section shows the expected changes to load and generating resources. 

The New York Independent System Operator (NYISO) 2023 Load & Capacity Data Report (also known as the “Gold Book”) 2023 Load & Capacity Data Report (Gold Book) lists the 2022 observed load and projections out to 2053.  The following excerpt shows Table I 1-a baseline energy and demand data to 2040.

There are two relevant projections for future generating resources.  The “official” Hochul Administration projections are in the Final Scoping Plan.   The NYISO projections are in the 2021-2040 System & Resource Outlook  I compare the installed capacity for Scoping Plan and the Resource Outlook in the next table.  For this post I am only concerned with the total generation projections.

In 2022 the peak observed load was 31,709 MW and the installed summer capability 37,178 MW. In 2030 the NYISO Gold Book baseline predicted summer peak load is 32,490 MW and 36,930 MW in 2040.  The peak winter load is 28,970 in 2030 and 44,800 in 2040. In the following table, I list the maximum capability and peak load data and calculate the capability to peak load margin. 

The NISO Gold Book Table V-3 lists the historical Installed Reserve Margin (IRM) values for the New York Control Area and the historical minimum Locational Capacity Requirements (LCRs) approved by the NYISO for Zones G-J, Zone J, and Zone K.  The IRM requirements are established each year by the New York State Reliability Council (NYSRC).  The IRM represents the minimum level of capacity, beyond the forecasted peak demand, which utilities and other energy providers must procure to serve consumers.  This post is not going to address the LCRs. 

As shown here New York will require an unprecedented level of new wind and solar development in order to meet the net-zero transition mandates of the Climate Act.  Note that the capability to peak margin calculated in the preceding table is not exactly the same as the IRM but the expectation is that the IRM will increase significantly in the future.  The reason for this IRM shift is that wind and solar are intermittent and overbuilding those resources is necessary to address that intermittency.  While overbuilding is suggested as the solution for the best energy plan the question is how much is enough and whether it is a solution that eliminates the need for any new resources.

One Third on Average

I am convinced that overbuilding is not as viable a solution as its proponents claim.  However, trying to explain the reasons why is complicated so I have been looking for a more-easily understood graphical explanation.  Michel Opdbe wrting at the at Trust, yet verify blog has just such a graphic.

Opdbe lives in Belgium and writes about renewable energy policies in Belgium and adjoining countries.  His recent post addressed a claim that on average of 1/3 of the total electricity demand in the Netherlands is now supplied by sun, wind and water. The post was based on a tweet with this message (translated from Dutch):

An average of 1/3 of the total electricity demand in the Netherlands is now supplied by sun, wind and water. The record is from Sunday 24 April, with a nice 68%.
The low of last winter was on November 30, with only 4%.
#graphoftheday

It was accompanied by a graph showing the daily energy production by solar, wind and water as percent of total demand of the Netherlands:

He explains:

The thick yellow line is the four weeks moving average and, indeed, it ends up at roughly one third of demand at the beginning of 2023. That is however only part of the story, as also hinted by the two values that are mentioned in the text of the tweet.

Although the average ends up around one third of demand, it is derived from a incredibly wide range. According to the tweet, solar and wind together with water produced between 4% and 68% of total demand in 2022 in the Netherlands.

There is also something in this graph that drew my attention, but it is not that clear from that graph. Unfortunately, I don’t have the data from the Netherlands. Luckily, this dynamic is not unique to the Netherlands, it is exactly the same in Belgium and the Belgian data is readily available.

In my opinion this dynamic is universal across all jurisdictions that are moving to a reliance on wind and solar.

This is a recreation of that graph using the Belgian data (only solar and wind, water power in Belgium is negligible):

The Belgian figures are close to that of the Netherlands, albeit a bit lower. The average share of Belgian solar and wind as percent of demand is roughly one fourth (compared to one third of the Netherlands). The range of the Belgian data is also somewhat smaller (between 1 and 58%) compared to the Netherlands (between 4 and 68%). The overall shape is however similar. There is the same funnel shape that is widening the more capacity is added.

The following graphic illustrates the problem well.

Now it is easier to highlight a bit more the wide range that this average is derived from. These are the minimum and maximum values of the share of solar and wind in demand of each year:

It is clear that the lower and upper boundaries don’t increase in the same way The lower boundary is hardly budging, it keeps close to the x-axis over the entire period. In 2022, the lowest daily share supplied by solar and wind was only about 1% of total demand. This didn’t change much over the years: it was roughly between 0.7% and 1.8% of demand between 2014 and 2022. This tells us that a lot of dispatchable capacity will still be needed at specific times of the year (in this case, pretty close to the expected demand and, looking at its shallow slope, that might be the case for quite a while).

The upper boundary behaves different. It shoots up exponentially. In 2022, the highest daily share supplied by solar and wind was 58% of total demand, coming from around 20% in 2014.

Meaning that the difference between the lower and upper boundary will keep increasing over time. Basically, electricity production by solar and wind will at times start to exceed demand, while the need for backup at specific times of the year will stay high.

The key point illustrated in this graph is that over building wind and solar does not help much for those periods when wind and solar resources are low due to the weather.

Some people also seem to recognize this type of dynamic. Already the first comment below the tweet nails it (translated from Dutch):

If we now just install three times as much, then we have more than twice too much at the peak and are almost 90% short at the lowest point.

I couldn’t have said it better.

Discussion

Based on every study of intermittent wind and solar that I have seen, the difference between the lower and upper boundary of wind and solar output will keep increasing over time as these resources are added to any electric system.   New York is not as bad as Belgium and Netherlands but it is the reason that the New York IRM will increase from around 20% to on the order of 150% in 2040.   The reason for this universal truth is that meteorological conditions that cause light winds are geographically large.  When the wind is light at one site in New York it is very likely that winds are light across the state.  Data from Australia shows a similar effect across that entire continent.

There are a couple of ramifications.  First, overbuilding is not a complete solution.  Grid operators must always match load with generation.  Therefore, resource adequacy planning must have a solution even at the minimum wind and solar generation output.  If the overall state-wide wind generation capacity is only 10% you would need to overbuild by a factor of ten to provide power at night.  Aside from the cost I believe that amount of wind development exceeds the expected wind resource availability in New York.  In order to address this a new technology is needed.  The New York State Public Service Commission (PSC) recently initiated an “Order initiating a process regarding the zero-emissions target” that will “identify innovative technologies to ensure reliability of a zero-emissions electric grid” for this reason.

The other part of the problem is that when wind and solar resources are over-built there will be more and more periods when their output exceeds demand. When that happens the electricity market has issues.  Many wind and solar contracts are written such that the operators are paid whether or not the energy produced is needed.  For example, the Ontario Independent Electricity System Operator must get rid of the unneeded power by selling it to neighboring control areas at below market costs.  New York is a big purchaser of this cheap power.  While those purchases drive costs down for ratepayers it also adversely affects the viability of in-state generating facilities.  On the other hand, during the light wind conditions in-state generating facilities are needed so it may reach the point that they have to be subsidized to be available.  Eventually New York will be in a similar position to Ontario.  It turns out that the low- price sales are subsidized by Ontario ratepayers.  When everyone has over-built I also wonder where the excess power will be dumped.

Conclusion

The graph of solar and wind generation resources as a fraction of the total resources shows a characteristic shape that proves that over building wind and solar generation does not help always fulfill load requirements.  Electric grid operators must match the output of generating resources  at all times so this means the problem has to be addressed.  Further compounding the problem is the fact that peak loads are associated with temperature extremes that are linked to high-pressure systems that also create light winds.  In other words the over-building effect is most pronounced when energy demand peaks exacerbating the risks to reliability when electricity is needed most.

At least one commenter understands the problem when he said “If we now just install three times as much, then we have more than twice too much at the peak and are almost 90% short at the lowest point”.  I agree with Opdbe – I couldn’t have said it better.

The unanswered questions are how will the Climate Act implementation address this problem, what will it cost, and will it be able to maintain current standards of reliability.

The Problem with Averages

The Climate Leadership & Community Protection Act (Climate Act) net-zero transition plan mandates a 40% reduction in Greenhouse Gas (GHG) emissions from a 1990 baseline.  It is not clear how that target is supposed to be interpreted and much less clear what resources need to come on-line in order to make those targets.  For the electric sector, however, there is a resource that provides a projection of future generating resource deployments.  This post looks at that data and whether it can be used to simply estimate the status of wind and solar development relative to Climate Act targets.

I have been following the Climate Act since it was first proposed. I submitted comments on the Climate Act implementation plan and have written over 300 articles about New York’s net-zero transition. The opinions expressed in this post do not reflect the position of any of my previous employers or any other company I have been associated with, these comments are mine alone.

Climate Act Background

The Climate Act established a New York “Net Zero” target (85% reduction and 15% offset of emissions) by 2050 and an interim 2030 target of a 40% reduction by 2030. The Climate Action Council is responsible for preparing the Scoping Plan that outlines how to “achieve the State’s bold clean energy and climate agenda.”  In brief, that plan is to electrify everything possible and power the electric gride with zero-emissions generating resources by 2040.  The Integration Analysis prepared by the New York State Energy Research and Development Authority (NYSERDA) and its consultants quantifies the impact of the electrification strategies.  That material was used to write a Draft Scoping Plan.  After a year-long review the Scoping Plan recommendations were finalized at the end of 2022.  In 2023 the Scoping Plan recommendations are supposed to be implemented through regulation and legislation. 

Interconnection Queue

The electric power grid is the world’s largest machine.  New York’s electric system is connected to the Eastern Interconnection which spans the country from Nova Scotia to Louisiana and Key West Florida to Saskatchewan.  The complications associated with ever increasing dependence upon intermittent wind and solar is a major reason why I am skeptical about the Climate Act. When any new generating resource wants to connect to the New York transmission system, the New York State Independent System Operator (NYISO) must go through a detailed interconnection process to ensure compatibility between the new resource and the existing system.  One product of that process is a list of all proposed projects in the Interconnection Queue available at the interconnection process website.  The spreadsheet lists the projects by electrical output, type of resource and fuel used, the location, the licensing and approval status, and the proposed in-service date.

I downloaded the interconnection queue data in mid-April and summarized the current status of expected new resources.  I eventually figured out that the queue included all interconnections from proposed generating resources not just one interconnection per development so I could not simply sum up the resource capacity totals.  This primarily affected the offshore wind facilities that hookup to the transmission system in multiple locations.  In order to address this, I manually went through the queue spreadsheet and removed projects that I thought represented multiple connections. The following table shows the generation capacity in MW expected to be developed for projects in the queue and the expected power capacity by in service year.  There are relevant caveats to this information for our purpose.  There is no distinction between onshore and offshore wind but all the wind proposed to interconnect in Zone J (New York City) and Zone K (Long Island) is offshore wind so the onshore wind component is the difference between the total and the sum of those zones.  The NYISO process is only concerned with utility-scale solar resources that connect directly to the grid so the solar total does not include distributed solar.

The question for this post is whether this information can be used to simply estimate the status of wind and solar development relative to Climate Act targets. If we assume that the development of these resources directly displaces fossil-fired resources then we can compare the results to the target.  In order to displace existing fossil-fired generation the power capacity must be converted to energy.  The following tables consider only the wind and utility-scale solar power capacity (MW) in the interconnection queue accumulated by year.  I converted this capacity (MW) to energy GWh by using the NYISO assumed capacity factors.  The capacity factor is the average expected energy production divided by the maximum possible energy production. The cumulative expected electric generation per year is shown in the next table.  Assuming that every GWh produced by these renewable resources displaces fossil generation that emits 463.9 metric tons per GWH enables an estimate of the annual displacement per year can be made.  Using this methodology, the wind and solar resources in the interconnection queue will displace 51.2 million metric tons of CO2 in 2030.

Electric Sector Emissions and Targets

I estimated the 2030 target by using data from the DEC annual GHG emission inventory. The latest inventory of the Statewide GHG Emissions Report (available at this website) was published in December 2022 and contains data for 2020.  The emission information is also available for download from Open Data NY.  The Climate Act mandates unique emissions accounting procedures that include emissions from imported electricity, imported fossil fuels, and electric transmission as well as the direct emissions of CO2. 

The following table lists the 1990 baseline, the 2030 target (40% reduction of the baseline, and the observed emissions data from the most recent inventory.  DEC makes the point that the 2020 emissions were not representative and suggests using 2019 data for the current status.  The electric sector total baseline emissions were 94.5 million metric tons of CO2e (MMT CO2e) so the 2030 40% reduction target is 56.7.  In 2019 the total sector emissions were 50.7 MMT CO2e.  Emissions for all the subsectors including the Open Data NY data are also shown.  However, New York State shut down 2,000 MW of zero emissions nuclear generation at Indian Point and that increased direct fuel combustion emissions to 27.7 MMT CO2e.  Assuming that the imported fossil fuels for electric power would increase in proportion to the 2019 to 2022 change in emissions and that all the other sub-sector emissions stays the same results in an overall estimate of 60.5 MMT CO2e for 2022.

Open Data NY Greenhouse Gas Emissions Electricity Sector Emissions

The previous section estimated the emissions from generation displaced by the development of the wind and solar resources in the NYISO interconnection queue.  According to this crude estimate the new resources will displace fossil generation expected to produce 51.2 MMT CO2e for the fuel combustion in the electric power subsector.  That is more than the combined 2022 fuel combustion and imported fossil fuels for electric power subsectors which implies that if these resources get built that compliance will be ensured.  Unfortunately, this approach does not tell the whole story because it relies on averages.

Problem with Averages

In September 2021, Terry Etam wrote an article that I think clearly explained the problem with using averages like I did in the analysis above.  While his predictions that there would be a European energy shortage in the winter of 2021 -2022 did not turn as he predicted, the concepts he described are relevant.

His article introduced the problem:

Well, maybe I’d like to talk about statisticians, as in the old joke about the one that drowned because he forded a river that was only three feet deep, on average. See, isn’t that better than politics already? However, as funny as a drowned statistician may be, there is a serious side to the problem with relying on averages. You really can die, for starters.

Before getting back to death and/or politics again (redundancy, I know), let’s think about the use of averages. A car may be designed for the average – one doesn’t find the tallest person on earth and design an interior to accommodate them. The exceptions get to either bang their shins or dangle their feet, but that’s the way it has to be.

In other areas, it can’t work that way. Do you insulate your house for average conditions? No, of course not. Do you install an air conditioner for average conditions? Same. And on it goes. When the risk of harm goes up, we design for the extremes, not the averages. Or we should.

A whole world of trouble will come your way if your plans are built on averages but you cannot live with the extremes. Or even with substantial variations. Europe, and other progressive energy parts of the world, are finding this out the hard way. 

Etam then explained how this issue is relevant to the net-zero transition:

In the race to decarbonize the energy system, wind and solar have taken a dominant lead. Nuclear is widely despised. Hydrogen has potential, but is a long way out, as a major player. On the assumption that Hydrocarbons Must Go At Any Cost, wind and solar are the winners. Bring on the trillions. Throw up wind turbines everywhere. Blanket the countryside in solar panels.

The media loves the wattage count as fodder for headlines; big numbers dazzle people. “The United States is on pace to install record amounts of wind and solar this year, underscoring America’s capacity to build renewables at a level once considered impossible…The U.S. Energy Information Administration expects the U.S. will install 37 gigawatts of new wind and solar capacity this year, obliterating the previous record of almost 17 GW in 2016,” bleated the ironically named Scientific American website. Wow, gigawatts. No idea what those are but they sound huge. 

What is the problem with all that capacity? Well, how good is it? Let’s see…at a 33 per cent capacity factor (used by the US government as apparently reasonable), that 37 GW is just over 12 GW of power contributed to the grid, on average. The assumption seems to be then that 12 GW of dirty old hydrocarbons have been rendered obsolete, and, for the energy rube, the number is an even more righteous 37 GW, because, you know, some days it is really windy all over.

But, what happens when that load factor is…zero? Because it happens.

This is the critical point.  In the existing system outages are independent of each other.  If there are five 100 MW gas turbines each with an 80% capacity factor it is reasonable to expect that four of the turbines will be available at any one time.  That is not the case for solar and wind.  None of the solar resources will be available at night.  With regards to wind, it turns out that the reason for light winds is a high-pressure system and those systems are typically bigger than New York so when one wind turbine is producing low power due to light winds, odds are most of the others are too.  Etam explains what has happened in Great Britain:

The current poster child for the issue is Great Britain. The UK has 24 GW of wind power installed. The media loves to talk about total renewable GW installed as proof of progress, and the blindingly rapid pace of the energy transition. 

However over the past few weeks wind dropped almost to zero, and output from that 24 GW of installed capacity fell to about 1 or 2 GW. 

Ordinarily, that would be no problem – just fire up the gas fired power plants, or import power from elsewhere.

But what happens when that isn’t available? 

More pertinently, what happens when the likelihood of near-zero output happens to coincide with the times when that power is needed most – in heat waves, or cold spells? That brings us to the current grave situation facing Europe as it heads towards winter. Gas storage is supposed to be filling rapidly at this time of year, but it’s not, for a number of reasons.

This happens everywhere.  It is exactly the issue that the Integration Analysis, New York Independent System Operator (NYISO), and New York State Reliability Council all said required an entirely new generating resource to solve but the Climate Action Council chose to ignore because one Council member with an out-sized influence but little relevant experience claimed was not an issue.  Etam goes on to pull no punches when he describes the resulting impacts. 

Let’s drive this energy conundrum home a little better for all these people who are, as Principal Skinner put it on the Simpsons, “furrowing their brows in a vain attempt to comprehend the situation.”

The world has been sold a faulty bill of goods, based on a pathetically simplistic vision of how renewable energy works. A US government website highlights the problem with this example: “The mean turbine capacity in the U.S. Wind Turbine Database is 1.67 megawatts (MW), At a 33% capacity factor, that average turbine would generate over 402,000 kWh per month – enough for over 460 average U.S. homes.”

Thus armed, bureaucrats and morons head straight to the promised land by multiplying the number of wind turbines by 460 and shocking-and-awing themselves with the results. Holy crap, we don’t need natural gas anymore (as they tell me in exactly those words).

So they all start dismantling the natural gas system – not directly by ripping up pipelines, but indirectly by blocking new ones, by championing ‘fossil-fuel divestment campaigns’, by taking energy policy advice from Swedish teenagers – and then stand there shivering in dim-witted stupor when the wind stops blowing, and the world’s energy producers are not in any position to bring forth more natural gas.

It’s not just Britain that is squirming. A Bloomberg article (which I cannot link to as I will never willingly send Bloomberg a cent) notes the following unsettling news: “China is staring down another winter of power shortages that threaten to upend its economic recovery as a global energy supply crunch sends the price of fuels skyrocketing. The world’s second biggest economy is at risk of not having enough coal and natural gas – used to heat households and power factories – despite efforts over the past year to stockpile fuel as rivals in North Asia and Europe compete for a finite supply.”

In my opinion this is a good representation of the situation facing New York State as a result of the Climate Act.

Conclusion

The assumption that an overall capacity factor can be used with the projected new generation capacity in the interconnection queue to estimate the displacement of fossil fuel resources is wrong because of the strong correlation between all the solar resources and all the wind resources in New York.  The only way to address this is with detailed resource modeling like the analyses from the NYISO.  I don’t even think that the NYISO resource adequacy modeling is currently capable of completely addressing the problem of the correlated renewable generating resources for the worst case.  I know that the wind and solar variability issue is a priority for improvements.  In the meantime, the NYISO modeling is the best resource we have and should be used to determine how the wind and solar resources in the queue will displace fossil-fired resource emissions.  Clearly, the state deserves an analysis that shows where we stand relative to these targets using the NYISO model results.

Etam goes on to make the point that this mis-understanding is going to lead to energy shortages in worst case situations that will result if the Climate Act implementation fails:

Hundreds of millions of people without adequate heating fuel in the dead of winter is not particularly funny. If a cold winter strikes, all the yappiest energy-transition-now dogs will fade into the woodwork, distancing themselves from the disinformation they’ve propagated and the disaster they’ve engineered. People in position of responsibility will have no choice but to speak out loud the words they’ve dared not utter for a decade: you need hydrocarbons, today, tomorrow, and for a very long time yet. So start acting like it.

Climate Act Renewable Intermittency Challenge

One of the difficulties associated with describing the challenge of the Climate Leadership & Community Protection Act (Climate Act) is that many of the concepts are difficult to describe to the general public.  Tyler Duren writing at Zero Hedge published an article, The Renewable Intermittency Challenge, that did a good job introducing the challenges associated with intermittency.  This post expands upon his article because I think he underestimates the difficulty of a solution.

I have been following the Climate Act since it was first proposed. I submitted comments on the Climate Act implementation plan and have written over 300 articles about New York’s net-zero transition because I believe the ambitions for a zero-emissions economy embodied in the Climate Act outstrip available renewable technology such that the net-zero transition will do more harm than good.  The opinions expressed in this post do not reflect the position of any of my previous employers or any other company I have been associated with, these comments are mine alone.

Climate Act Background

The Climate Leadership & Community Protection Act (Climate Act) established a New York “Net Zero” target (85% reduction and 15% offset of emissions) by 2050 and an interim 2030 target of a 40% reduction by 2030. The Climate Action Council is responsible for preparing the Scoping Plan that outlines how to “achieve the State’s bold clean energy and climate agenda.”  In brief, that plan is to electrify everything possible and power the electric gride with zero-emissions generating resources by 2040.  The Integration Analysis prepared by the New York State Energy Research and Development Authority (NYSERDA) and its consultants quantifies the impact of the electrification strategies.  That material was used to write a Draft Scoping Plan.  After a year-long review the Scoping Plan recommendations were finalized at the end of 2022.  In 2023 the Scoping Plan recommendations are supposed to be implemented through regulation and legislation.

Over many years New York electric planners have developed modeling procedures that project the resource adequacy necessary to maintain current reliability standards that keep the lights on when needed the most. The current reliability procedures were developed for generation resources that can be turned on, ramped up, ramped down, and turned off as needed, have well understood forced outage rates, and do not necessarily stop operating all at the same time.   Wind and solar resources do not have any of those characteristics which makes future reliability planning much more difficult.  This post looks at the problem of intermittency.

Intermittency Challenge

All quotations below are from the article The Renewable Intermittency ChallengeTo be fair my criticisms of this work are based on the presumption that intermittency is a significant problem when the energy system is intended to get to a net-zero target.  Author Tyler Duren introduces the challenge by giving an overview of the electric system:

The U.S. has a dynamic electricity mix, with a range of energy sources generating electricity at different times of the day.

At all times, the amount of electricity generated must match demand in order to keep the power grid in balance, which leads to cyclical patterns in daily and weekly electricity generation.

The graphic below, via Visual Capitalist’s Govind Bhutada and Sabrina Lam, tracks hourly changes in U.S. electricity generation over one week, based on data from the U.S. Energy Information Administration (EIA).

It may difficult to read the summary of the renewable intermittency challenge in the previous figure.  It says “Unlike conventional sources of electricity, wind and solar are variable and location-specific.  This is a concern for grid operators, especially as more renewable capacity is deployed”.  I agree with this description.

Duren goes on to explain that the electric load is met with three types of power plants.  He describes daily load cycles and the use of these power plants.  In my opinion, some peaking power plants are not normally used for daily load variations.  Some of these units only are operated at times of high loads like an extended period of hot weather and high loads.

The Three Types of Power Plants

Before diving in, it’s important to distinguish between the three main types of power plants in the U.S. electricity mix:

  • Base load plants generally run at full or near-full capacity and are used to meet the base load or the minimum amount of electricity demanded at all times. These are typically coal-fired or nuclear power plants. If regionally available, geothermal and hydropower plants can also be used as baseload sources.
  • Peak load or peaking power plants are typically dispatchable and can be ramped up quickly during periods of high demand. These plants usually operate at maximum capacity only for a few hours a day and include gas-fired and pumped-storage hydropower plants.
  • Intermediate load plants are used during the transitory hours between base load and peak load demand. Intermittent renewable sources like wind and solar (without battery storage) are suitable for intermediate use, along with other sources.

This simplistic overview did not explain the difficulties facing a system that relies on intermittent wind and solar.  In an article co-authored with Russel Schussler we explained some of the issues with peaking power when most of the energy is supplied by wind and solar.

Duren goes on to show how electricity generation meets load on an hourly basis.

Zooming In: The U.S. Hourly Electricity Mix

With that context, the table below provides an overview of average hourly electricity generation by source for the week of March 7–March 14, 2023, in the Eastern Time Zone.

It’s worth noting that while this is representative of a typical week of electricity generation, these patterns can change with seasons. For example, in the month of June, electricity demand usually peaks around 5 PM, when solar generation is still high, unlike in March.

Natural gas is the country’s largest source of electricity, with gas-fired plants generating an average of 176,000 MWh of electricity per hour throughout the week outlined above. The dispatchable nature of natural gas is evident in the chart, with gas-fired generation falling in the wee hours and rising during business hours.

Meanwhile, nuclear electricity generation remains steady throughout the given days and week, ranging between 80,000–85,000 MWh per hour. Nuclear plants are designed to operate for long durations (1.5 to 2 years) before refueling and require less maintenance, allowing them to provide reliable baseload energy.

On the other hand, wind and solar generation tend to see large fluctuations throughout the week. For example, during the week of March 07–14, wind generation ranged between 26,875 MWh and 77,185 MWh per hour, based on wind speeds. Solar generation had stronger extremes, often reaching zero or net-negative at night and rising to over 40,000 MWh in the afternoon.

Because wind and solar are often variable and location-specific, integrating them into the grid can pose challenges for grid operators, who rely on forecasts to keep electricity supply and demand in balance. So, what are some ways to solve these problems?

Duren suggests that these challenges can be solved.  His suggestions will be the focus of the remainder of this post.  Rafe Champion describes the issue of wind droughts that undermines the ability of these solutions to work in a system that relies heavily on wind and solar.  If the renewables are only intended to augment the existing system much of the following discussion is appropriate.  However, the only reason to install wind and solar is to mitigate climate change which requires a net-zero solution so I do not believe there is any reason to consider limited penetration of renewables.

Solving the Renewable Intermittency Challenge

As more renewable capacity is deployed, here are three ways to make the transition smoother.

  • Energy storage systems can be combined with renewables to mitigate variability. Batteries can store electricity during times of high generation (for example, in the afternoon for solar), and supply it during periods of peak demand.
  • Demand-side management can be used to shift flexible demand to times of high renewable generation. For instance, utilities can collaborate with their industrial customers to ensure that certain factory lines only run in the afternoon, when solar generation peaks.
  • Expanding transmission lines can help connect high-quality solar and wind resources in remote regions to centers of demand. In fact, as of the end of 2021, over 900 gigawatts of solar and wind capacity (notably more than the country’s current renewable capacity) were queued for grid interconnection.

Energy Storage

Duren makes a common mistake when describing the electric system. He only talks about average conditions.  His description of energy storage systems only addresses daily variations: “Batteries can store electricity during times of high generation (for example, in the afternoon for solar), and supply it during periods of peak demand.”  The bigger problem is that wind and, to a lesser extent, solar can also be subject to longer periods of reduced output that complicates energy storage requirements.  In a net-zero electric system I believe that wind droughts are a fatal flaw because existing energy storage technology is too limited and too expensive.

Francis Menton writing at the Manhattan Contrarian described work by Bill Ponton that addressed energy storage requirements for the Climate Act transition plan over longer time periods than a day.  They evaluated “Initial Report on the New York Power Grid Study”  which includes the following table of how much wind, solar and storage capacity needed to meet the net-zero transition targets of the Climate Act .

Menton describes the energy storage provisions:

But far more absurd is the provision in this Report for prospective energy storage. Note the numbers in the table above — 3 GW in 2030 and 15.5 GW in 2040. As usual they leave out the duration of the batteries. But Ponton wrote to the lead author of the Report from the Brattle Group, a guy named Hannes Pfeifenberger, to get the information. Result:

I asked one of the principal authors of the NY Power Grid study report, Hannes Pfeifenberger, how did he intend to balance fluctuations in wind power and he stated that the biggest factor was 17 GW of battery storage with a maximum duration of 6-hr, totaling 102 GWh. His response is surprising. I calculated that with wind power capacity of 84 GW,  there was 59,851 GWH of wind energy curtailed and 48,071 GWH of gas turbine energy used. In theory, the curtailed wind energy could be stored and then subsequently discharged to substitute for the energy provided by the gas turbines, but would require energy storage of 12,000 GWH. 

102 GWh versus 12,000 GWh. So, as usual with the studies we can find for places like New York and California, they’re off on the storage requirement by a factor of more than 100.

I have tried to make my own estimates of energy storage requirements and they are the same order of magnitude as described here.  The main point is that Duren does not address this problem at all.

Demand-Side Management

Simplistic evaluations of net-zero transition programs also suggest that reducing load through programs like demand-side management can be a viable solution.   There are two issues.  The first is that net-zero programs refer to the entire economy and emission reductions from transportation and residential heating, hot water, and cooking, rely on electrification which necessarily increases load.  This is a particular problem when loads are highest.  Duren writes that “Demand-side management can be used to shift flexible demand to times of high renewable generation. For instance, utilities can collaborate with their industrial customers to ensure that certain factory lines only run in the afternoon, when solar generation peaks.”  There is a limited amount of load shifting possible when temperatures are coldest, electric vehicle charging and battery capabilities are lowered, and everyone needs electricity to keep warm.

Expanding Transmission Capabilities

Another favorite solution of naïve energy analysts is predicated on the concept that the wind is always blowing somewhere.  Duren writes: “Expanding transmission lines can help connect high-quality solar and wind resources in remote regions to centers of demand. In fact, as of the end of 2021, over 900 gigawatts of solar and wind capacity (notably more than the country’s current renewable capacity) were queued for grid interconnection.”  In general that is true and that might work for a net-zero electric system on average.  Unfortunately, the coldest and hottest weather, and thus the highest load, is strongly correlated with high pressure systems that also have the lowest wind resources. 

In a presentation describing my skeptical concerns about the Climate Act I addressed this problem in detail.  In brief, consider the following weather map of February 17, 2021 during the period of the Great Texas Freeze. This event was associated with an intensely cold polar vortex huge high-pressure system.  Remember that winds are higher when the isobars are close together.  On this day there are light winds from New York to the southeast, west, and north including the proposed New York offshore wind development area.  There are packed isobars in northeastern New England, in the western Great Plains, and central Gulf Coast where wind resources would be plentiful.  For New York to guarantee wind energy availability from those locations, wind turbines and the transmission lines between New York and those locations would have to be dedicated for our use.  Otherwise, jurisdictions in between would claim those resources for their own use during these high energy demand days.  It is unreasonable to expect that this could possibly be an economic solution.

Conclusion

I liked the introduction of Duren’s article.  He gives a good overview of the balancing act necessary to constantly match generating resources with the load.  The graphics illustrate his points well too.  He does not explicitly address net zero targets and that avoids addressing the problem that what works for today’s systems will not work when the system relies on intermittent renewables.  In the context of a net-zero electric system that eliminates fossil-fired generation, I do not believe his conclusion that there are readily available solutions that address the intermittency challenge is correct.

If the future electric system has to rely on weather-dependent resources, then the question of worst-case availability has to be addressed.  Analyses done to date in New York State have all shown that there are wind lulls in the winter that are difficult to address using existing energy storage technology.  The Integration Analysis and the New York Independent System Operator Resource Outlook analyses of future resource requirements have both concluded that the solutions recommended by Duren are inadequate and a new dispatchable emissions-free resource (DEFR) must be developed to address the wind lull intermittency problem.  The Resource Outlook notes “The lead time necessary for research, development, permitting, and construction of DEFR supply will require action well in advance of 2040 if state policy mandates under the CLCPA are to be achieved”. 

In addition to the challenge of developing an entirely new resource, in order to determine the resource capabilities necessary for the worst-case, a comprehensive analysis of wind and solar resource availability is needed.  If that analysis does not get the right resource availability, then there will not be enough energy available to supply everyone who needs it during the worst conditions.  If either of these challenges is not met adequately, people will freeze to death in the dark.

Arctic Blast Foreshadows Problems with Climate Act Renewable Future

This past Friday and Saturday (February 3-4 2023) there was a brief shot intensely cold air to the Northeast US.  This post includes a couple of descriptions of the implications of this weather event relative to the Climate Leadership and Community Protection Act  (Climate Act) and I present some data describing the event.

This is another article about the Climate Act implementation plan that I have written because I believe the ambitions for a zero-emissions economy embodied in the Climate Act outstrip available renewable technology such that the net-zero transition will do more harm than good.  The opinions expressed in this post do not reflect the position of any of my previous employers or any other company I have been associated with, these comments are mine alone.

I am Thankful – Mark Stevens

Mark is a regular reader at this blog and has contributed several recent items for posting.  He is a retired science and technology teacher from Long Island.  His email to me this weekend is a perfect introduction to the issues raised by this weather event.

It was 3 degrees F Saturday morning with a wind chill of -3 degrees.  All night the north wind raged, rattling “sealed” windows and doors but still blowing frigid air through them. I did everything I could: raise the boiler’s temperature, cover the big expanse of glass on the patio doors windows, pull the shades.  I even added an electric heater in the room my tropical parrot resides so he doesn’t get a fatal pneumonia.

The possibility of a power failure crossed my mind with the overhead wires, high winds, many surrounding trees, and almost monthly power interruptions in the past.  It would be an absolutely worst-case scenario if the power went out tonight. Frozen pipes next? I have a backup generator but the thought of going out in the howling cold night, fueling it, hooking it up, starting it, and monitoring the systems wasn’t that appealing.

But LIPA’s tree trimming maintenance and generation/distribution system upkeep allowed the power to stay on through the night and into the next day as I write this. We’re cozy, comfortable and safe.  This kind of cold can kill.

I’m thankful we have a reliable, cost-effective electrical generation and distribution system.  I’m thankful I have a natural gas-fired boiler that works 24/7 keeping me and my family safe and alive.  I am thankful that I don’t rely on intermittent, expensive wind and solar generation as electricity sources that can fail at any time leaving me without power.  I’m grateful I don’t have to rely on “backup” battery power that is grossly inadequate, expensive, highly polluting to manufacture and can cause a non-extinguishable toxic gas fire. I pray it does not change.

What’s Keeping the Heat On – James Hanley

James is a Fellow at the Empire Center.  His post yesterday is a great overview of the problem facing New York as it continues the implementation of the Climate Act.

As another Arctic blast hits the Northeast and temperatures plunge, more energy is needed to keep New Yorkers warm.   Where is that energy coming from? 

A lot of it comes from natural gas, but there’s a big supply problem. Because of the state’s ban on fracking and its refusal to allow new and upgraded natural gas infrastructure, not enough gas can get to power plants to generate the electricity needed to keep the lights and heat on in everyone’s houses during times of extreme demand. 

What gas is available gets bid up to eye-wateringly high prices. It’s hard to speak meaningfully of an average price for natural gas because the market is volatile, but the 2022 high price in Pennsylvania was $12.95 per million British thermal units (mmbtu). According to one energy industry source, during last Christmas’s cold snap, the price in New York hit $100 per mmbtu. 

That translated into an electricity price of nearly 90 cents per kilowatt hour, compared to the average New York price of 19 cents. 

That assumes the power plant can even get the gas it needs to operate. With such severe gas shortages, some natural gas-fired plants had to shut down for lack of fuel. What gets burned to take their place – fuel oil – is not only expensive, but also much dirtier and producing more carbon dioxide than natural gas. 

So, ironically, because New York has limited the supply of the much cleaner burning natural gas in order to prevent pollution and CO2, the power industry has no choice at times but to spew more pollution into disadvantaged communities and add more carbon to the atmosphere. 

The hope is that renewables will one day suffice to supply the electricity we need to heat our homes on a day like this. That hope is irresponsible, because wind and solar aren’t reliable and there is no available “clean” backup power source. 

Below is a graph from the New York Independent System Operator’s (NYISO) real-time dashboard, showing fuel use on February 2 into the early hours of February 3. On what was otherwise a reasonably good day for wind power (the light green line), we can see it declining in the early hours of February 3 as the cold front moved in, while the use of dual fuel generators (the top line), which can burn fuel oil, dramatically increased. Building more wind turbines has limited effect – as the wind drops across the state, all the turbines decrease in output. 

NYISO has repeatedly warned – and the Climate Action Council’s Scoping Plan admits – that wind and solar will not be sufficient. New York will need between 25 and 45 gigawatts of dispatchable power – power that unlike wind and sun, but like natural gas, fuel oil, and hydro, can be turned on and off at will. 

To comply with the Climate Leadership and Community Protection Act (CLCPA), these sources are supposed to be emissions free, leading NYISO to coin the ugly acronym DEFRs – dispatchable emissions-free resources. But they coined that term because they can’t identify any source that meets that standard and is currently available at utility scale and a commercially competitive price. 

This means that for the foreseeable future, fossil fuels will be the only proven source of dispatchable backup to keep the heat and lights on during weather that is killingly cold. Since New York no longer has any coal plants, that can be oil – which is more polluting and has higher carbon content – or natural gas. 

The CLCPA has a clear goal of eliminating all greenhouse gas emitting power production by 2040, which would mean shutting down all natural gas-fired power plants. But it also provides a path for keeping open those plants that are necessary to ensure a reliable electrical supply. That path, however, faces considerable political opposition. 

New York will soon be forced to make a choice: plunging forward with shutting down natural gas-fired power plants, risking rolling blackouts during extreme cold, or moving forward more slowly on its emissions goals, but keeping the heat on. There is no third way.

The Numbers

The past two days were ideally suited to staying inside.  I am a numbers guy so I spent time the last several days watching the weather and the electric system using two different resources.  The go to resource for weather observations in New York is the NYS Mesonet At UAlbany.  I watched the arctic air come into the region and then tracked the event over time.  The NYISO Real-Time Dashboard is a fascinating link into the New York electricity market.  I suspected correctly that this weather would cause a spike in electric load and I could see that play out over the period.

The weather data presented here is all from the NYS Mesonet at the University of Albany.  The following graph lists the last seven days of temperature, dew point temperature, and solar irradiance data at Elbridge, NY which is near my home.  Note that at the time I write this it is February 5 at 8:00 AM and that corresponds to 05/13 or 1300 universal coordinated time or Greenwich mean time, the standard for meteorological observations.  On the night of February 2 the temperature (red) was around 38oF about 7:00 PM EST or 0000 UTC.  Then the front came through and the temperature plunged overnight and during the day before briefly leveling out a few degrees above zero until nightfall when it dropped down to 7 or so below.

The next graph is for the same time period but shows the wind speed, wind gusts, and pressure.  Frontal passage was accompanied with a dip in the station pressure.  The pressure gradient was strong for most of the period so winds were steady slightly above 10 mph with gusts peaking at 38 mph.

The NYISO Real-Time Dashboard has two relevant graphical displays:  the load and real-time fuel mix. The following graph shows the actual and forecast New York total load on February 3-4 (all times are EST).  It is noteworthy that the actual loads on both days were  significantly higher than forecast loads.  The load peaked on 2/3 at 6:50 PM at 23,447 MW and at 6:10 PM on 2/4 at 21,990 MW. 

The NYISO 2022 Load and Capacity Data report winter peak demand projections are all greater than the observed peak loads so this should not have been a demand response problem with the existing fleet.

The real-time fuel mix data shows how the existing fleet met the peak loads during this weather event.  The following table lists the daily statistics for the different fuel types.  The fuel-mix categories are Nuclear; Hydro, including pumped storage; Dual Fuel, units that burn natural gas and other fossil fuels; Natural Gas only; Other Fossil Fuels, units that burn oil only; Other Renewables are facilities that produce power from solar, energy storage resources, methane, refuse or wood; and Wind (at this time exclusively land-based wind).

The graphs show how important the fossil fuel units are to keeping the lights on.  One notable feature of the fuel type data on 2/3 is that the wind generation was not very high even though winds across the state were quite high.  I believe this is because wind turbines don’t provide optimal power if the winds are too light or too strong.  The strong winds on this date apparently affected the wind production so even on a windy day New York’s land based wind provided only 65% of the maximum potential capability.

On 2/4/2023 the wind resource was affected by light winds.  On this date New York’s land based wind provided only 32% of the maximum potential capability.

Conclusion

Stevens explains how important it is for our safety and well-being to have fossil fuels available during extremely cold weather.  Hanley showed that natural gas played an important role keeping the lights on during this arctic blast and described some of the uncertainty associated with the planned net-zero transition.  My contribution was to provide more documentation for the weather, resulting electric load peak, and the contribution of different fuels to meeting that peak.  I am going to follow up on this post with a deeper dive into the resource availability and implications to the Scoping Plan recommendations for generating resource allocations.

Hanley’s conclusion is spot on:

New York will soon be forced to make a choice: plunging forward with shutting down natural gas-fired power plants, risking rolling blackouts during extreme cold, or moving forward more slowly on its emissions goals, but keeping the heat on. There is no third way.