I have been meaning to write this post for a long time because I think there is an important distinction about climate change that could potentially be affected by reducing GHG emissions that is not generally recognized. I have postponed this article because I did not want to try to explain the driving factor for my concern – ocean and atmospheric oscillations. Andy May is a petrophysicist who has a climate blog that recently published 14 articles about atmospheric oscillations that I have used in this post.
I am convinced that implementation of the New York Climate Leadership & Community Protection Act (Climate Act) net-zero mandates will do more harm than good if the future electric system relies only on wind, solar, and energy storage because of reliability and affordability risks. Moreover, I take the heretical position that our understanding of the causes of climate change are not understood well enough to support the idea that reducing GHG emissions represents sound policy. I have been a practicing meteorologist for nearly 50 years, was a Certified Consulting Meteorologist, and have B.S. and M.S. degrees in meteorology. The opinions expressed in this post do not reflect the position of any of my previous employers or any other organization I have been associated with, these comments are mine alone.
Background
Weather and climate are often confused. According to the National Oceanic and Atmospheric Administration’s National Ocean Service “Weather reflects short-term conditions of the atmosphere while climate is the average daily weather for an extended period of time at a certain location.” They go on to say: “Climate is what you expect, weather is what you get.”
The standard climatological average is 30 years. It is important to understand that programs like the Climate Act’s GHG emission reduction targets are intended to reduce global warming over longer time scales than 30 years. Statements suggesting that even if aggressive mitigation reduces greenhouse gases that temperature will still increase for 20-30 years due to inertia in the climate system are based on the premise that CO2 is the control knob for the climate.
I often hear and have noticed myself that “winters aren’t what they used to be” and that leaves are turning color later than the past. The goal of this article is to show that there are climatic oscillations with time periods greater than 30 years that are likely causing these perceived examples of climate change. However, I will show there is no connection between those observations and the value of the Climate Act as a potential reason to reduce GHG emissions in hopes of changing those observations.
Climate Oscillation Analysis
Earlier this year Andy May published 14 articles about climate oscillations in the oceans and atmosphere. I think his analysis is notable because it is data driven. The basis of his analysis is articles describing observed oceanic and atmospheric changes, not modeled simulations. Given the complexity of the interactions between oceans and the atmosphere and the poor understanding of their relationships, assuming that modeled simulations are credible is not reasonable.
His articles provide compelling evidence that each of the 14 oscillations is natural. I believe his work provides sufficient evidence proving that “each oscillation is natural and has been around since the pre-industrial period, or even earlier, and thus is natural and not random variability.” This is important relative to claims that reducing the GHG emissions will affect global temperatures.
May’s work consists of a statistical regression analysis of observed features in the oceans and atmospheres that have occurred over many years. He uses the HadCRUT5 global average temperature data set used by the Intergovernmental Panel on Climate Change (IPCC) to track global warming in his analyses. May offers the following caveat about his work.
Finally, this is a regression analysis to predict HadCRUT5 with climate oscillations to try and detect the climate oscillations that best correlate to “global warming.” This is not a climate model, it is not an attempt to make a climate model, it is only a statistical exercise. Statistics and statistical analysis are not proof of anything, it isn’t even scientific analysis, they are just useful tools to sort through datasets. Just as AI is not intelligent, statistics is not science, both are useful tools.
Climate Oscillations
May’s work consisted of the following posts:
- Musings on the AMO
- The Bray Cycle and AMO
- Climate Oscillations 1: The Regression
- Climate Oscillations 2: The Western Hemisphere Warm Pool (WHWP)
- Climate Oscillations 3: Northern Hemisphere Sea Ice Area
- Climate Oscillations 4: The Length of Day (LOD)
- Climate Oscillations 5: SAM
- Climate Oscillations 6: Atlantic Meridional Model
- Climate Oscillations 7: The Pacific mean SST
- Climate Oscillations 8: The NPI and PDO
- Climate Oscillations 9: Arctic & North Atlantic Oscillations
- Climate Oscillations 10: Aleutian Low – Beaufort Sea Anticyclone (ALBSA)
- Climate Oscillations 11: Oceanic Niño Index (ONI)
- Climate Oscillations 12: The Causes & Significance
In Climate Oscillations 1: The Regression May provides the following table that lists the oceanic and atmospheric oscillations considered in his series of articles. For each of these oscillations he did a statistical regression analysis. The first seven of the oscillations correlated with the GMST measured using HadCRUT5. May points out that “HadCRUT5 is not representative of global climate, it is just an average temperature”. Nonetheless, it is the primary climate change parameter. The rationale for the Climate Act uses climate change and global warming interchangeably.
May Table 1. A list of the climate oscillations discussed and analyzed in this series. The first eight oscillations are listed in order of importance in modeling HadCRUT5, the remaining six did not add to the model. The links in this table will not work, to see the list in a spreadsheet with working links, download it here.

I am not going to review each post in this article but will describe several of the oscillations. If you want to review the articles and are content with a summary using Perplexity AI I did get a review of his work. It notes:
The series begins with a foundational regression analysis that ranks fourteen major climate oscillations by their statistical correlation with HadCRUT5 global surface temperature. May’s analysis reveals that the top three oscillations—the Atlantic Multidecadal Oscillation (AMO), Western Hemisphere Warm Pool (WHWP) area, and Southern Annular Mode (SAM)—together explain 77% of HadCRUT5 variability since 1950. This finding directly contradicts the IPCC’s characterization of these oscillations as unpredictable “internal variability” with minimal influence beyond a few years.
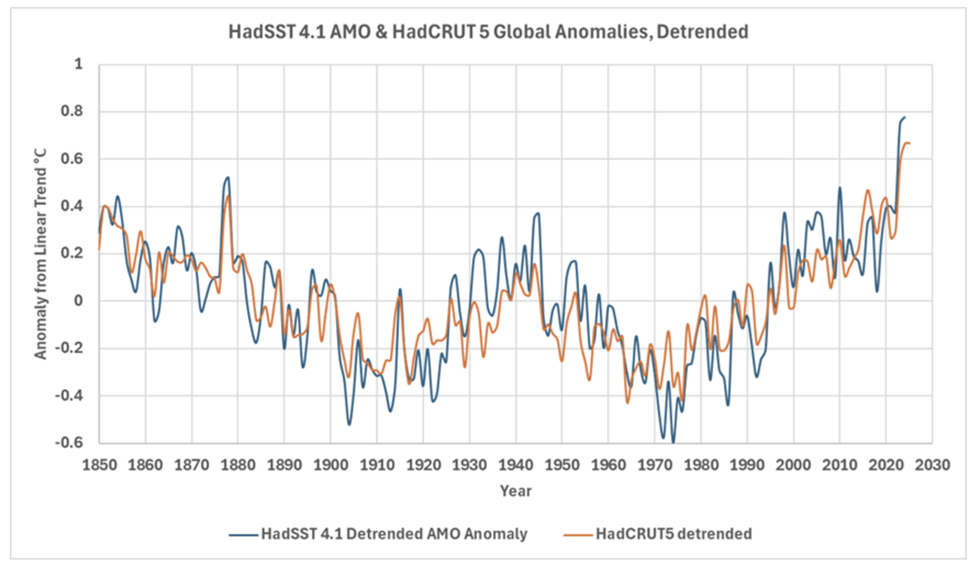
The Atlantic Multidecadal Oscillation (AMO) has the most significant relationship with global mean surface temperature (GMST). There are several definitions based on different measurements. For example, Gray, et al. use detrended raw tree-ring measurements to demonstrate “a strong and regular 60-100 year variability in basin-wide (0-70°N) North Atlantic sea surface temperatures (SSTs) that has been persistent for the past five centuries.”
The general approach used by May is simple. Figure 4 plots GMST using the HadCRUT 5 data and the AMO parameter using the HadSST 4.1 data. It is obvious that the two parameters track well. May used regression analysis to show the strength of the relationship. Note the variation in global temperature since 1850 shown in this graph. The first challenge for proponents of the idea that CO2 is the driver of climate change is that it is acknowledged that it is only since 1950 that CO2 has affected global warming. So, what happened in the past to cause the observed variations? I do not think it is reasonable to claim that all the natural drivers that caused variations before 1950 stopped and global warming became entirely dependent upon CO2 since, but that is the argument used by Climate Act proponents.
May Figure 4. HadSST and HadCRUT detrended temperature anomalies plotted together. Both anomalies are from 1961-1990 originally but are from their respective linear least squares trends. This is updated from figure 2 in (May & Crok, 2024).
May points out:
The reason for the AMO SST 60-70-year pattern is unknown, but according to Gray et al. it extends back to 1567AD, so it is a natural oscillation of some kind. Some have speculated that it is a result of the thermohaline circulation in the North Atlantic or a “combination of natural and anthropogenic forcing during the historical era.” (Mann, Steinman, & Miller, 2020). But while interesting these ideas are speculative. Further if the oscillation has existed since 1567, it seems unlikely that it is caused by human CO2 and aerosol emissions.
The AMO has the best correlation with GMST in all the statistical analyses. Combined with two other oscillations – Western Hemisphere Warm Pool (WHWP) area, and Southern Annular Mode (SAM) these three explain 77% of HadCRUT5 variability since 1950.
The Western Hemisphere Warm Pool Area (WHWP) is an area of abnormally warm ocean that extends from the eastern North Pacific (west of Mexico, Central America, and Columbia) to the Gulf of Mexico, the Caribbean, and well into the Atlantic during the WHWP peak in August and September. Because this area is important to hurricane formation, the strength and extent of the warm pool is important. May points out that the WHWP combined with the Antarctic Oscillation or Southern Annular Mode and the AMO predict GMST well. He concludes that “This suggests that The North Atlantic and the Southern Hemisphere circulation patterns correlate very well with global climate trends, CO2 may fit in there somewhere, but it must share the spotlight with these natural oscillations.”
The Southern Annular Mode/Antarctic Oscillation (AAO) is defined as the difference between the zonal (meaning east-west or circumpolar) sea level air pressure between 40°S and 65°S. This parameter has a powerful influence on global climate and can affect weather in the Northern Hemisphere (Lin, Yu, & Hall, 2025), in particular the Warm Arctic-Cold Eurasian weather pattern that causes a lot of extreme winter weather. The AAO also affects the Indian summer monsoon and other eastern Asia weather phenomena.
Synthesis
The final article in the series, Climate Oscillations 12: The Causes & Significance, addressed the claim by proponents of the Climate Act that “ocean and atmospheric oscillations are random internal variability, except for volcanic eruptions and human emissions, at climatic time scales.” May explains:
This is a claim made by the IPCC when they renamed the Atlantic Multidecadal Oscillation (AMO) to the Atlantic Multidecadal Variability (AMV) and the PDO to PDV, and so on. AR6 (IPCC, 2021) explicitly states that the AMO (or AMV) and PDO (or PDV) are “unpredictable on time scales longer than a few years” (IPCC, 2021, p. 197). Their main reason for stating this and concluding that these oscillations are not influenced by external “forcings,” other than a small influence from humans and volcanic eruptions, is that they cannot model these oscillations, with the possible exceptions of the NAM and SAM (IPCC, 2021, pp. 113-115). This is, of course, a circular argument since the IPCC models have never been validated by predicting future climate accurately, and they also make some fundamental assumptions that simply aren’t true.
This is a good point to remind readers that little fluctuations in incoming radiation have big impacts on the climate. The Milankovitch theory is the most widely accepted cause of glaciation. It states that variations in earth’s orbit and tilt cause changes in the amount of sunlight that cause climate fluctuations strong enough to trigger continental glaciers.
May’s analysis finds relationships between similarly small external variations that correlate with global surface temperatures. Note however that proponents of CO2 as the control knob disregard all climate drivers but the greenhouse effect. May explains:
Finally, oscillations are inconsistent with anthropogenic greenhouse gas emissions as a dominant forcing of climate change. Greenhouse gas emissions do not oscillate; recently they have only increased with time. So, we will examine the relationship between solar and orbital cycles and the climate oscillations. As Scafetta and Bianchini (2022) have noted, there are some very interesting correlations between solar activity and planetary orbits, and climate changes on Earth.
May’s final article describes multiple observed oscillations including a period of about ~64 years, ±5 years (Wyatt, et al., 2012), Nathan Mantua and colleagues (Mantua, et al., 1997) identified 20th century “climate shifts” which results in a major multidecadal climate oscillation of 22 to 30 years and there are shorter 2-, 5-, 5-, and 9-year observed oscillations. Note that there also are other cycles that are longer than these.
The ~64 year oscillation is of particular interest. Marcia Wyatt’s “stadium wave” hypothesis shows that a suite of global and regional climate indicators vary over roughly the same 64-year period. Wyatt explains:
“Stadium wave” is an allusive term for a hypothesis of multidecadal climate variability. Sequential propagation of an “audience wave” from one section of sports fans to another in a sports arena – i.e. a “stadium wave” – is analogous to the premise of the climate stadium-wave hypothesis. It, too, involves sequential propagation of a signal. In the case of the climate stadium wave, propagation proceeds sequentially through ocean, ice, and atmospheric systems. Key to signal propagation is network, or collective behavior – a feature ubiquitous throughout natural and man-made systems, a product of time and self-organization.
I think of climate as a product primarily of the climate stadium wave cycle plus contributions from other oscillations. May explains:
If we define “global climate change” as the observed changes in HadCRUT5 or BEST global mean surface temperature (GMST) as the IPCC does, then the oscillations that correlate best are the AMO and the global mean sea surface temperature (SST) as shown in figure 2. None of the other oscillations correlate well with GMST.
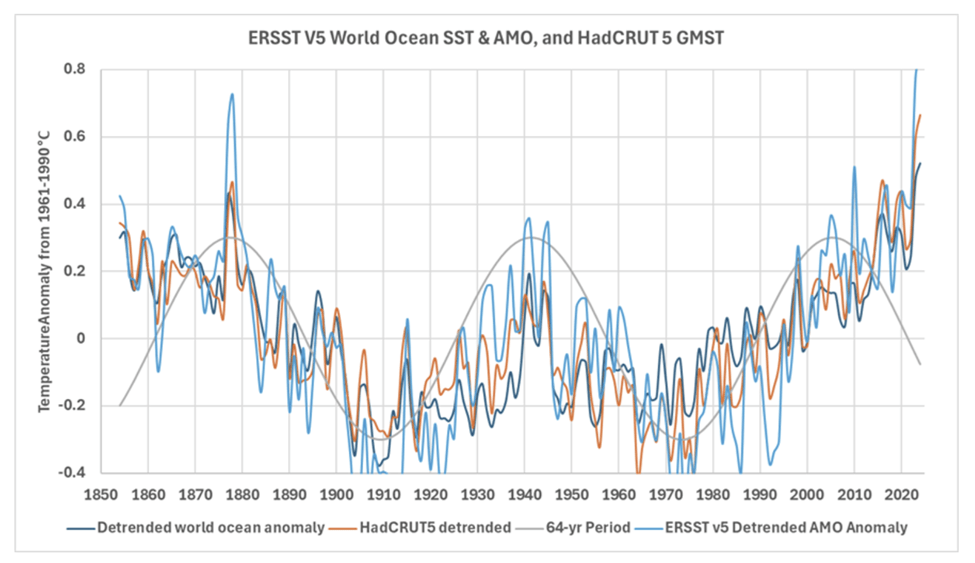
In figure 2, the gray curve is a 64-year cosine function. It fits the 20th century data but departs significantly around 2005 and before 1878. The early departure could be due to poor data, the 19th century temperature data is very bad, see figure 11 in (Kennedy, et al., 2011b & 2011). Data quality problems still exist today, but are much less of a factor and the departure after 2005 is likely real and could be caused by any combination of the of the two following factors:
- Human-emitted greenhouse gases.
- The full AMO/world SST/GMST period is longer and/or more complex than we can see with only 170 years of data.
It is probably a combination of the two. As discussed by Scafetta and Stefani, climate, orbital, and solar cycles are known to exist that are longer than 170 years. The fact that I had to detrend all the records shown in figure 2 testifies to that. It is also noteworthy that the ENSO ONI trend since 2005 is trending down; as shown in the last post. So is the current PDO trend. All the notable oscillations are not synchronized, teleconnections or not, climate change is not simple. The trends in figure 2 result from complex combinations of gravitational forces and teleconnections (Scafetta, 2010), (Ghil, et al., 2002), and (Stefani, et al., 2021).
Discussion
May gives a concise summary of the potential human influence that has never been considered by the State of New York:
Whether global warming is a problem or not is in dispute, but it is a fact that the world is warming, and some are concerned about it. What is the cause of the warming? Is it natural warming after the cold winters of the Little Ice Age? Is it caused by human emissions of CO2? Most of the natural ocean and atmospheric circulation oscillations examined in this post are not modeled properly (some say not modeled at all) in current global climate models (Eade, et al., 2022). The IPCC AR6 report admits that the AMO (they call it the “AMV”) signal in the CMIP6 climate models is very weak, specifically on page 506:
“However, there is low confidence in the estimated magnitude of the human influence. The limited level of confidence is primarily explained by difficulties in accurately evaluating model performance in simulating AMV.” (IPCC, 2021, p. 504)
In other words, the models that predict gloom and doom that are used as the rationale that we must reduce New York GHG emissions don’t accurately predict the oscillation that correlates best with global temperatures. If you cannot model this relationship, then the likelihood that future temperature projections are accurate is zero.
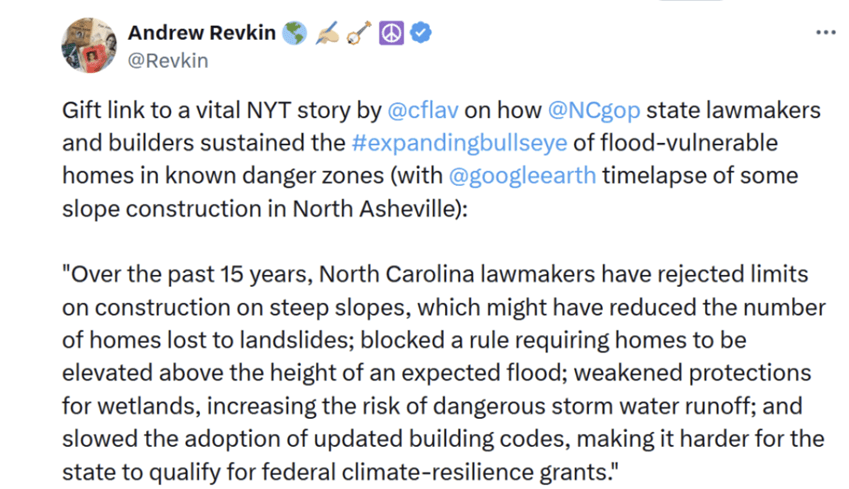
In addition, NYSERDA presentations at meetings consistently attribute the latest extreme weather events to climate change. Maybe someday I will explain why I think that is completely divorced from reality and only serves to support the narrative that there is an existential threat. In the meantime Roger Pielke, Jr. recently eviscerated this line of reasoning and those that continually use it. He points out that this approach is “counter to the terminology, frameworks, and assessments of the IPCC and the broad base of research on which the work of the IPCC is based upon.” I strongly recommend his article as definitive proof that the Hochul Administration picks and chooses the “science” to fit their narrative.
Conclusion
The intent of this article was to explain why anecdotal “evidence” of climate change is no more than recognition that there are weather pattern cycles that currently show warming. It does not mean that there is conclusive evidence that continued GHG emissions will inevitably increase global temperatures. There is overwhelming evidence that the current warming cycle will eventually reverse. This does not mean that GHG emissions are not a factor but does mean they are a tweak not the primary driver. This combined with the fact that New York GHG emissions are so small relative to global emissions that we cannot meaningfully affect global emissions means that GHG emission reductions for the sake of the climate is a useless endeavor.