This is part of my continuing coverage of the New York State Energy Plan. On July 23, 2025, the Draft Energy Plan was released for comment. There is every indication that the Hochul Administration is just going through the motions of a stakeholder process like they did with the Scoping Plan. This is too important to not do correctly.
I am convinced that implementation of the New York Climate Leadership & Community Protection Act (Climate Act or CLCPA) net-zero mandates will do more harm than good if the future electric system relies only on wind, solar, and energy storage because of reliability and affordability risks. I have followed the Climate Act since it was first proposed, submitted comments on the Climate Act implementation plan, and have written over 550 articles about New York’s net-zero transition. The opinions expressed in this article do not reflect the position of any of my previous employers or any other organization I have been associated with, these comments are mine alone.
Energy Plan Overview
According to the New York State Energy Plan website (Accessed 3/16/25):
The State Energy Plan is a comprehensive roadmap to build a clean, resilient, and affordable energy system for all New Yorkers. The Plan provides broad program and policy development direction to guide energy-related decision-making in the public and private sectors within New York State.
I have provided more background information and a list of previous articles on my Energy Plan page.
Responsibility for implementing the Energy Plan as well as all the Climate Act programs lies with the New York State Energy Research & Development Authority (NYSERDA). Over my career I have seen an ever-increasing level of political influence on NYSERDA’s research priorities and, more recently, the research results. This post describes my concerns relative to the energy plan stakeholder process.
Stakeholder Promise and Reality
The July 23, 2025 meeting presentations mentioned public participation multiple times. The following slide (Figure 1) described the process for Draft Energy Plan involvement. The Draft Energy Plan website has links for submitting written comments and participation in public hearings. However, indications are that this is just going through the motions. The public hearings are only two hours long and speakers are limited to two minutes. That is not nearly enough time to provide anything meaningful.
Figure 1: Public Review Process Description in July 23, 2025 Meeting Presentation.
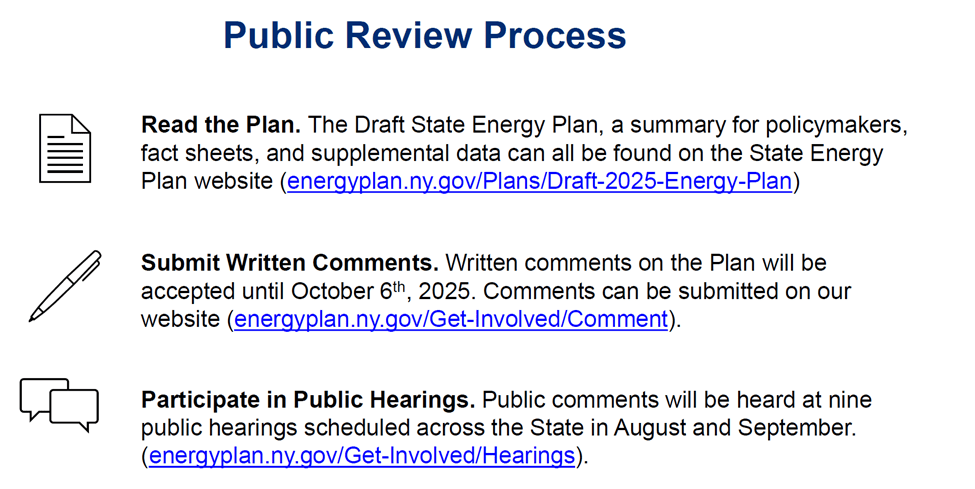
I signed up to make a statement soon after the hearing notice was announced. This article documents the comments I plant to provide about the public comment process.
Concern
My first post describing the Draft Energy Plan mentioned two critical requirements for a satisfactory Energy Plan. Defining metrics for affordability, reliability, and acceptable environmental impacts should be a primary component of the Energy Plan. A transparent and comprehensive stakeholder process is also needed for credibility.
My worries that NYSERDA treatment of public input in the Energy Plan stakeholder process will mimic the Scoping Plan process have been a consistent theme in all my articles on the Energy Plan process. I think that NYSERDA is following the same script where the numbers were tortured to provide the desired analysis then tied up into a pretty package. Now they will go through the motions of accepting public input but will not respond to comments submitted. The problem is that many of the same inconsistencies and identified problems that did not get addressed in the draft Scoping Plan are present in the draft Energy Plan. This is unacceptable.
Example 1
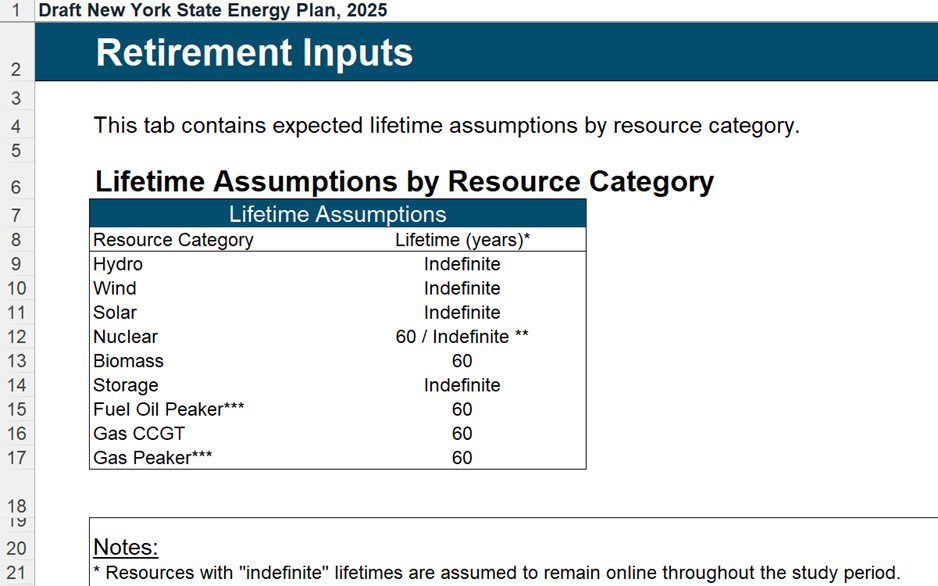
The “Retirement Input” tab in the Pathways Analysis Technical Supplement: Key Drivers and Outputs spreadsheet is shown in Figure 2. It states that the expected lifetimes for wind, solar, and storage are indefinite. Most of the existing wind and solar and all of the existing storage will have to be replaced by 2040. This is an absurd assumption.
Figure 2: Retirement Inputs Table
On June 16, 2022 I submitted a Comment on Retirement Input Assumptions used in the Draft Scoping Plan.
In what appears to be an egregious attempt to reduce the published costs of wind, solar, and battery storage the Integration Analysis assumes that the expected lifetimes of those technologies is indefinite. As a result, units are assumed to remain online throughout the study period and no costs for replacements between now and 2050 are included. However. that is a poor assumption because it is totally unreasonable to expect that, for example, the existing land-based resources will still be in operation in 2050.
I estimated the potential impact of this assumption. Using an indefinite retirement date for these resources underestimates the total builds needed for 2050. For land-based wind between 3,814 MW and 4,600 MW are not included and for offshore wind between 6,200 and 6,600 MW are not included. The amount of solar not included ranges between 22,639 MW and 19,983 MW. Finally, for battery storage between 10,713 MW and 12,207 MW of additional resources will be need to be developed to meet the 2050 projected value.
The Draft Energy Plan only covers the next 15 years to 2040 so these projections are not completely compatible. Nonetheless, this is still a uncontestably incorrect assumption. This error will cause an underestimate of the costs to comply with the Climate Act 2040 mandates. It is a matter of credibility if it is not acknowledged.
I could go on to provide other examples of issues that I raised in the Draft Scoping Plan that are present in the Draft Energy Plan. There is no point in bothering to document these issues if there is no commitment to respond to all comments submitted.
Example 2
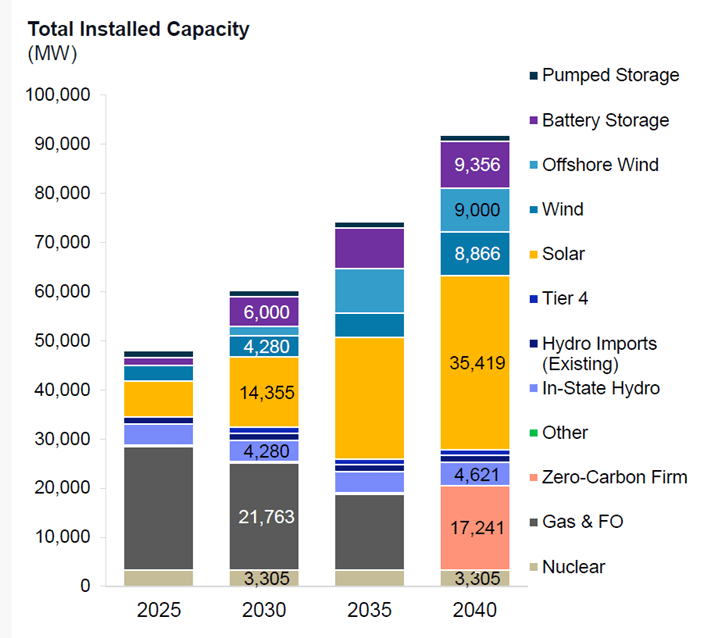
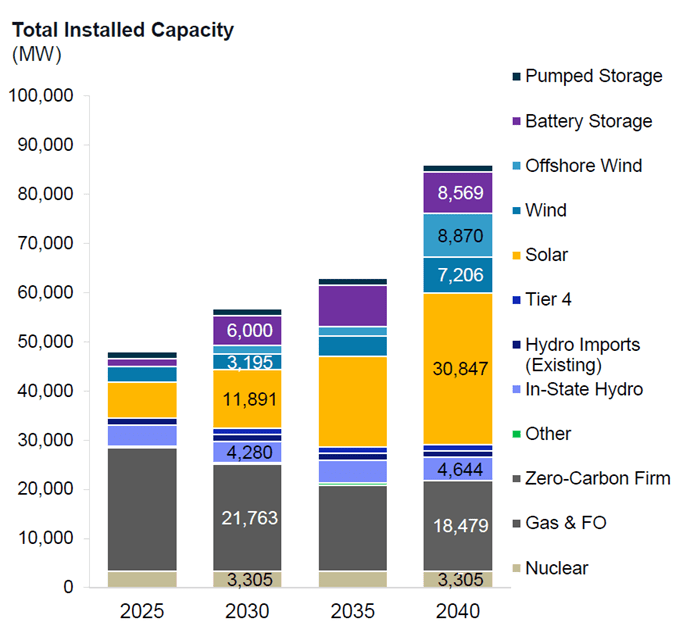
I have always been concerned about differences between the NYSERDA analyses and the work of the New York Independent System Operator (NYISO). The NYISO mission is “Ensure power system reliability and competitive markets for NY in a clean energy future”. As part of that responsibility NYISO performed in-depth analyses of power system data and made projections showing estimated changes as a result of the Climate Act. There are significant differences (Table 1) between the NYISO projections of future generating resource capacity and the NYSERA sponsored analyses that have never been reconciled in an open and transparent public forum.
Table 1: Comparison of 2040 Fuel Mix Capacity (MW) Projections by NYISO and NYSERDA

I am particularly concerned about the capacity differences for the Zero-Carbon Firm or Dispatchable Emissions-Free Resource. NYISO projects a significantly higher necessary capacity. There are fundamental viability issues associated with DEFR and it appears that the two modeling approaches are treating the resource differently. It is critically important that the differences get resolved. Failure to do so goes beyond a credibility issue associated with the process. .If this is not resolved there could be reliability consequences and the potential for catastrophic blackouts.
There is another aspect of the differences between NYSERDA and NYISO The NYISO analyses have never revealed their cost estimates for the transition. That information would either provide reassurance that NYSERDA electric system transition estimates are supportable or suggest they need to be improved.
Recommendation
I believe that the stakeholder process for the Climate Act is broken because NYSERDA and other state agencies treat it as an obligation and not an opportunity. NYSERDA claims that there was “robust public input” during the draft Scoping Plan process that “included 11 public hearings across the State and more than 35,000 written comments” that supposedly were read, summarized, and presented to the Climate Action Council. The problem is that Agency staff screened the comments for the Climate Action Council and there is no publicly available documentation of their work. They only presented generalities at meetings and did not summarize specific comments. I am convinced that any comments that questioned the narrative espoused by Climate Act proponents were ignored and there is no evidence that I am wrong.
I recently found an example of how a stakeholder process should work. The Santa Clara County Rapid Transit Development Project includes a master plan for transportation for Silicon Valley. An interview with the founding manager notes: “Part of the plan is a four-year public stakeholder review process. In the reviews, if the public came up with good ideas, the ideas went into the plan. If an idea wasn’t good, we had the responsibility of explaining why” from California’s High-Speed Rail Visionary Bill Buchanan, Trains, Volume 85, No. 1, January 2025, pages 30-37. The process also included public outreach meetings that included the opportunity to ask questions.
A robust public input process includes public outreach. The Draft Energy Plan was announced after a series of Planning Board meetings earlier this year. There hasn’t been any opportunity for stakeholders to ask questions about the assumptions and methodologies used. If the State was serious about considering public input for an energy plan that affects every New Yorker, then they would hold a series of meetings to cover specific technical topics. A stakeholder process that does not allow for interaction between stakeholders and NYSERDA staff is nearly useless.
In my opinion, NYSERDA should provide a public response to all the substantive comments made regarding the Draft Energy Plan. A publicly available summary describing specific comments, responses to the issues raised by comments and the recommendation for resolution in the final Energy Plan should be provided to the Energy Planning Board, the Public Service Commission and the public. If the State is to have any credibility regarding their Energy plan stakeholder process, then they must provide documentation showing that all the comments were considered and addressed.
Conclusion
My biggest Energy Plan concern is whether the Hochul Administration will use the Energy Plan process as an opportunity to consider the implications of the observed transition so far and if the advice of stakeholders in its stakeholder process will be treated as an opportunity to improve the transition. Earl indications suggest that they are only going through the motions with no attempt to meaningfully engage with any comments inconsistent with the narrative