In early January I described my comments on the 2026 Operating Plan Amendment (“Amendment”) for the Regional Greenhouse Gas Initiative (RGGI). This post summarizes the responses to comments and the CO2 emissions through 2025 because last year’s data just became available.
Dealing with the RGGI regulatory and political landscapes is challenging enough that affected entities seldom see value in speaking out about fundamental issues associated with the program. I have been involved in the RGGI program process since its inception and have no such restrictions when writing about the details of the RGGI program. I have worked on every cap-and-trade program affecting electric generating facilities in New York including RGGI, the Acid Rain Program, and several Nitrogen Oxide programs, since the inception of those programs. I also participated in RGGI Auction 41 successfully winning allowances and holding them for several years. The opinions expressed in this post do not reflect the position of any of my previous employers or any other organization I have been associated with.
Background
RGGI is a market-based program to reduce greenhouse gas emissions (GHG) (Factsheet). It has been a cooperative effort among the states of Connecticut, Delaware, Maine, Maryland, Massachusetts, New Hampshire, New York, Rhode Island, and Vermont to cap and reduce CO2 emissions from the power sector since 2008. New Jersey was in at the beginning, dropped out for years, and re-joined in 2020. Virginia joined in 2021, withdrew and is going to join again, and Pennsylvania recently decided not to join. According to a RGGI website:
The RGGI states issue CO2 allowances that are distributed almost entirely through regional auctions, resulting in proceeds for reinvestment in strategic energy and consumer programs.
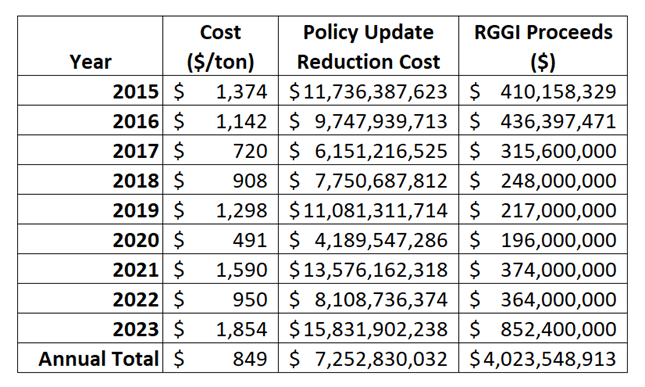
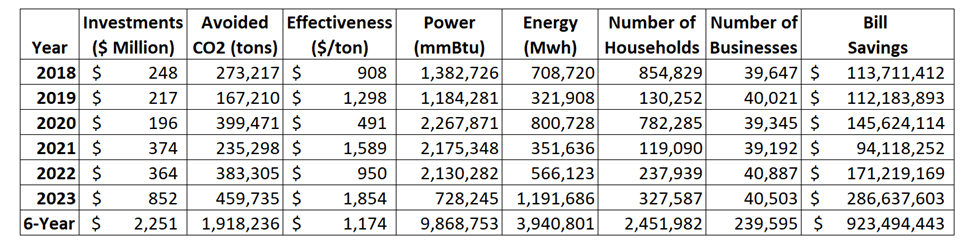
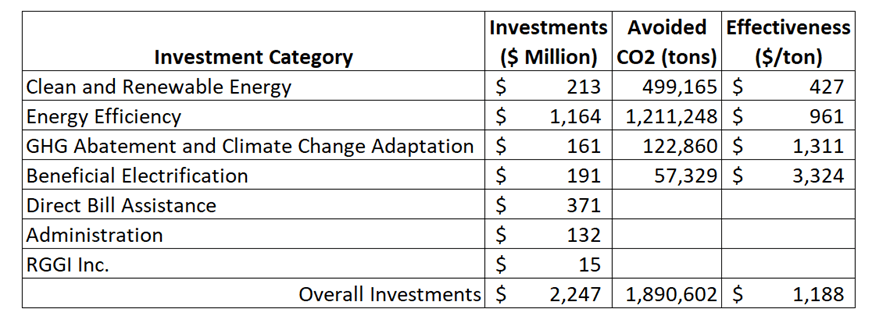
Proceeds were invested in programs including energy efficiency, clean and renewable energy, beneficial electrification, greenhouse gas abatement and climate change adaptation, and direct bill assistance. Energy efficiency continued to receive the largest share of investments.
NYSERDA Final 2026 Operating Plan
The New York State Energy Research & Development Authority (NYSERDA) designed and implemented a process to develop and annually update an Operating Plan which summarizes and describes the initiatives to be supported by RGGI auction proceeds. I am not going to rehash the contents of the Draft 2026 RGGI Operating Plan Amendment. Check out my article and comments for details.
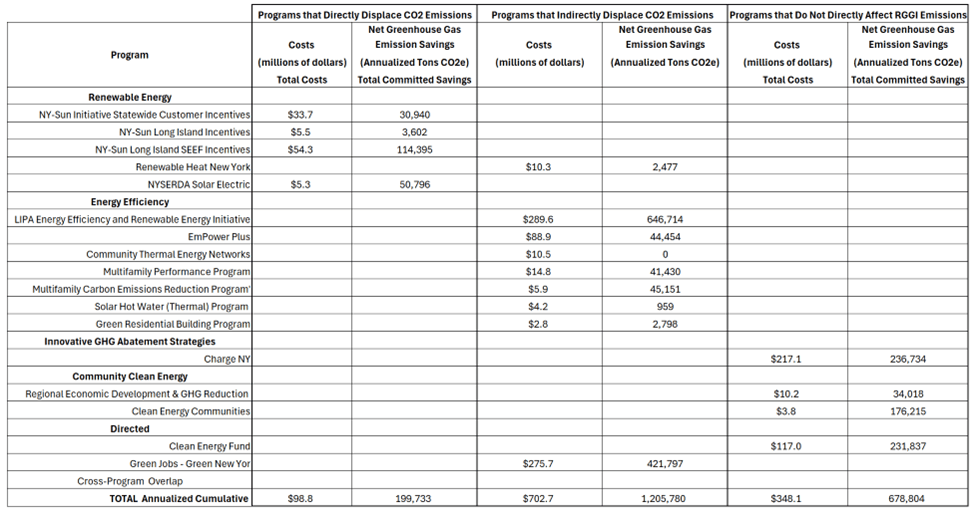
My primary concern with the draft amendment was that RGGI is an electric sector emissions reduction program, but NYSERDA does not prioritize emission reduction investments. My comments showed that the fuel switching reductions that have been responsible for most of the observed reductions are no longer available and it is not clear where future reductions will come from. Therefore, programs that materially decrease electric sector emissions directly or indirectly through energy use reductions should be a priority because affected sources have limited compliance options. There are programs in the amendment that do not meet these criteria. I argued that it is only appropriate to fund the non-priority programs if sufficient funding has been allocated to make the emission reductions necessary to meet RGGI compliance mandates.
I did not describe all the comments I made in summary article. I also complained about the stakeholder process and the lack of a summary of comments submitted by stakeholders. I also specifically addressed the need to determine how many dispatchable emissions-free resources (DEFR) will be needed in the future..
Summary of Public Feedback
I was very happy to see that NYSERDA included a Summary of Public Comments for the first time when they released the final document. I applaud NYSERDA for providing this information, but they really did not say much. Moreover, it was not comprehensive, so stakeholders like me are left to wonder why their comments were not addressed. For example, as I noted I commented on the need for DEFR research and the Environmental Energy Alliance of New York, an ad hoc organization representing New York generating and transmission operators, also recommended funding to explicitly address DEFR issues. Neither recommendation was acknowledged.
The Summary of Public Comments described the most numerous comments. I find it frustrating that New York State public comment responses emphasize quantity and not quality of stakeholder responses. It also seems that responses are highlighted if they are consistent with the political narrative. In the following quote the reference to the “Clean Energy Communities Program” refers to a disadvantaged community effort that is a political priority:
The majority of commenters communicated a strong support for the investments in EmPower+ and the Offshore Wind Predevelopment Support Program under Large-Scale Generation. In addition, targeted commenters expressed support for NYS’s plans to undertake activities to further advanced nuclear under the Large-Scale Generation funding allocation. Finally, some targeted commenters expressed satisfaction with the continued RGGI investment in the Clean Energy Communities Program, with some wanting it increased.
There were specific responses to the following programs.
- NY-Sun and energy storage: Targeted commenters expressed disappointment with the level of investment in NY-Sun (solar) and energy storage.
- Large generation technologies: Targeted commenters requested that the Operating Plan Amendment funding allocations include a greater emphasis on research focused on new, large generation technologies.
- Advanced fuels: Targeted commenters expressed support for the RGGI investments in advanced fuels, with special interest in additional funding being dedicated to renewable natural gas (RNG)and sustainable aviation fuel (SAF).
- Mechanical insulation maintenance and repair: One commenter requested NYSERDA recognize mechanical insulation maintenance and repair as an approved efficiency category for RGGI funds.
- Refrigerant study: Two commenters requested NYSERDA conduct a study of the energy conservation benefits of adopting natural refrigerants in the large-scale refrigeration systems.
It seems odd to me that there is an explicit response to mechanical insulation maintenance and repair because that is a relatively minor program in the overall net-zero transition. It is almost as if the internal request to NYSERDA staff to provide responses to stakeholder comments was taken seriously by only a few of the staff responsible for RGGI-funded programs.
The Response ended with the following:
Having reviewed all comments received, NYSERDA finds that the investment allocations put forward in the Operating Plan were well supported and have taken into account many of the themes presented in public comments. To the extent that certain commenters sought changes outside of NYSERDA’s regulatory obligations and limitations, such changes were not considered. NYSERDA has incorporated the following actions in response to public feedback:
- If NYSERDA realizes additional proceeds above the base estimates identified in the Operating Plan Amendment, NYSERDA may consider channeling the percentage of additional proceeds available to NYSERDA to NY-Sun and energy storage.
- NYSERDA will continue exploring opportunities to improve the RGGI stakeholder engagement process, including potential enhancements to NYSERDA’s public website to better connect the Operating Plan Amendment, stakeholder meeting materials, and public comments received.
Funding Re-Allocations
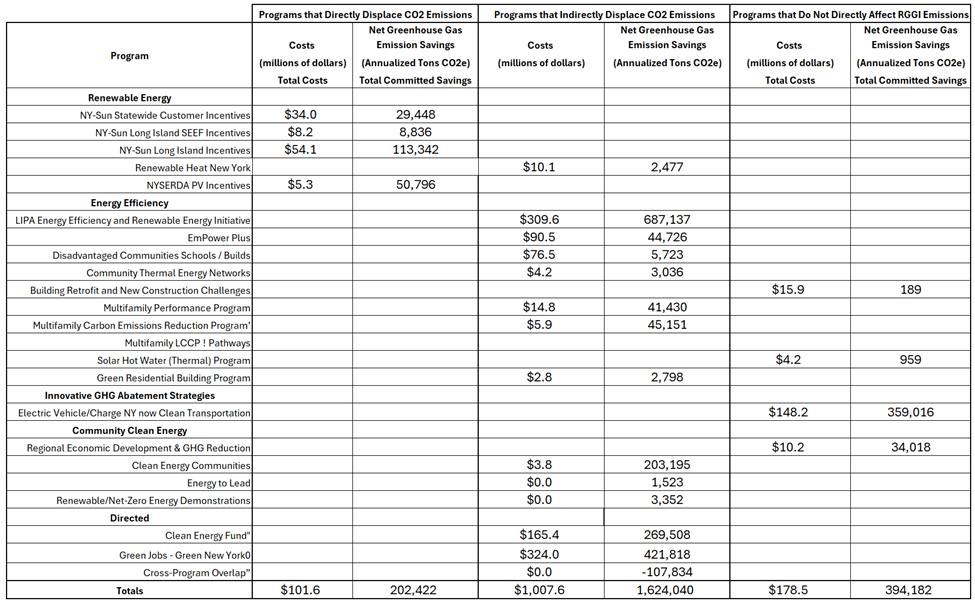
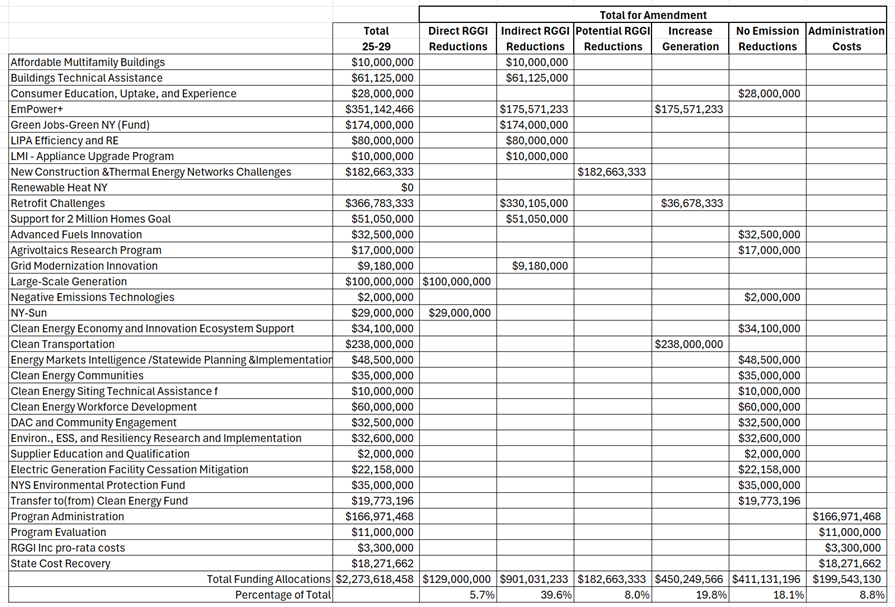
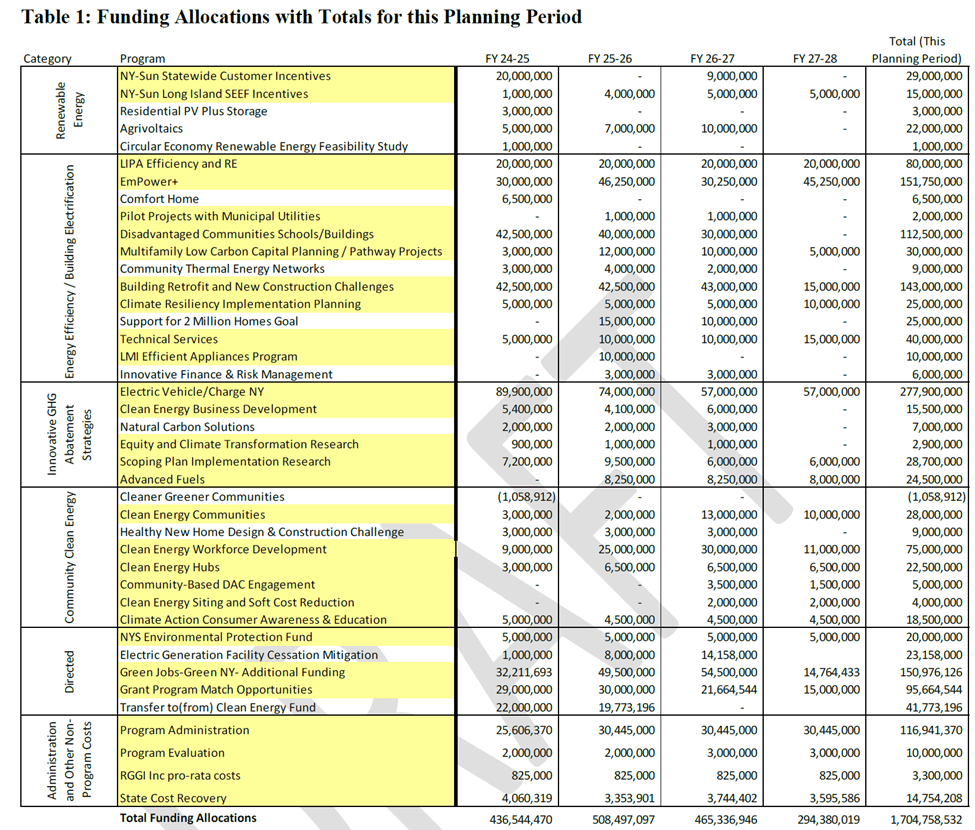
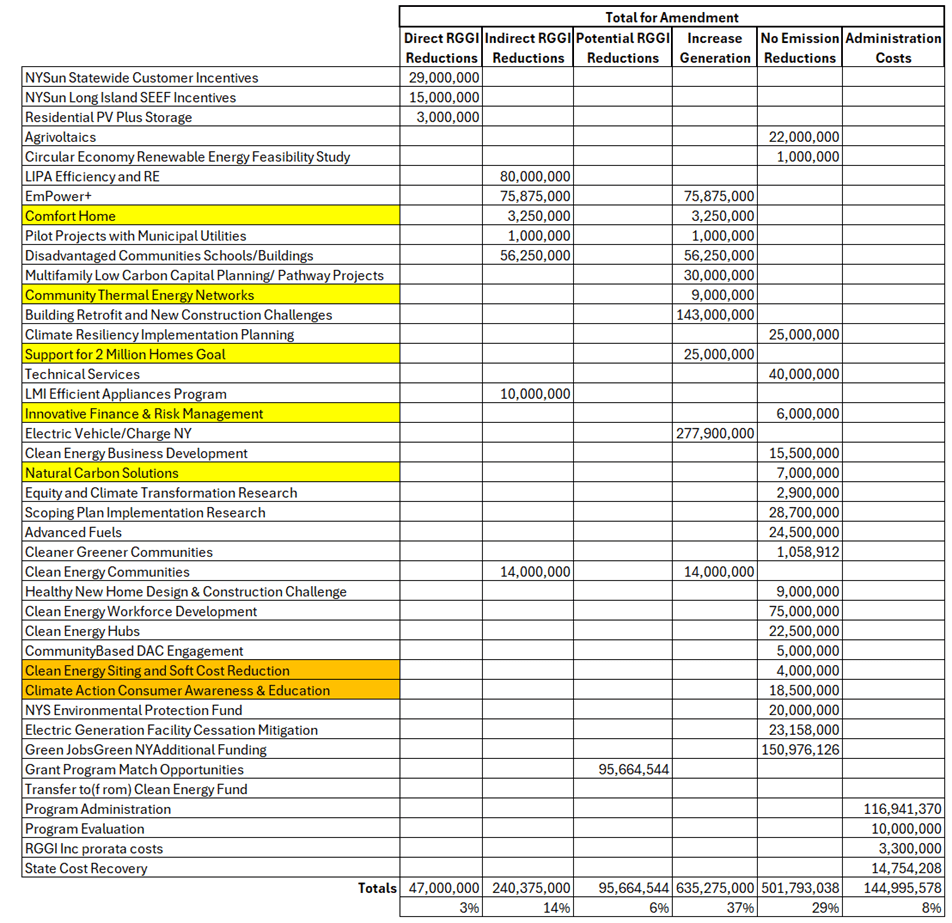
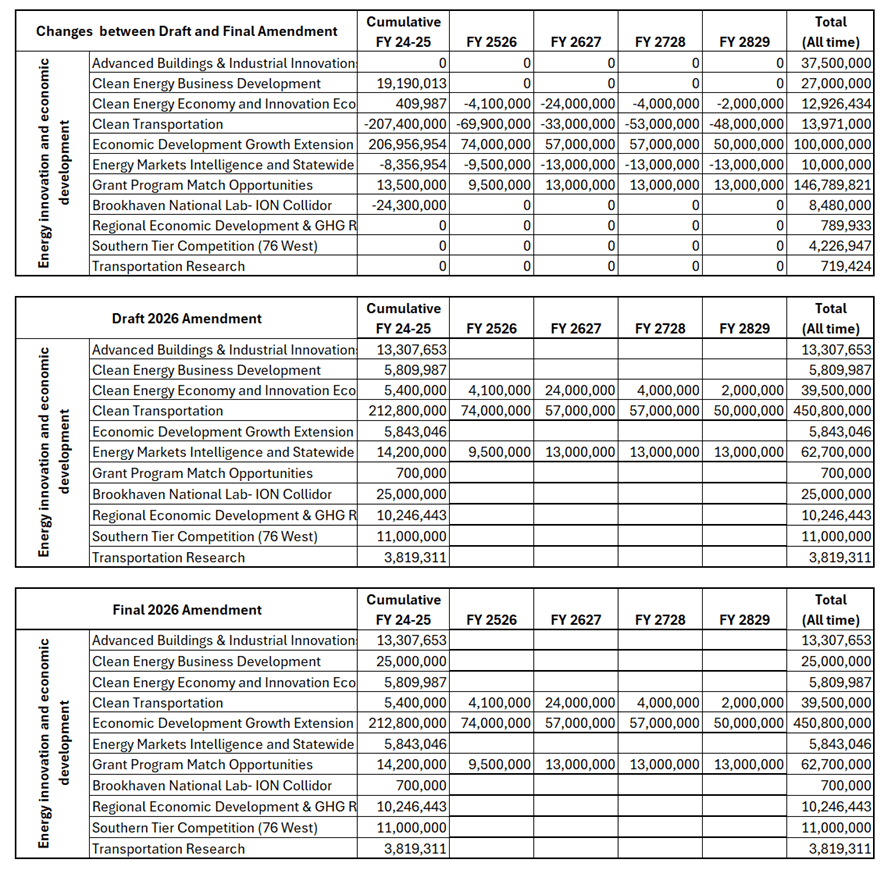
There was no mention of any changes to the funding allocations. I compared the Cumulative Revenues and Program Funding Allocations table in the draft and final amendments in Table 1. Only changes in the Energy Innovation and Economic Development category were made as shown in the table. It is not clear why there were substantive differences between the cumulative to date FY24-25 expenditures. Future funding for the Clean Energy Economy and Innovation Ecosystem Support, Clean Transportation, and Energy Markets Intelligence and Statewide Planning and Implementation programs decreased The decrease in those funds were re-allocated to the Economic Development Growth Extension and Grant Program Match Opportunities programs. No explanation of why those funds were shifted was included.
Table 1: Cumulative Revenues and Program Funding Allocations Comparison of Draft Amendment and Final Amendment.
Carbon Dioxide Emission Reduction Status
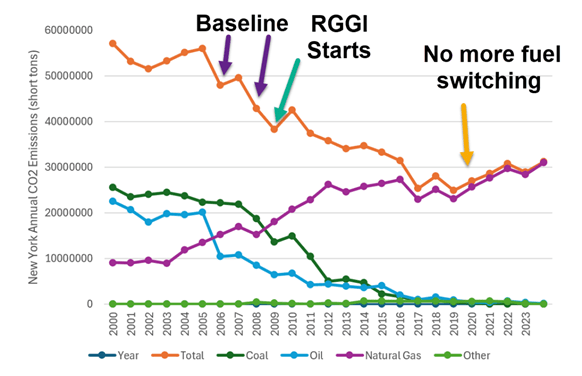
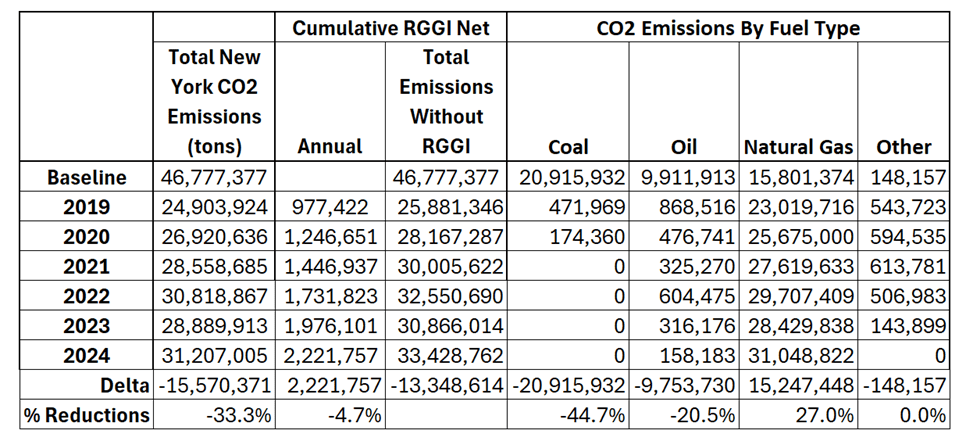
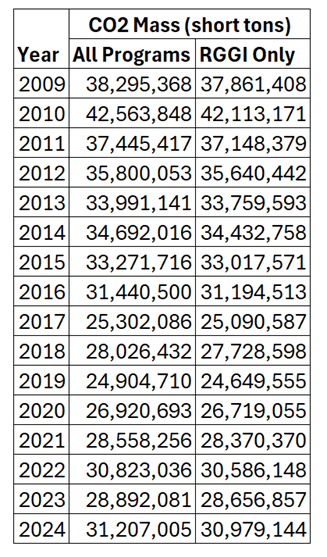
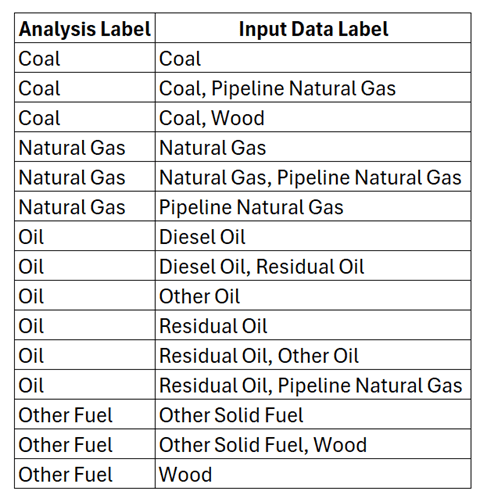
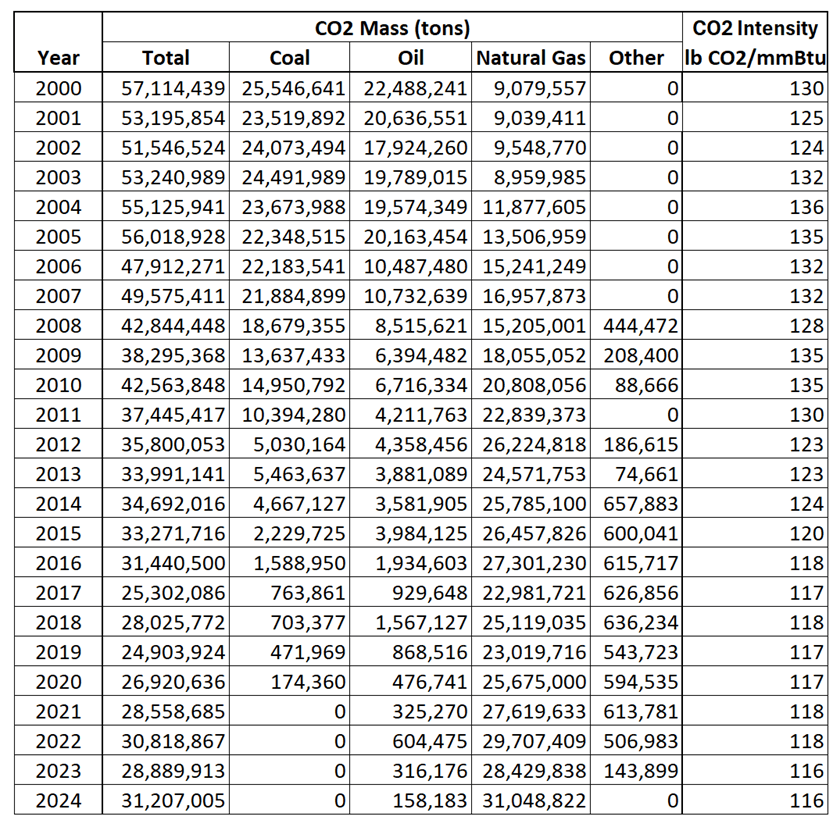
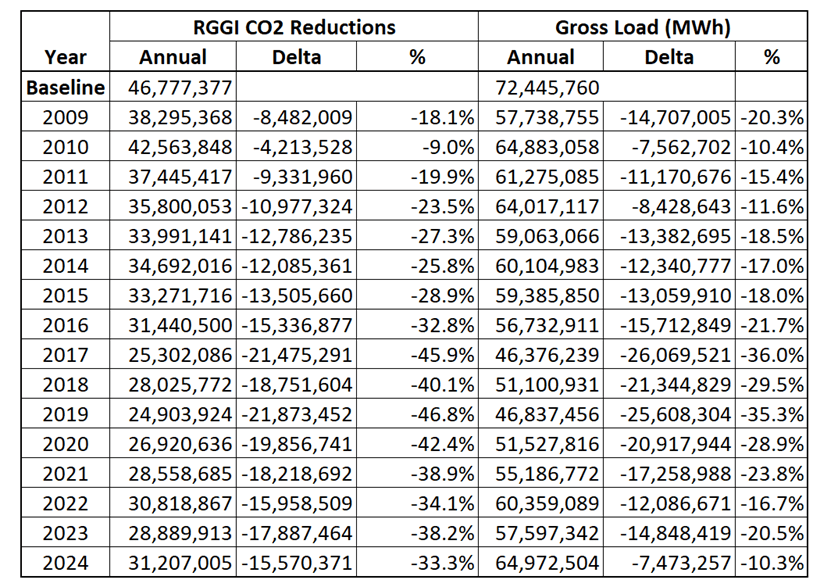
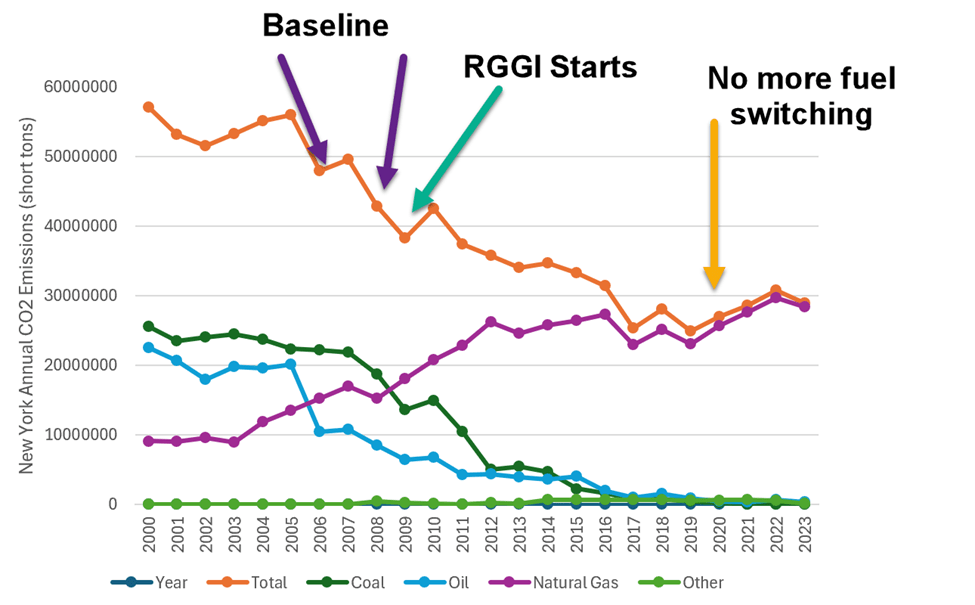
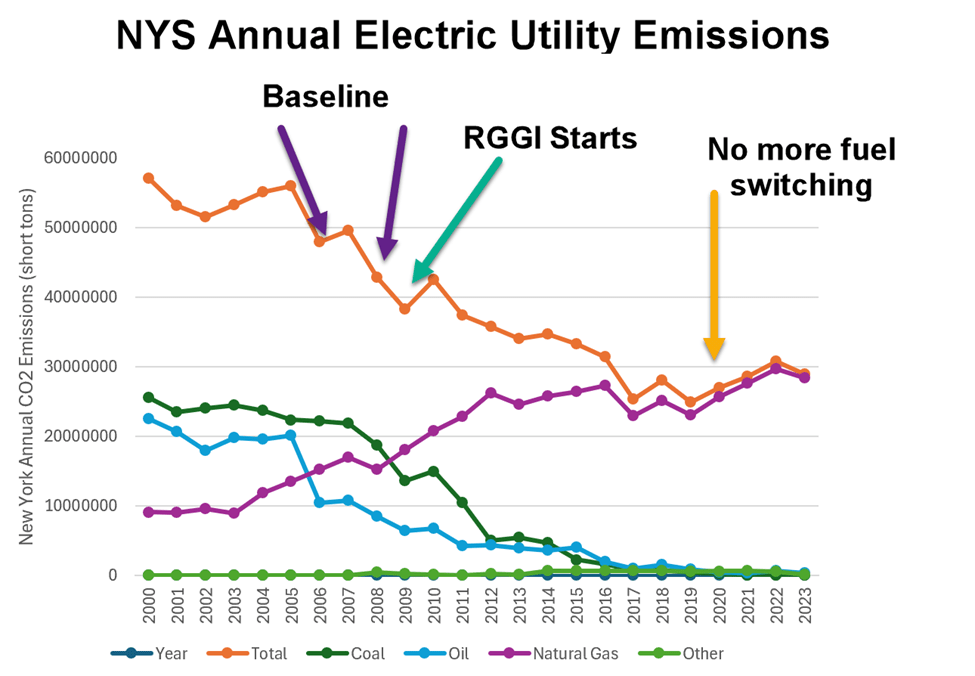
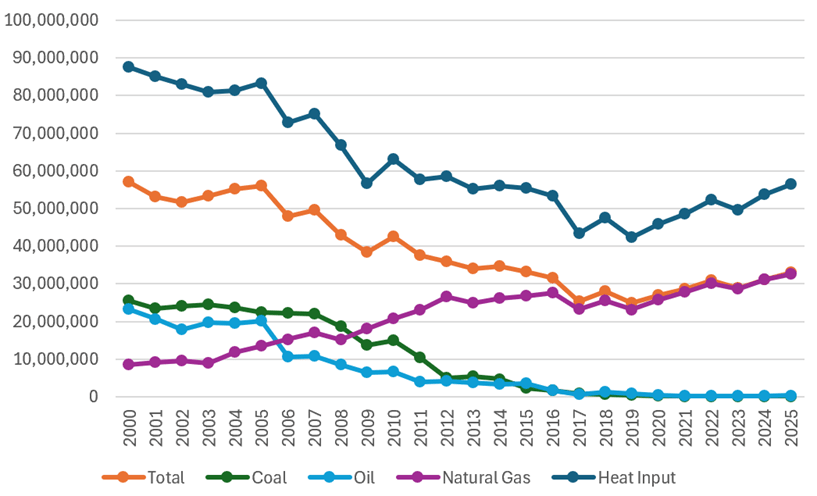
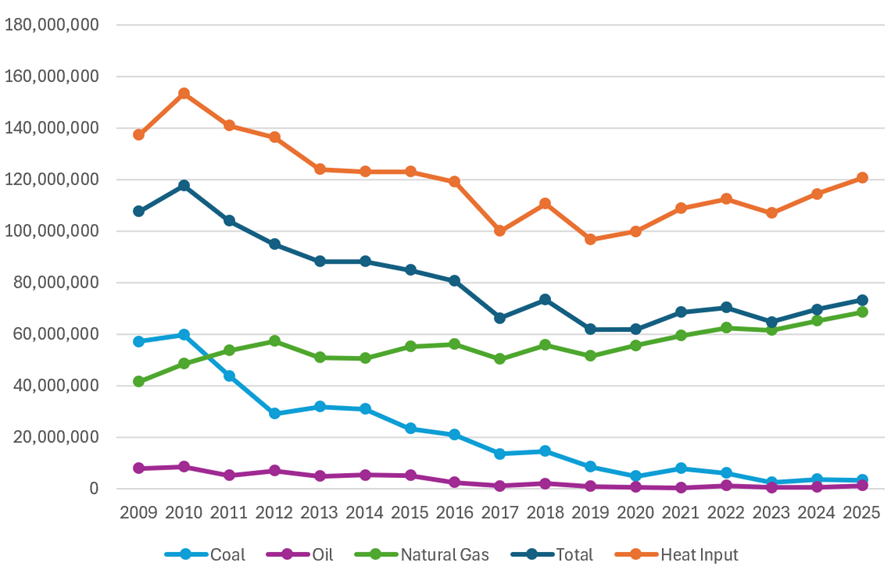
Since I submitted my comments the 2025 annual emissions data have become available. Electric generating units in the RGGI program report CO2 emissions on a quarterly basis. This status summary uses the data from the EPA Clean Air Markets Program Data (CAMPD) database. Table 2 lists the annual CO2 emissions data by coal, oil, and natural gas primary fuel types and the heat input. The CAMPD “heat input” parameter is the hourly thermal energy input expressed in million British thermal units (mmBtu) and represents the rate at which fuel energy is supplied to the combustion unit over an operating hour. For comparison purposes the heat input data are divided by ten. Figure 1 plots these data. There is no change in the general trends with the addition of 2025 annual data. There was a significant decrease in total CO2 emissions caused by fuel switching from coal and oil to natural gas until 2019. At that time, opportunities for additional fuel switching ended and the Indian Point nuclear station started shutting down. Since then, emissions have gone up. I included the heat input to make the point that CO2 emissions and the amount of fuel used are closely linked. Future reductions will necessarily require reductions in fuel use. Based on these data I believe that the failure of NYSERDA to prioritize programs that directly or indirectly reduce emissions eventually will cause compliance problems.
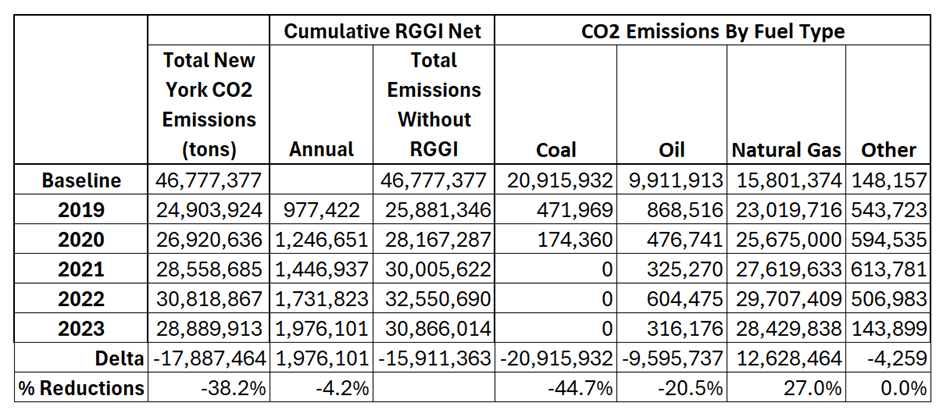
Table 2: NY Electric Generating Unit CO2 Emissions and Heat Input
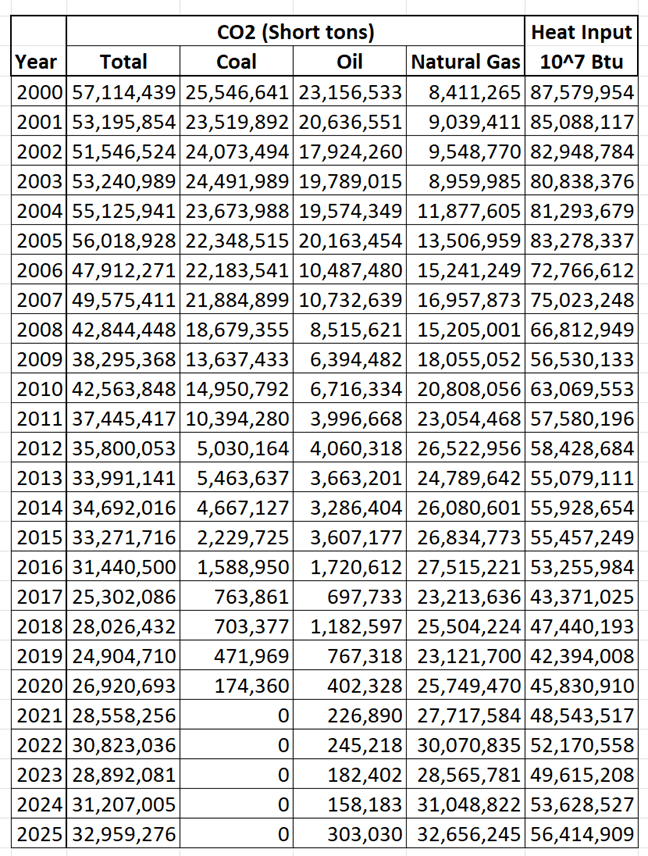
Figure 1: NY Electric Generating Unit CO2 Emissions and Heat Input
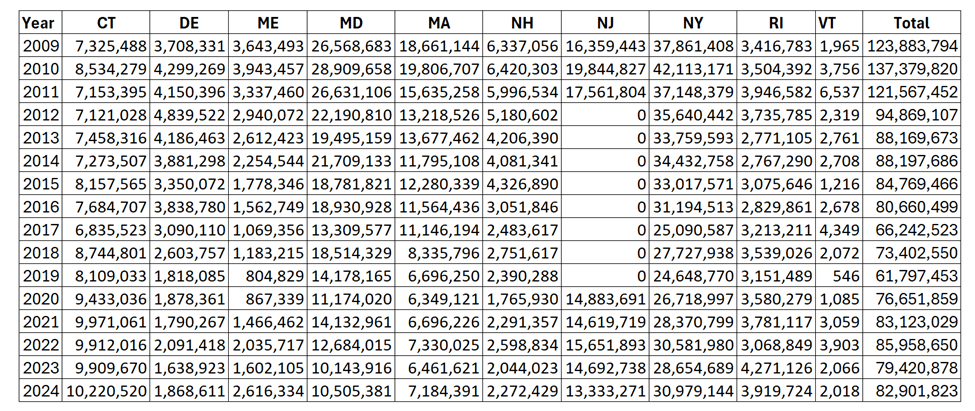
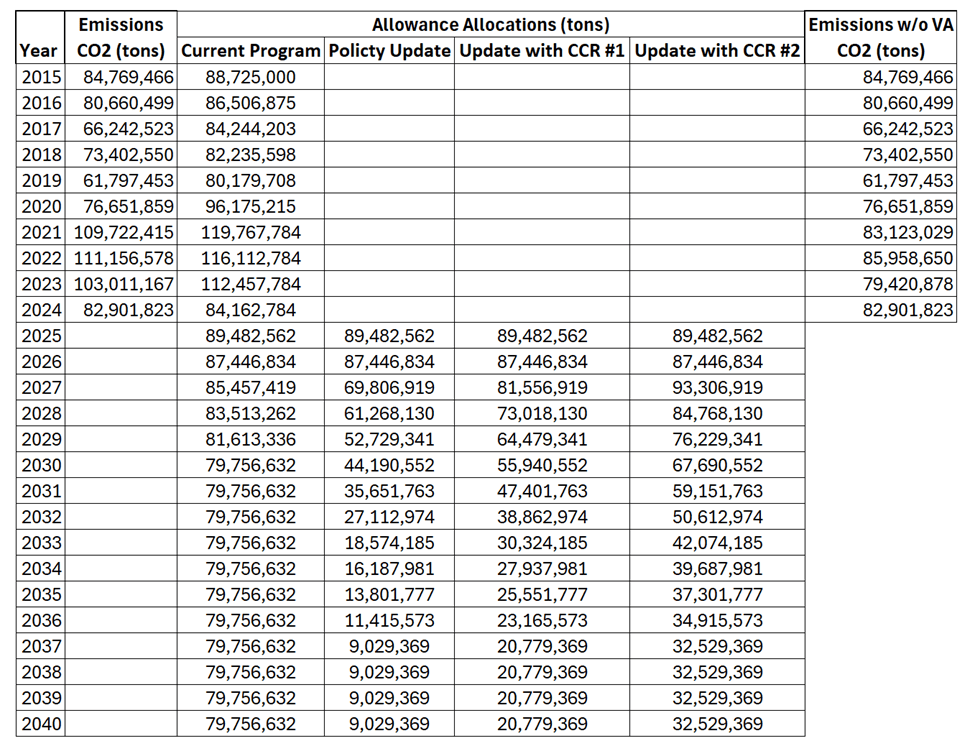
I also updated my summary of emissions for the RGGI states. Figure 2 graphs the CO2 emissions by fuel type and heat input for the nine states in RGGI that have been in the program since its inception. The reduction pattern is similar to New York. Emission reductions occurred because of fuel switching and when those opportunities were no longer available emissions began to rise.
Figure 2: Nine-State RGGI
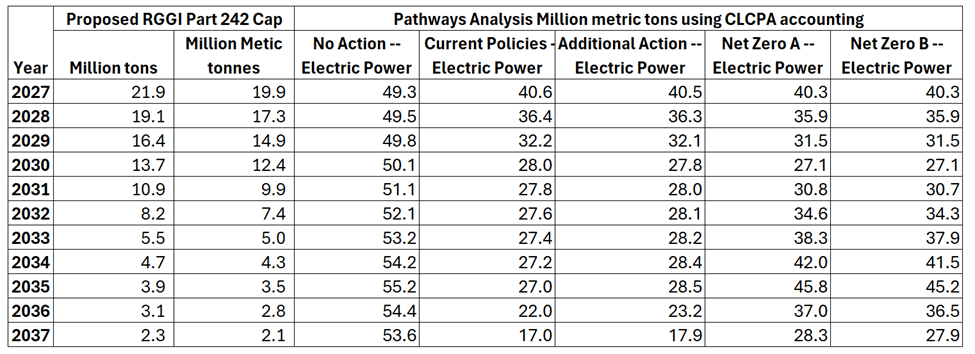
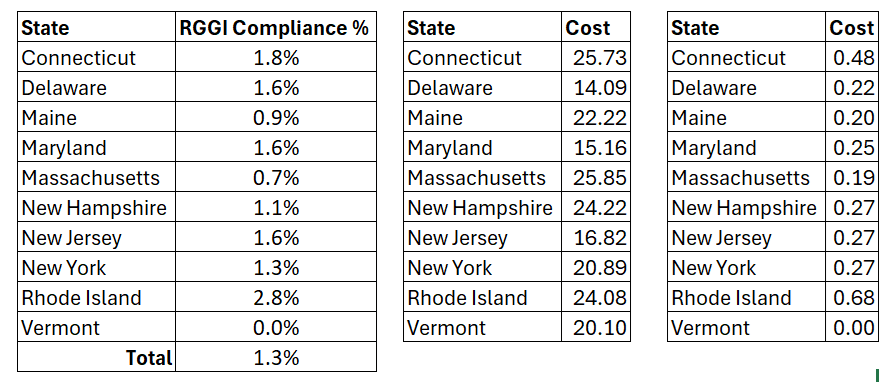
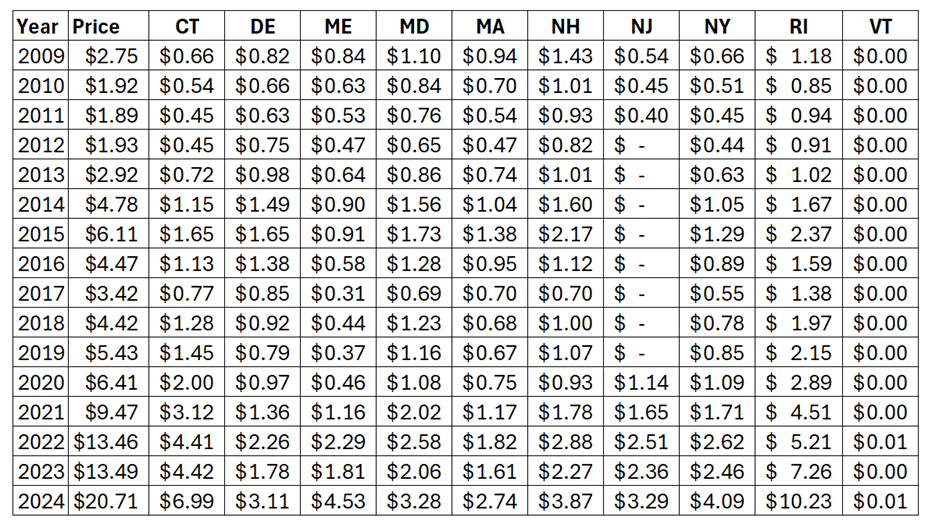
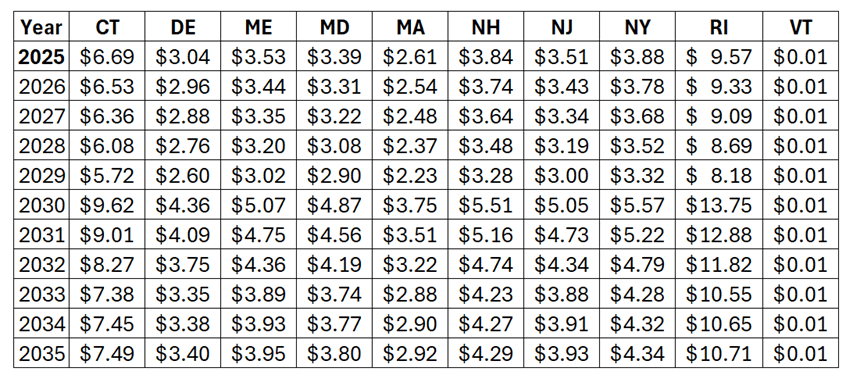
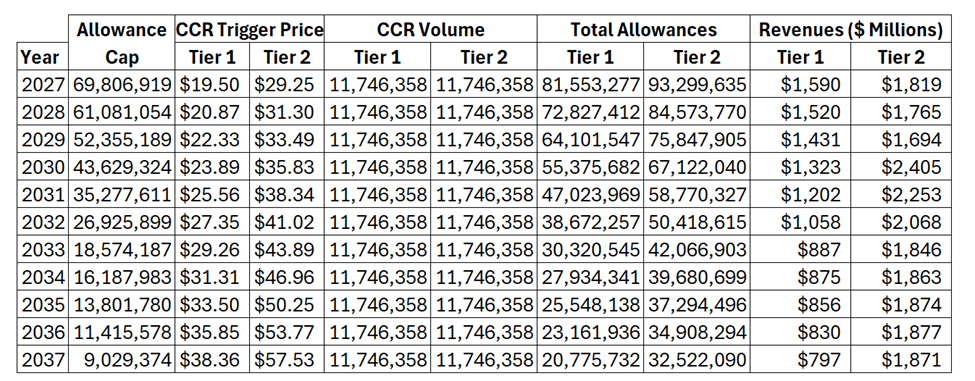
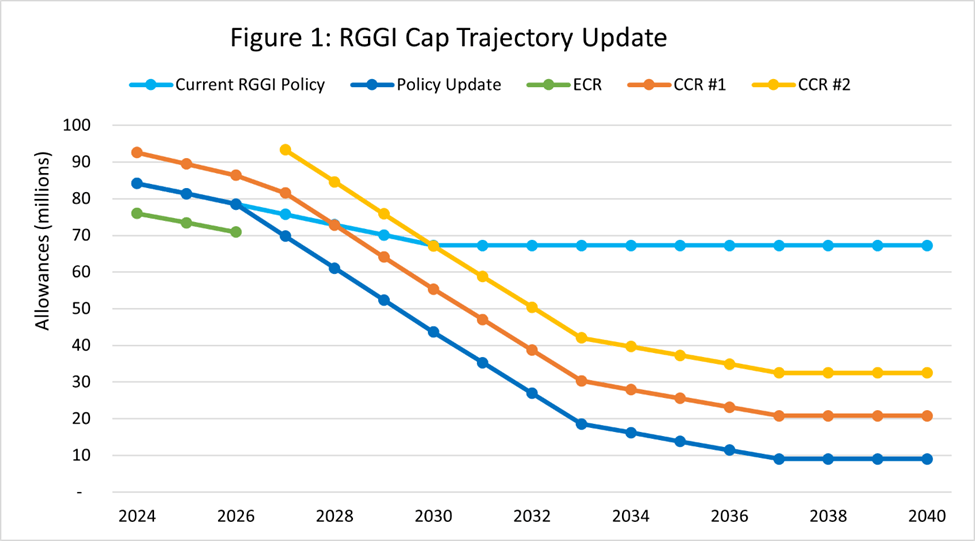
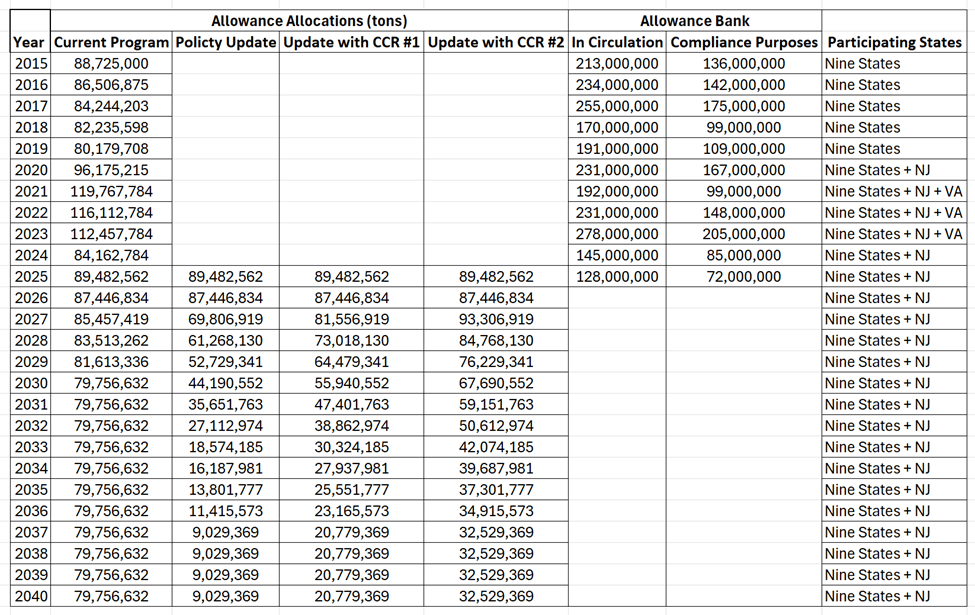
The compliance implications are significant. According to the RGGI website: “in 2025: the RGGI cap was 81,347,784 and the adjusted cap was 66,586,609 tons”. Emissions from all the active RGGI states were 87,042,982 tons in 2025. Compliance was only possible because of banked allowances. Eventually the bank will be used up and the most recent model rule calls for a further annual reduction of 8.5 million tons per year. Something must change regarding these emission trajectories or there will be issues. The RGGI cap on emissions essentially rations energy use because if there are insufficient permits to emit (aka allowances) affected generating units have no other options to reduce emissions. Therefore, they can only shut down to comply with the law. That will create an artificial energy shortage.
Conclusion
It was encouraging that NYSERDA finally provided a summary of comments received. Unfortunately, the descriptions were limited and my arguments that investments that reduce emissions should be a priority were ignored. The 2025 emissions data showed another increase in CO2 emissions both in New York and across all the RGGI states. This is a worrisome trend.