A few articles and notices about Off Shore Wind (OSW) came to my attention this week. The contradictions in the viewpoints were so different that I thought a post was appropriate.
I have been following the Climate Act since it was first proposed. I submitted comments on the Climate Act implementation plan and have written over 300 articles about New York’s net-zero transition. I have devoted a lot of time to the Climate Act because I believe the ambitions for a zero-emissions economy embodied in the Climate Act outstrip available renewable technology such that the net-zero transition will do more harm than good. The opinions expressed in this post do not reflect the position of any of my previous employers or any other company I have been associated with, these comments are mine alone.
Climate Act Background
The Climate Act established a New York “Net Zero” target (85% reduction and 15% offset of emissions) by 2050 and an interim 2030 target of a 40% reduction by 2030. The Climate Action Council is responsible for preparing the Scoping Plan that outlines how to “achieve the State’s bold clean energy and climate agenda.” In brief, that plan is to electrify everything possible and power the electric grid with zero-emissions generating resources by 2040. The Integration Analysis prepared by the New York State Energy Research and Development Authority (NYSERDA) and its consultants quantifies the impact of the electrification strategies. That material was used to write a Draft Scoping Plan. After a year-long review the Scoping Plan recommendations were finalized at the end of 2022. In 2023 the Scoping Plan recommendations are supposed to be implemented through regulation and legislation.
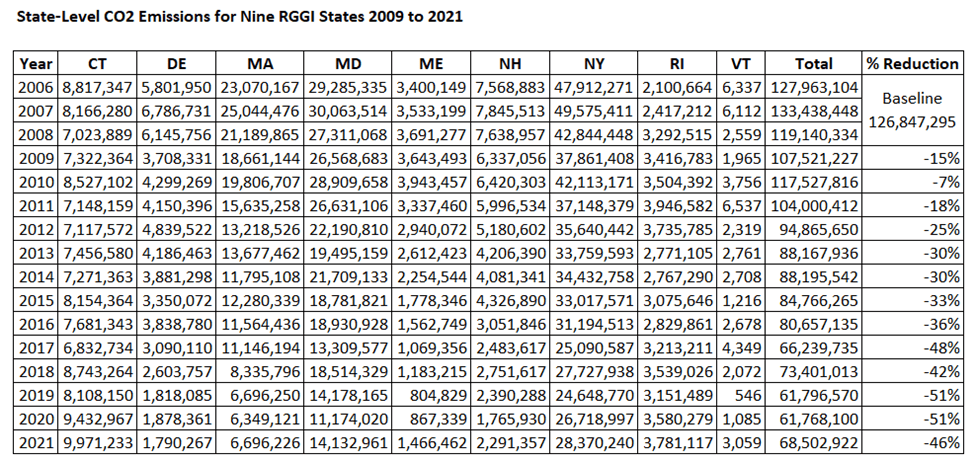
Off Shore Wind (OSW) will be a major renewable resource in the net-zero electric energy system. The Climate Act mandates 9,000 MW of Off Shore Wind (OSW) generating capacity by 2035. The Integration Analysis modeling used to develop the Scoping Plan projects OSW capacity at 6,200 MW by 2030, 9,096 MW by 2035 and reaches 14,364 MW in 2040. On the other hand, the New York Independent System Operator 2021-2040 System & Resource Outlook expects 5,036 MW in 2030 and 9,000 MW in 2035 with no additional development after that. By 2030 the Integration Analysis predicts that 14% of the electric energy (GWh) produced will come from OSW and the Resource Outlook predicts nearly as much (12%). This is an extraordinary build-out for a resource that is currently non-existent and there are significant differences in the buildout projections that deserve to be reconciled.
New Yorkers for Clean Power
I subscribe to a New Yorkers for Clean Power mailing list. Under the heading “ICYMI: Major Milestone Reached for State’s First Offshore Wind Project!” a recent mailing included this summary describing Governor Hochul announcement on June 22 that “South Fork Wind, New York’s first offshore wind farm, has achieved its “steel in the water” milestone with the installation of the project’s first monopile foundation.”
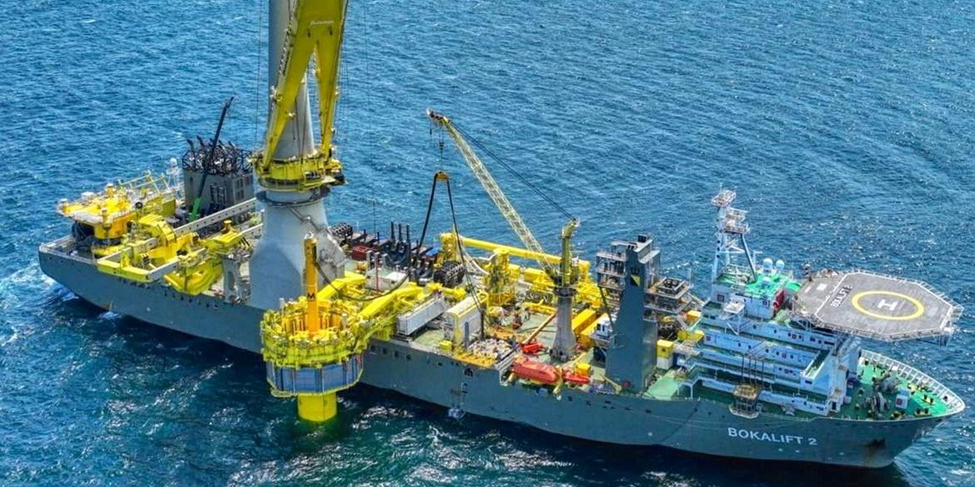
Boskalis Bokalift 2 wind turbine installation vessel. Photo: Boskalis/South Fork Wind
Late last month, Governor Hochul announced that the South Fork Wind project, New York’s first offshore wind farm, has achieved its “steel in the water” milestone with the installation of the project’s first monopile foundation.
This is the first of many major milestones for New York’s first offshore wind project and South Fork is on track to become the United States’ first completed utility-scale offshore wind project in federal waters.
Once completed, the wind farm will generate enough renewable energy to power roughly 70,000 homes helping New York meet its ambitious Climate Act goals, while eliminating up to six million tons of carbon emissions, or the equivalent of taking 60,000 cars off the road annually over a 25-year period. Hundreds of U.S. workers and three Northeast ports will support South Fork Wind’s construction through late fall helping to stand up a new domestic supply chain that’s creating hundreds of local union jobs across the Northeast.
Learn more about this exciting development!
The description did not add anything beyond what was contained in the press release. The website for the project notes:
What is it?
New York’s first offshore wind farm — with 12 turbines and a state-of-the-art transmission system that will generate enough clean energy to power 70,000 average homes and offset tons of emissions each year
Who’s behind it?
50/50 partnership between Ørsted and Eversource
When is it happening?
Expected to be operational by the end of 2023Where is it?
35 miles east of Montauk Point; the underground transmission line will deliver power to the local grid in the Town of East Hampton, NY
Despite the accolades there are issues associated with OSW as noted in the following.
Offshore Wind Costs
James Hanley wrote an article The Rising Cost of Offshore Wind that describes two issues affecting all OSW projects across the world:
But this recent growth in the offshore wind industry does not necessarily reflect its long-term health. Two substantial headwinds threaten to make projects uneconomical. One is the recent high inflation, which raised the costs of materials and labor across all industries, and the other is bottlenecked supply chains that are causing a bidding-up of the prices of materials and components needed for building wind turbines.
Hanley explains the ramifications to the OSW projects in New York:
The price of offshore wind is about to go up, and electricity users across the Empire State will be on the hook for it. Two firms developing offshore wind projects — Sunrise Wind and Equinor-bp — have gone to the state Public Service Commission asking for an increase in the price they’ll receive per megawatt-hour of electricity produced.
It is not just Hanley that is raising this issue. Sheri Hickok, Chief Executive for onshore wind, GE Renewable Energy Wind farm costs are not falling:
The state of the supply chain is ultimately unhealthy right now. It is unhealthy because we have an inflationary market that is beyond what anybody anticipated even last year. Steel is going up three times…It is really ridiculous to think how we can sustain a supply chain in a growing industry with these kind of pressures…Right now, different suppliers within the industry are reducing their footprint, they are reducing jobs in Europe. If the government thinks that on a dime, this supply chain is going to be able to turn around and meet two to three times the demand, it is not reasonable.
The Climate Act includes language that requires the agencies consider the experiences of other jurisdictions. This mandate is selectively used to justify the preconceived strategies in the Scoping Plan but never to consider the potential for warning signs. As if the request for adjustments to the contracts described by Hanley is not enough, a similar situation is playing out in Great Britain. Net Zero Watch reports that:
In a move that gives the lie to years of propaganda claiming falling costs, the wind industry’s leading lobbyists have written to the Government, threatening to abandon the UK unless there are hugely increased subsidies for their companies (see RenewableUK press release).
The industry is claiming that unforeseen rising costs now necessitate and justify three actions:
1) A vast increase in the budget for the fifth auction (AR5) of Contracts for Difference subsidies, with an increase of two and half times the current levels for non-floating offshore wind alone;
2) Special new targets and thus market shares for floating offshore wind, one of the most expensive of all forms of generation, and, most importantly of all,
3) a revision to the auction rules so that the winners are not determined by lowest bids but by an administrative decision that weights bids according to their “value” in contributing towards the Net Zero targets.
This would in effect not only increase total subsidy to an industry that was until recently claiming to be so cheap that it no longer needed public support, but also provide it with protected market shares, all but entirely de-risking investors at the expense of consumers.
It would also be an open invitation to graft and corruption.
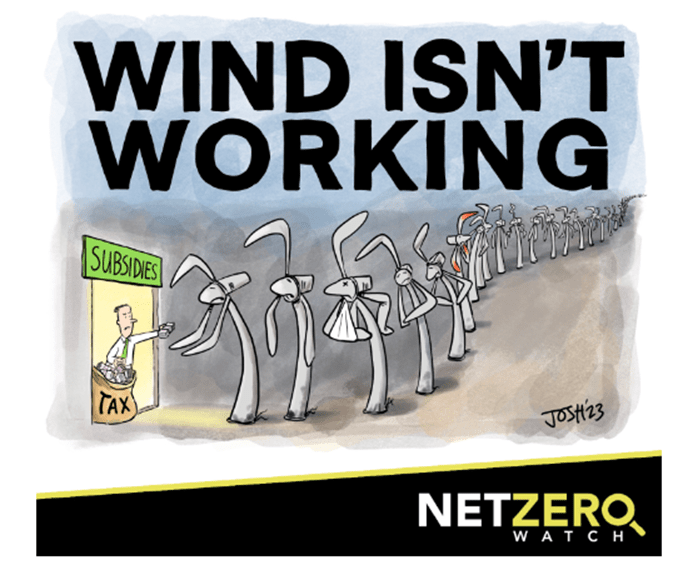
This blackmail was predicted by Net Zero Watch. Clearly the same playbook will be used by OSW developers here. Hanley explains:
Given the fiscal realities of the situation, PSC’s only two options are to grant the request or delay the development of wind energy while the state seeks new offshore wind construction bids. Either way, costs will rise.
OSW Environmental Impacts
Earlier this year I described the Citizens Campaign for the Environment virtual forum entitled Whale Tales and Whale Facts. The sponsors wanted the public to hear the story that there was no evidence that site survey work was the cause of recent whale deaths. I concluded that the ultimate problem with the forum was that they ignored the fact that construction noises will be substantially different than the ongoing site surveys and will probably be much more extensive when the massive planned construction starts. Jim Lovgren writing at FisheryNation.com describes OSW environmental issues: Offshore Wind Electrical Substations; The Secret, Silent Killers that substantiate my concern:
Despite government and wind supporters denying any proof that could link the unseen before amount of strandings to the coincidental use of geological sonar and seismic research, [usually only of a type performed by oil companies] in the near vicinity of the strandings, the evidence mounts. This week, two Humpback Whales washed ashore in Martha’s Vineyard, coincidentally only a few days after Piledriving started at a nearby wind site. Piledriving of the turbine stanchions creates a 260 DBs level sound, that no amount of “Bubble Curtains” can contain. It is deadly. A few weeks before that beaches on the south shore of Nantucket had a carpet of dead crabs, clams, and other benthic organisms that are susceptible to seismic testing, which coincidentally was taking place nearby, [“sparkers” and sub- bottom profilers are seismic equipment]. The relationship of marine animal deaths while unsafe level industrial noises are being produced in the same vicinity are too numerous to ignore, worldwide. So, stop denying them.
Lovgren argues that there is another environmental impact that should be considered. The industrial OSW developments require electrical substations. He explains:
In an official BOEM document written by Pamela Middleton and Bethany Barnhart called, “Supporting National Environmental Policy Act Documentation for Offshore Wind Energy Development related to High Voltage Direct Current Cooling Systems” the authors contend that the only feasible cooling system for a HVDC Substation is a once through, or open system. The kind that is not allowed for new power plant construction, because of its devastating effects on aquatic life. This embarrassing Official BOEM document concerning the effects of offshore wind substations admits it knows nothing about how many substations are planned, how big, and where they will be. NEPA concerns such as environmental and economic costs to other industries are totally ignored within the enormous expanse of information contained within the 4 ½ pages of actual text. Up until the Green new deal a NEPA supporting document would be hundreds, and even thousands of pages long, detailing all aspects of a proposed project.
This is another example of an issue that was the focus of an intense and emotional lobbying effort when it was related to electric power plants using once-through cooling but now this is not an issue by the environmental organizations who demanded the prohibition for new power plants.
Summary of All OSW Issues
Mark Sertoff, a science/technology educator, published an article at Natural Gas Now that argued that the “stampede to build offshore wind turbines to replace fossil fuel generation is loaded with concerns that have not been thought through or been resolved.” I recommend reading the whole article. He made the general points that all this is unnecessary. There is no climate crisis and all the hysterical claims supporting that narrative evaporate upon close examination. He also pointed out that replacing the existing electrical system will lead to higher costs.
The article then documents specific OSW concerns. He lists the many direct environmental impacts, the seabed use requirements, and the disposal problem. Then he addresses the experiences in other countries and notes all the problems that should be a wakeup call for New York. Finally, he offers an alternative approach that will reduce emissions and costs.
Conclusion
The contrast between the positions of New Yorkers for Clean Power and the authors of the articles described here is stark. Most disappointing to me is that the climate activists ignore many issues that caused previous angst. If it was so important in the past, why is it not an issue now? If they don’t demand that all construction work cease when the critically endangered North Atlantic Right Whales migrate through the OSW facilities then they will be exposed as hypocrites. The gulf between a model projection of future weather and its impacts on whales and the imminent and potentially fatal consequences of OSW development on whales is so clear how can the activists claim to be for a sustainable future unless they step up?
I cannot improve on Sertoff’s conclusion:
Entities profiting by promoting renewables are happy to pave the road to hell. Superior solutions exist backed by solid facts. We ignore them at our peril.