I have been writing about the Climate Leadership & Community Protection Act (Climate Act) for over four years and a constant theme in my work has been concerns about affordability and reliability. For all the analyses and pontification by the State of New York about the net-zero transition, there still is no documentation describing the costs of the control strategies proposed by the Scoping Plan and estimates of how New Yorkers will pay for the transition. The focus of this post is on reliability. I believe that the only way we can be sure that the plans proposed to operate an electric grid that relies primarily on wind and solar is to prove it with a demonstration project. The project should include all the key elements: wind and solar generation, energy storage, a dispatchable emissions-free resource and any other resources needed to provide necessary ancillary services. This post highlights work by Francis Menton that advocates just such a demonstration project.
I have followed the Climate Act since it was first proposed, submitted comments on the Climate Act implementation plan, and have written over 350 articles about New York’s net-zero transition. I have devoted a lot of time to the Climate Act because I believe the ambitions for a zero-emissions economy embodied in the Climate Act outstrip available renewable technology such that the net-zero transition will do more harm than good by increasing costs unacceptably, threatening electric system reliability, and causing significant unintended environmental impacts. The opinions expressed in this post do not reflect the position of any of my previous employers or any other organization I have been associated with, these comments are mine alone.
Climate Act Background
The Climate Act established a New York “Net Zero” target (85% reduction and 15% offset of emissions) by 2050. It includes an interim 2030 reduction target of a 40% reduction by 2030 and a requirement that all electricity generated be “zero-emissions” by 2040. The Climate Action Council is responsible for preparing the Scoping Plan that outlines how to “achieve the State’s bold clean energy and climate agenda.” In brief, that plan is to electrify everything possible using zero-emissions electricity. The Integration Analysis prepared by the New York State Energy Research and Development Authority (NYSERDA) and its consultants quantifies the impact of the electrification strategies. That material was used to develop the Draft Scoping Plan. After a year-long review, the Scoping Plan recommendations were finalized at the end of 2022. In 2023 the Scoping Plan recommendations are supposed to be implemented through regulation and legislation. Over nine months into 2023 and reality is starting to set in and cast aspersions on the aspirational plans.
Demonstration Project Proposal
Last February I did a post on Climate Smart Communities and I proposed a challenge to the local governments that pledged to be climate smart. Go for it, but not just this virtue-signaling public relations gesture to get some money. I described Francis Menton’s article explaining that a demonstration project of a mainly renewables-based electrical grid is a common sense prerequisite before there are any more plans or pledges. I said that Climate Smart Communities of New York should prove their bona fides and develop a demonstration project for their community to address the issues he raised:
Nobody would be happier than me to see a demonstration project built that showed that wind and solar could provide reliable electricity at low cost. Unfortunately, I know too much about the subject to think that that is likely, or even remotely possible. But at least the rest of us need to demand a demonstration project from the promoters of these fantasies.
Menton describes people who don’t support the need for an encompassing fossil-fuel-free renewable grid demonstration project. Government officials and green energy advocates won’t support this because:
(1) they are not bright enough to understand the subject, or (2) their understanding is impaired because they are too blinded by religious fervor to “save the planet,” or (3) they are intentionally deceiving the public to make money or fame or career advancement for themselves. Or it could be all three!
Instead of a single comprehensive demonstration, net-zero proponents promote projects that only “attempt to demonstrate various portions of the full system that would be needed to provide reliable 24/7/365 electricity from predominantly wind and solar generation.” I believe a common problem of all the “green” energy solutions is that they do not work all the time and renewable resource availability is correlated over large distances which makes demonstrations of individual components worthless.
Menton agrees and describes the example of the latest news on energy storage. He explain that on October 13, the Department of Energy announced big new grants and subsidies for a series of what they call “hydrogen hubs.” Here is a report from E&E News Energy Wire. Excerpt:
The Department of Energy on Friday announced seven projects that will receive $7 billion to build landmark hydrogen hubs, delivering a major boost to a nascent U.S. industry. The long-awaited move is a key piece of the Biden administration’s climate agenda. On Friday, the White House said it expects the DOE funding to help cut 25 million metric tons of carbon dioxide annually, roughly equivalent to removing 5.5 million gasoline-powered vehicles from the road each year. “With this historic investment, the Biden-Harris administration is laying the foundation for a new, American-led industry that will propel the global clean energy transition,” said Secretary of Energy Jennifer Granholm.
The New York placeholder for dispatchable emissions-free resources is “green” hydrogen. Menton explains that according to this further piece from Energy Wire on August 21, the Biden Administration has set a goal of having the U.S. produce 10 million metric tons of “green” hydrogen (by electrolysis from water) by 2030. The E&E piece states that the massive funding for “hydrogen hubs” is for “demonstrations.” He points out that this is not the demonstration project needed to prove viability of the net-zero transition because the demonstrations focus on production, storage, transport and consumption but not the integrated resource necessary. He notes:
They are clearly leaving out the critical piece of the puzzle, which is the demonstration of how much of this hydrogen, and capacity to make more of it, will be needed, and at what cost, to get the country — or even some small town — through a full year (or two or five) without need for fossil fuel backup. That completely obvious elephant is not part of this multi-billion dollar “demonstration.”
Another dispatchable emissions-free resource for New York’s net-zero transition could be long duration energy storage. Menton notes that the Department of Energy has a “separate big bucks effort called the “Long Duration Storage Shot” that is throwing bucketsful of cash at various research efforts into batteries.” Unfortunately, he notes:
The battery efforts are even farther removed from any relevant demonstration project. From DOE’s opening webpage describing that initiative (with a date of September 2021):
The U.S. Department of Energy’s (DOE) Energy Earthshots Initiative aims to accelerate breakthroughs of more abundant, affordable, and reliable clean energy solutions within the decade. Achieving the Energy Earthshots will help America tackle the toughest remaining barriers to addressing the climate crisis, and more quickly reach the Biden-Harris Administration’s goal of net-zero carbon emissions by 2050 while creating good-paying union jobs and growing the clean energy economy. . . . The Long Duration Storage Shot establishes a target to reduce the cost of grid-scale energy storage by 90% for systems that deliver 10+ hours of duration within the decade.
On September 22, 2023 the Administration announced some $325 million for “15 projects across 17 states and one tribal nation” to “accelerate the development” of these “long duration” battery technologies. He writes:
So are these battery technologies, or any one of them, even a potential solution to the problem of making a mostly wind/solar electricity grid work without fossil fuel backup? Again, you will not find any mention at those links, or at other government or advocate sites discussing the issue of how many of these batteries would be necessary and at what cost to actually fully back up a predominantly wind/solar grid and make it into a functional 24/7/365 electricity system.
I cannot over-emphasize how challenging these two technologies are. I fear that some aspects of some of these demonstrations will be deemed a success which will be used to argue that the concerns of organizations responsible for keeping the lights on and skeptical technical experts who have no vested interests in the green energy scam are unwarranted. Theory, small prototype tests, and these demonstration projects all will not prove the feasibility of a fully-functioning wind/solar/hydrogen storage 24/7/365 electricity grid.
Another aspect of this is that until we have a proof-of-concept demonstration that incorporates all the components needed to get to a reliable system, we cannot know how much it will cost. Menton argues that a rough cost estimate “would come to a multiple (not necessarily a huge one, but nonetheless a multiple) of what our current electricity system costs.” He does not bother to make an estimate writing:
The reason I’m not going to do it is that there as an obvious fact that tells you all you need to know, which is that no one in the country is spending their own private money to build out this system. They are all waiting for the government handouts. If this system could be built profitably at a cost competitive with what we have, there would be investors falling all over themselves to build it. When Thomas Edison built his first electricity plant, he did not go to the government for handouts to build it. Because this is all a fantasy kept alive by government handouts, as soon as the handouts go away or even slow down, the whole thing will dry up and fade away.
Conclusion
We do not know if the net-zero transition is technically possible. All we have is assurances from vested interests and slick marketing claims from the state. Richard Feynman said “For a successful technology, reality must take precedence over public relations, for Nature cannot be fooled.” Before New York goes any further, a comprehensive demonstration project for a smaller jurisdiction is the pragmatic approach.
The Regional Greenhouse Gas Initiative (RGGI) is a carbon dioxide control program in the Northeastern United States. One aspect of the program is a program review that is a “comprehensive, periodic review of their CO2 budget trading programs, to consider successes, impacts, and design elements”. On September 26, 2023 the RGGI States hosted two webinars describing technical modeling & analyses that examined the electricity market, emissions, and economic impacts of potential changes to RGGI. This post describes the disconnect between the results of RGGI to date relative to the expectations in the RGGI Third Program Review modeling that I addressed in my comments to RGGI.
RGGI is a market-based program to reduce greenhouse gas emissions. According to RGGI:
The Regional Greenhouse Gas Initiative (RGGI) is a cooperative effort among the states of Connecticut, Delaware, Maine, Maryland, Massachusetts, New Hampshire, New Jersey, New York, Pennsylvania, Rhode Island, Vermont, and Virginia to cap and reduce power sector CO2 emissions.
RGGI is composed of individual CO2 Budget Trading Programs in each participating state. Through independent regulations, based on the RGGI Model Rule, each state’s CO2 Budget Trading Program limits emissions of CO2 from electric power plants, issues CO2 allowances and establishes participation in regional CO2 allowance auctions.
More background information on cap-and-trade pollution control programs and RGGI is available from the Environmental Protection Agency and my RGGI posts page. Proponents of these programs consider them silver bullet solutions. However, I agree with Danny Cullenward and David Victor’s book Making Climate Policy Work that the politics of creating and maintaining market-based policies for Greenhouse Gas (GHG) emissions “render them ineffective nearly everywhere they have been applied”.
ICF’s Integrated Planning Model provides true integration of wholesale power, system reliability, environmental constraints, fuel choice, transmission, capacity expansion, and all key operational elements of generators on the power grid in a linear optimization framework. The model captures a detailed representation of every electric boiler and generator in the power market being modeled.
In March the RGGI States explained that they planned to use IPM to evaluate several issues. One problem is “fluidity of state participation”. Nine states have been members of RGGI since its inception. New Jersey was a charter member, got out, and now is back in; Virginia was in but is now getting out; and Pennsylvania is trying to get in but participation has been stalled by litigation. RGGI planning must address climate and complementary energy policies that will dramatically impact electricity load such as electric vehicles and EV infrastructure, electrification in the building sector, and aggressive energy efficiency efforts. A major concern of the program review was allowance availability so the decarbonization timeline for the electricity sector was considered. This is complicated because participating State timelines vary, implementation of offshore wind deployment affects decarbonization rates and grid-scale battery storage deployment, duration, and supply certainties affect the outcomes.
The September 26 webinar described three key observations from the modeling results:
Modeling shows how current state decarbonization and renewable requirements can significantly reduce emissions;
Federal incentives for clean energy have the potential to rapidly transform the RGGI region generation mix; and
Scenarios modeled to date show relatively low allowance prices compared to the ECR/CCR price triggers in the Model Rule
The RGGI States have not proposed their plans for the Third Program Review. The modeling observations support the idea that the RGGI allowance availability can be made more stringent. So much so that the modeling plans changed from the spring to add a more stringent trajectory to reach zero emissions by 2035 rather than just looking at a zero emissions by 2040 trajetory. My comments addressed these key observations .
I will summarize my concerns below but first it is necessary to review RGGI results to date.
RGGI Results to Date
There is an unfortunate disconnect between the results of RGGI to date relative to the expectations in the Third Program Review. During the September 26 meeting the explanation of cap-and-trade systems stated that “States reinvestthe proceeds in decarbonization and other programs to deliver benefits to their communities.” What was missing was any mention of the efficacy of those investments relative to the emission reductions observed.
The primary cause of the observed RGGI emission reductions has been the fuel switch from coal and residual oil to natural gas. Table 1 lists the emissions by fuel types for the nine RGGI states that have been members since the start. I believe that RGGI had very little to do with these fuel switches because fuel costs are the biggest driver for operational costs and natural gas was cheaper. The cost adder of the RGGI carbon price to date has been too small to drive the conversions from coal and oil to natural gas.
Table 1: RGGI Program Unit CO2 Emissions (tons) by State and Year
RGGI sources within the nine-state region have already implemented most of the coal and residual oil fuel switching opportunities available so this control strategy will be less impactful in the future. For example, in New York coal-fired electric generation has been banned and the remaining units that burn residual oil primarily run to only provide critical reliability support so their emissions are not expected to change much from current levels. In the future, RGGI affected source emission reductions will rely on the displacement of natural gas fired units with wind and solar zero emitting sources.
The 2021 investment proceeds report released on June 27, 2023 provides insight into the success of RGGI investments as an emission reduction tool. The report breaks down the investments into five major categories:
Energy efficiency makes up 51% of 2021 RGGI investments and 55% of cumulative investments. Programs funded by these investments in 2021 are expected to return about $418 million in lifetime energy bill savings to more than 34,000 participating households and over 570 businesses in the region and avoid the release of 2.3 million short tons of CO2.
Clean and renewable energy makes up 4% of 2021 RGGI investments and 13% of cumulative investments. RGGI investments in these technologies in 2021 are expected to return over $600 million in lifetime energy bill savings and avoid the release of more than 1.7 million short tons of CO2.
Beneficial electrification makes up 13% of 2021 RGGI investments and 3% of cumulative investments. RGGI investments in beneficial electrification in 2021 are expected to avoid the release of 370,000 short tons of CO2 and return nearly $164 million in lifetime savings.
Greenhouse gas abatement and climate change adaptation makes up 11% of 2021 RGGI investments and 8% of cumulative investments. RGGI investments in greenhouse gas (GHG) abatement and climate change adaptation (CCA) in 2021 are expected to avoid the release of more than 10,000 short tons of CO2 and to return over $20 million in lifetime savings.
Direct bill assistance makes up 14% of 2021 RGGI investments and 13% of cumulative investments. Direct bill assistance programs funded through RGGI in 2021 have returned over $29 million in credits or assistance to consumers.
There is an important caveat to the emission reductions reported in the report. The RGGI compliance metric is annual emissions and the above quote lists the lifetime emission reductions. The sum of the lifetime emission reductions from the 2021 investments is 4.38 million tons but the annual emission reductions due to RGGI investments were only 235,299 tons (Figure 1). The 9-state allowance allocation annual reduction in 2021 was 2,275,000 allowances so RGGI was only responsible for around 10% of the emission reductions required.
The results in 2021 are consistent with historical observations. To make a comparison to the CO2 reduction goals I had to sum the annual values in the previous reports because RGGI does not report the annual RGGI investment CO2 reduction values accumulated since the beginning of the program. Table 2 lists the annual avoided CO2 emissions generated by the RGGI investments from previous reports. The accumulated total of the annual reductions from RGGI investments is 3,893,925 tons while the difference between the three-year baseline of 2006-2008 and 2021 emissions is 58,334,373 tons. The RGGI investments are only directly responsible for 6.7% of the total observed annual reductions over the baseline to 2021 timeframe!
Table 2: Accumulated Annual RGGI Benefits Through 2021
Dividing the total RGGI investments by the total tons reduced provides the cost per ton reduced. The cumulative RGGI investment cost effectiveness is $927 per ton reduced. That is far more than the Resources for the Future Social Cost of Carbon estimate of $185 per ton and indicates that costs exceed societal benefits.
Concerns with Results – Recommendations are highlighted in bold
There is a unique aspect of the Third Program Review modeling process that has not been available previously. There are two independent modeling projections of the New York electricity system resources necessary to meet a zero-emission target by 2040. The New York Independent System Operator (NYISO) has evaluated scenarios that project the resources necessary to achieve the New York Climate Leadership and Community Protection Act goal of a zero-emissions electricity generating system by 2040. New York’s Scoping Plan was guided by an Integration Analysis that modeled the transition. Comparison of those projections with the Integrated Planning Model (IPM) projections enables a check on how these requirements can reduce emissions using different methodologies.
The most glaring difference between the RGGI IPM modeling of New York and the New York analyses is the generation fossil-fuels sector (Table 3). The table subtracts the NYISO Resource Outlook Scenario 1 projected generation from the RGGI IPM modeling allowance supply scenarios for Assumption Set B and Integration Analysis Scenario 2. The percentage difference shows that the IPM projects substantially more generation than NYISO and the Integration Analysis.
Table 3: Fossil Resource Sector Difference in Generation (GWH) Between the NYISO Resource Outlook and the RGGI IPM and Scoping Plan Integration Analysis Strategic Use of Low-Carbon Fuels Scenario
Because RGGI affected source emissions are so strongly correlated with operations these higher operating rates mean that the RGGI IPM modeling projects lower fossil-fired emissions than either model. In Table 4 I estimated New York CO2 emissions by multiplying these projected generation differences times the 2022 calculated CO2 emission rate per MWh. In the NYISO Resource Outlook column the emissions are relative to those scenario differences. Similarly, the emission differences in the Integration Analysis are relative to the Scoping Plan projections. IPM underestimates the fossil sectors emissions significantly.
Table 4: Fossil Resource Sector Difference in Projected CO2 Emissions (tons) Between the RGGI IPM and NYISO Resource Outlook and Scoping Plan
The RGGI States chose not to include any allowance supply numbers so I was forced to make my own estimates to determine the significance of these emissions. I projected allowance availability using a linear interpolation between 2023 allowance allocations and zero by 2035 and 2040. For the zero by 2040 allowance supply scenario, the 2030 emissions difference represents 27% of my estimated allowance allocation. For the zero by 2035 allowance supply scenario, the 2030 emissions difference represents 42% of my estimated allowance allocation. This suggests that this modeling difference needs to be reconciled to determine its impact on the RGGI State allowance allocation trajectory proposal.
There is another issue associated with the modeling results. The ICF description of these modeling results notes that “due to the stringency of the program after 2040, the model shows an over-compliance of emissions in the early years (2025-2030) and banking of those allowances for when the cap is reduced in 2035 and beyond. “ This is an artifact of the perfect foresight methodology of IPM and, I believe, is unlikely to occur.
I think this is wrong because the modeling approach claims affected sources “over-comply”. RGGI sources do not “over-comply” but rather acquire allowances to meet their compliance obligations with a slight surplus to ensure compliance My primary concern is New York and in New York sources that could fuel switch to natural gas have already done so. They cannot directly affect their compliance except by limiting operations. Thus, RGGI sources in NY are at the point where they must rely on renewable energy to displace their need to operate. This means that they only purchase the allowances they expect to use for their compliance obligations plus a small compliance cushion.
Based on the modeling description, IPM “perfect foresight” projects results over longer planning horizons than used in practice. I believe that affected-sources across RGGI treat the allowance requirements as a short-term, no more than a couple of compliance periods, compliance obligation. It is highly unlikely that most affected sources are making plans beyond short-term compliance periods so the idea that affected source would over-comply in early years for more stringent limits ten years ahead is incorrect. The open question is how does this affect the allowance trajectories. It might also account for differences between the NYISO and Integration Analysis projections. The best way to reconcile this is in an open public forum with the modeling groups.
Renewable developments are struggling due to soaring interest rates and rising equipment and labor costs. Reuters describes two “procured” projects in the RGGI region that have been cancelled:
(AGR.N), a U.S. subsidiary of Spanish energy firm Iberdrola (IBE.MC), said it filed agreements with power companies in Connecticut to cancel power purchase agreements for Avangrid’s proposed Park City offshore wind project.
“One year ago, Avangrid was the first offshore wind developer in the United States to make public the unprecedented economic headwinds facing the industry,” Avangrid said in a release.
Those headwinds include “record inflation, supply chain disruptions, and sharp interest rate hikes, the aggregate impact of which rendered the Park City Wind project unfinanceable under its existing contracts,” Avangrid said.
Avangrid has said it planned to rebid the Park City project in future offshore wind solicitations.
Also over the past week, utility regulators in Massachusetts approved a proposal by SouthCoast Wind, another offshore wind developer, to pay local power companies a total of around $60 million to terminate contracts to provide about 1,200 MW of power.
In New York, on October 12, 2023 the Public Service Commission turned down a request to address the same cost issues. Times Union writer Rick Karlin summarizes:
At issue was a request in June by ACE NY, as well as Empire Offshore Wind LLC, Beacon Wind LLC, and Sunrise Wind LLC, which are putting up the offshore wind tower farms.
All told, the request, which was in the form of a filing before the PSC, represented four offshore wind projects totaling 4.2 gigawatts of power, five land-based wind farms worth 7.5 gigawatts and 81 large solar arrays.
All of these projects are underway but not completed. They have already been selected and are under contract with the New York State Energy Research and Development Authority, or NYSERDA, to help New York transition to a clean power grid, as called for in the Climate Leadership and Community Protection Act, approved by the state Legislature and signed into law in 2019.
Developer response to the PSC decision suggests that “a number of planned projects will now be canceled, and their developers will try to rebid for a higher price at a later date — which will lead to delays in ushering in an era of green energy in New York”. Karlin also quotes Fred Zalcman, director of the New York Offshore Wind Alliance: “Today’s PSC decision denying relief to the portfolio of contracted offshore wind projects puts these projects in serious jeopardy,”
These issues impact the proposed RGGI allowance trajectories based on the “potential to rapidly transform the RGGI region generation mix”. The IPM modeling projects significant emission reductions presuming that procured renewable energy projects will come on line consistent with the contracts at the time of the modeling. The two cancelled projects in New England total 2,000 MW and the threatened New York wind projects total 11,700 MW. Any projects delayed mean RGGI-affected source emissions will not be displaced as originally expected. If the allowance trajectory proposed does not account for this new information, then compliance will be threatened because affected sources have so few options available to reduce emissions. I recommended that a RGGI IPM modeling scenario be run to consider the effect of a delayed implementation schedule before finalizing Third Program Review recommendations. In fact, given the importance of renewable development on the emission trajectories it might even be appropriate to delay the timing of completion of this program review.
There is another consideration regarding feasibility. As noted above, the accumulated annual emission reductions due to RGGI investments is 3,893,925 tons and RGGI investments over the same time frame total $3,608,950,013 so the cost per ton avoided is $927. If the only source of future emission reductions were the result of RGGI investments, then RGGI allowance prices would have to equal $927 to get the necessary reductions. Of course, other investments will also reduce emissions but the RGGI States should consider cost considerations for the viability of renewable energy resources needed to get RGGI affected source emissions to zero. None of these models address this uncertainty.
The final observation noted at the September 26 webinar was that “Scenarios modeled to date show relatively low allowance prices compared to the ECR/CCR price triggers in the Model Rule”. Low allowance prices indicate that emissions are lower than the allowances auctioned so there is a surplus of allowances. My description of RGGI results to date noted that RGGI-affected sources have limited options to switch from coal and residual oil to natural gas. I expect that as the opportunities to switch fuels diminish that the allowance market will get tighter and allowance prices will go up. This could trigger the RGGI cost containment reserve. If allowance prices exceed predefined price levels, this RGGI feature will release additional allowances to the market. If the allowance trajectory is too aggressive and emissions do not decrease as expected because wind and solar do not come on line as planned or there is an abnormal weather year increasing load and decreasing wind and solar availability, then there could be a situation where there simply are not enough allowances available for compliance. The Cost Containment Reserve could prevent this from occurring. However, no scenarios with this feature have been modeled yet. I recommended that the RGGI States should model a scenario where the renewable implementation is delayed and the Cost Containment Reserve is employed.
Conclusion
I am afraid that the RGGI States are placing so much reliance on the IPM analysis results that they could propose unrealistic allowance reduction trajectories. It is naïve to treat any model projections of the future energy system without a good deal of skepticism because the electric grid is so complex and currently dependent upon dispatchable resources. Replacement of RGGI-affected sources with intermittent and diffuse wind and solar resources that cannot be dispatched is an enormous challenge with likely unintended consequences. Therefore, the results should be considered relative to historical observations.
I don’t see much indication that the RGGI States are considering the results of RGGI to date. I am leery of any model projections of this future system but I have much greater faith in projections by the NYISO because they are responsible for electric system reliability. I think there are significant differences between the NYISO projections and IPM. Until those differences are reconciled, I will be skeptical. Kevin Kilty summed up a rational approach to the use of model results that I fear the RGGI States will ignore: “Beware. Expect Surprises. Expensive Ones”.
Climate Act since it was first proposed and most of the articles described are related to it. I have devoted a lot of time to the Climate Act because I believe the ambitions for a zero-emissions economy embodied in the Climate Act outstrip available renewable technology such that the net-zero transition will do more harm than good. . The opinions expressed in this article do not reflect the position of any of my previous employers or any other company I have been associated with, these comments are mine alone.
The Climate Act established a New York “Net Zero” target (85% reduction and 15% offset of emissions) by 2050. It includes an interim 2030 reduction target of a 40% reduction by 2030 and a requirement that all electricity generated be “zero-emissions” by 2040. The Climate Action Council is responsible for preparing the Scoping Plan that outlines how to “achieve the State’s bold clean energy and climate agenda.” In brief, that plan is to electrify everything possible and power the electric grid with zero-emissions generating resources. The Integration Analysis prepared by the New York State Energy Research and Development Authority (NYSERDA) and its consultants quantifies the impact of the electrification strategies. That material was used to write a Draft Scoping Plan. After a year-long review the Scoping Plan recommendations were finalized at the end of 2022. In 2023 the Scoping Plan recommendations are supposed to be implemented through regulation and legislation.
Videos of Note
For those of you who would rather watch a video than read about a topic I list a few interesting videos. This video describes historic global temperatures and how ancient temperatures are estimated. I think it does a good job describing a complicated subject.
Renewable developments are struggling due to soaring interest rates and rising equipment and labor costs. Reuters describes two “procured” projects that have been cancelled:
On Monday, Avangrid (AGR.N), a U.S. subsidiary of Spanish energy firm Iberdrola (IBE.MC), said it filed agreements with power companies in Connecticut to cancel power purchase agreements for Avangrid’s proposed Park City offshore wind project.
“One year ago, Avangrid was the first offshore wind developer in the United States to make public the unprecedented economic headwinds facing the industry,” Avangrid said in a release.
Those headwinds include “record inflation, supply chain disruptions, and sharp interest rate hikes, the aggregate impact of which rendered the Park City Wind project unfinanceable under its existing contracts,” Avangrid said.
Avangrid has said it planned to rebid the Park City project in future offshore wind solicitations.
Also over the past week, utility regulators in Massachusetts approved a proposal by SouthCoast Wind, another offshore wind developer, to pay local power companies a total of around $60 million to terminate contracts to provide about 1,200 MW of power.
Rich Ellenbogen described how the Offshore Wind Market is broken all over the world in an email. First he mentioned this Avangrid project buyout of their contractual obligations. He also pointed out that at a recent UK wind auction, there were no bidders because the maximum selling price for the electricity was not high enough to justify the investment. Their installation costs have risen by about 40% and the UK government did not factor that in to the allowable costs. He explains:
The article states that the wholesale price of electricity in the UK is £80 /Megawatt hour (MWh). With an exchange rate of $1.23 per pound-sterling, that equates to $98.40 per MWh. The article also states that they would need £60 per MWh to make the wind farms profitable, or $73.80 per MWh. However, according to this link, “the wholesale price for electricity in NY State in calendar year 2023 has increased from $24.57/MWh to $42.97/MWh over the last year.”, 47% lower than the wholesale cost in the UK and 72% lower than what the wind installers say that they need to be profitable.
If the Wind installers can get $73.80/MWh installing wind farms in the UK but they can only get $42.97/MWh installing Wind farms here, 42% less, while also having no ships to do the installation because of the Jones Act, where do you think that they will install the wind farms? This is a global market.
The other way to look at this is that the energy from Offshore Wind will cost 72% more than what the ratepayers of NY State are currently paying. This is not a good economic model for the NY State rate payers. 72% increases are well outside of what surveys have said the public will tolerate. Coupled with 15% increase in delivery costs from the utilities, the number of ratepayers, currently 1.2 million ratepayers that are $1.8 billion in arrears, will greatly increase making NY State even less affordable than it already is.
In New York, on October 12, 2023 the Public Service Commission turned down a request to address the same cost issues. Times Union writer Rick Karlin summarizes:
At issue was a request in June by ACE NY, as well as Empire Offshore Wind LLC, Beacon Wind LLC, and Sunrise Wind LLC, which are putting up the offshore wind tower farms.
All told, the request, which was in the form of a filing before the PSC, represented four offshore wind projects totaling 4.2 gigawatts of power, five land-based wind farms worth 7.5 gigawatts and 81 large solar arrays.
All of these projects are underway but not completed. They have already been selected and are under contract with the New York State Energy Research and Development Authority, or NYSERDA, to help New York transition to a clean power grid, as called for in the Climate Leadership and Community Protection Act, approved by the state Legislature and signed into law in 2019.
Developer response suggests that “a number of planned projects will now be canceled, and their developers will try to rebid for a higher price at a later date — which will lead to delays in ushering in an era of green energy in New York”. Karlin also quotes Fred Zalcman, director of the New York Offshore Wind Alliance: “Today’s PSC decision denying relief to the portfolio of contracted offshore wind projects puts these projects in serious jeopardy,”
Francis Menton did an overview of the status of offshore wind projects that summarizes all the issues confronting offshore wind development.
Renewable Costs
Francis Menton also did an overview of renewable costs.
Another article in the Telegraph also addresses green energy costs.
Weather and Climate
The September edition of Climate Fact Check debunks ten bogus climate claims from last month. There is a description of the analysis here.
As a meteorologist I find it frustrating that every extreme weather event is considered a reflection of “a “new normal” due to the effects of climate change”. As a pragmatic environmentalist, it is even more frustrating when a report comes out criticizing New York’s infrastructure resiliency to minimize the effects of extreme weather but fails to pick up the tradeoffs between resiliency infrastructure investments versus reducing greenhouse gas emissions that will supposedly prevent extreme weather. This article describes an example of this dynamic: the New York City Metropolitan Transit Authority (MTA) extreme weather resiliency plan.
I have followed the Climate Leadership & Community Protection Act (Climate Act) since it was first proposed, submitted comments on the Climate Act implementation plan, and have written over 350 articles about New York’s net-zero transition. I have devoted a lot of time to the Climate Act because I believe the ambitions for a zero-emissions economy embodied in the Climate Act outstrip available renewable technology such that the net-zero transition will do more harm than good by increasing costs unacceptably, threatening electric system reliability, and causing significant unintended environmental impacts. The opinions expressed in this post do not reflect the position of the New York State Reliability Council, the Extreme Weather Working Group, any of my previous employers or any other organization I have been associated with, these comments are mine alone.
Climate Act Background
The Climate Act established a New York “Net Zero” target (85% reduction and 15% offset of emissions) by 2050. It includes an interim 2030 reduction target of a 40% reduction by 2030 and a requirement that all electricity generated be “zero-emissions” by 2040. The Climate Action Council is responsible for preparing the Scoping Plan that outlines how to “achieve the State’s bold clean energy and climate agenda.” In brief, that plan is to electrify everything possible using zero-emissions electricity. The Integration Analysis prepared by the New York State Energy Research and Development Authority (NYSERDA) and its consultants quantifies the impact of the electrification strategies. That material was used to develop the Draft Scoping Plan. After a year-long review, the Scoping Plan recommendations were finalized at the end of 2022. In 2023 the Scoping Plan recommendations are supposed to be implemented through regulation and legislation.
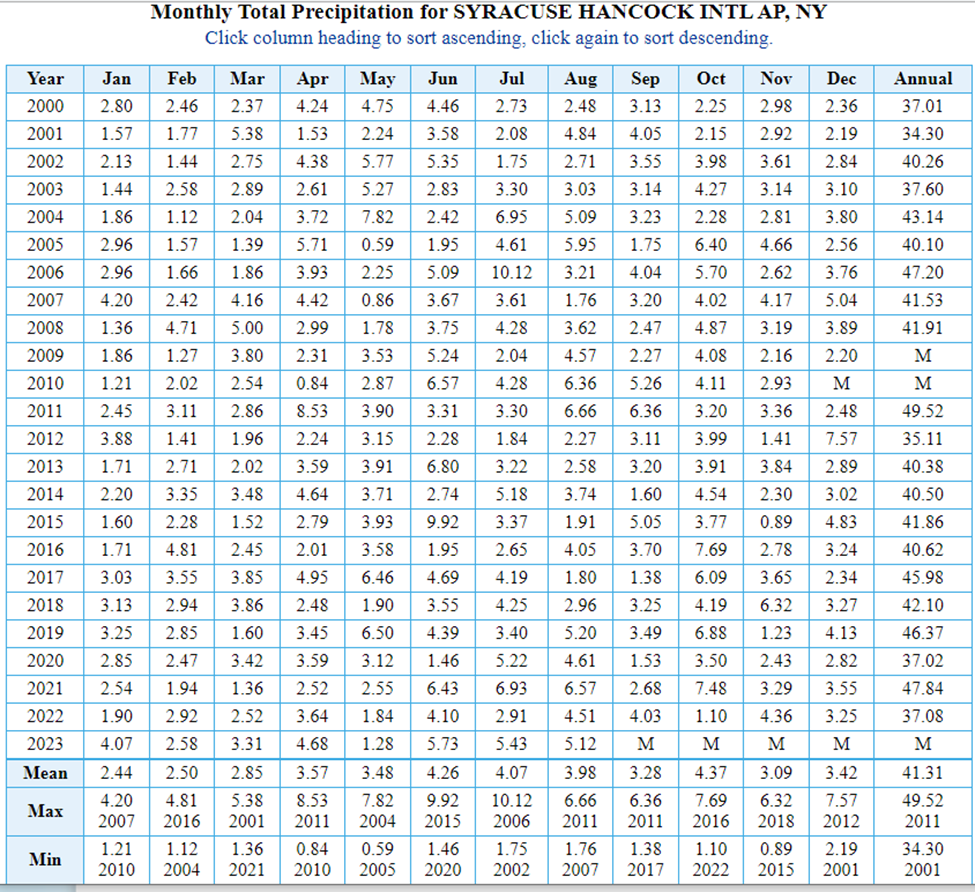
“Friday’s deluge dropped 8.05 inches of rain at JFK Airport, making it the wettest day on record, beating Hurricane Irene’s daily record set back on Aug. 14, 2011, the National Weather Service said. Widespread rain totals of 4 to 6 inches were New York City, Long Island and Hudson Valley, with locally higher amounts in excess of 7 inches of rain.
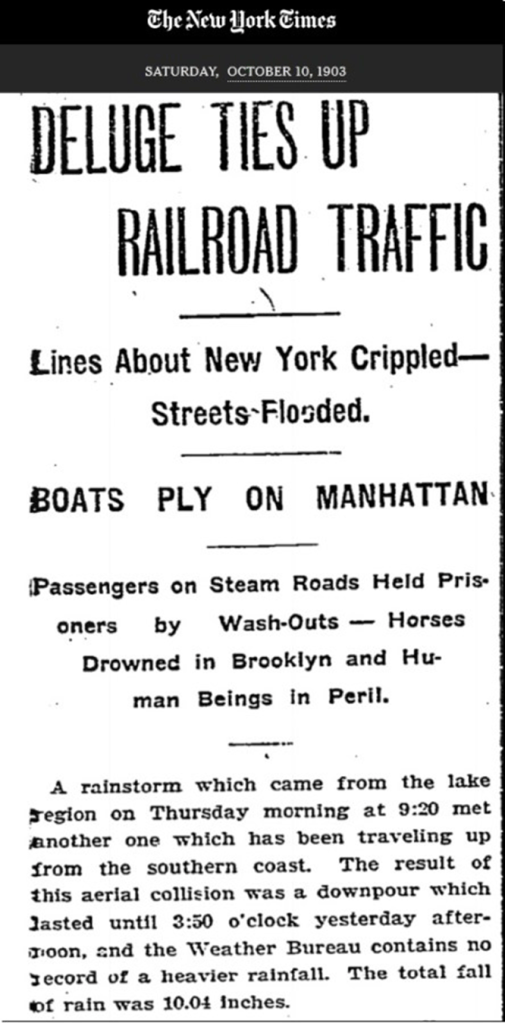
Tony Heller does a great job documenting historical accounts of extreme weather events. He found that on October 8, 1903 New York received 10.04 inches of rain.
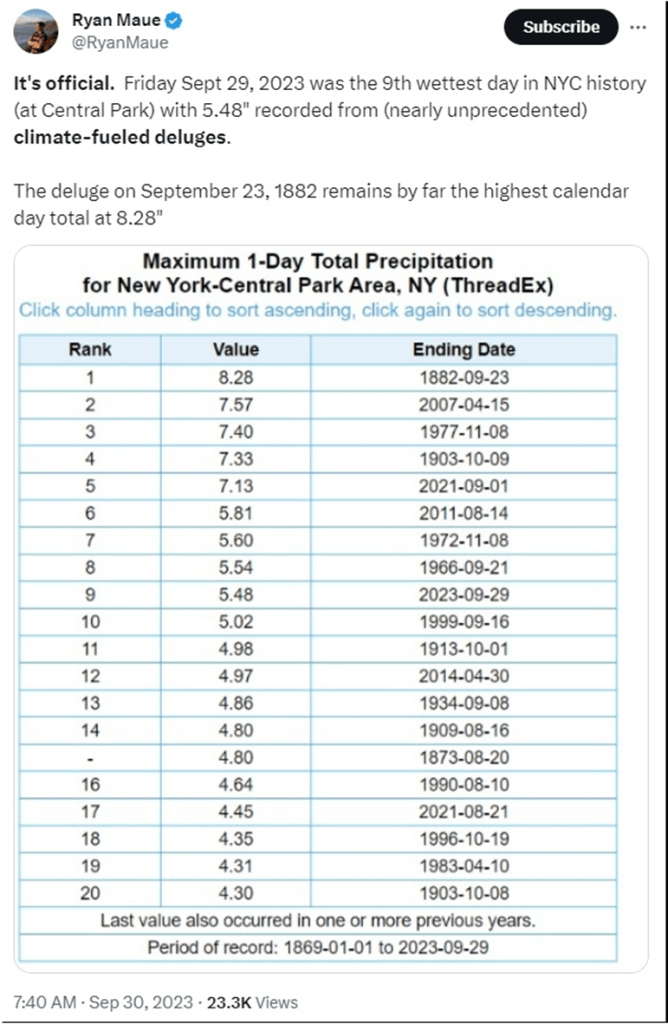
Ryan Maue checked out the Central Park precipitation data and found that on September 23, 1882 the site measured the highest daily value of 8.28” and that this recent event was the 9th wettest day at that site.
Nonetheless, it did not prevent the usual suspects, including Governor Hochul from blaming climate change: “This is unfortunately what we have to expect as the new normal”. She also described the storm as “Mother Nature at her most powerful.” “This was the kind of rain that was once unimaginable — we called them once-in-a- century storms,” Hochul said Saturday. “But this is the third time since I was sworn in two years ago, I’ve had a once-in-a-century storm.”
Of course, this storm will also be used as more justification by the same crowd to implement the Climate Act. Because it is generally accepted that climate change caused by GHG emissions did not kick in until after 1950, the higher historical precipitation in 1882 and 1903 conclusively falsify the Governor’s “new normal” and the idea that GHG emission reductions can prevent further similar storms.
MTA Climate Resilience Upgrades
Flooding caused major disruptions to New York’s subway system, according to the Metropolitan Transportation Agency. The flash flood caused “full or partial suspension of service on half the lines in the system, with MTA officials saying full service was restored by 8:30 p.m after 20 million gallons of water were pumped out of the subway”. On a personal note, the subway closures forced my grand-daughter to stay with a classmate in Manhattan rather than going home to Brooklyn that day.
A couple of days earlier, the MTA published a 20-year needs assessment report that said “Some 400 miles of subway tracks, half of Metro-North’s Hudson Line and several Long Island Rail Road stations are in dire need of upgrades to stave off flooding and other extreme weather exacerbated by climate change.” The Resilience Improvement weblink states:
Climate change is here—and we must prepare. Over the next two decades, climate change projections indicate that the New York region will experience more frequent and intense coastal storms, more than twice the current number of torrential rainfall events, and triple the current number of extreme heat days over 90 degrees. Meanwhile, sea levels will rise approximately 2.5 feet by the 2050s and almost 5 feet by the 2080s.
Our infrastructure was not built to withstand future climate conditions. We’ve made significant progress retrofitting, renovating, and rebuilding infrastructure in anticipation of future climate conditions, but climate change won’t wait for us to finish. For our systems to keep running as lifelines through the coming climate-induced crises, we must move faster.
To determine whether the Metropolitan Transportation Authority (MTA) – New York City Transit (Transit) identified potential damage to its system and developed plans to mitigate the effect of extreme weather conditions and flooding. We also determined whether the MTA tested/updated the plans and inspected and maintained the equipment to ensure they can be deployed when needed. Our audit covered the period from April 2009 to August 2022.
The key findings of the report include the following:
To date, the MTA has not implemented one of the most important recommendations of the 2009 Report – the development of the climate change adaptation master plan. Since Superstorm Sandy, Transit has assessed and identified areas of its system that are at risk of flooding from extreme weather events and developed and carried out capital projects to both correct damage caused by Superstorm Sandy and mitigate potential flooding conditions in the Transit system. Further:
Our review of a sample of 23 of 221 capital projects intended to correct or prevent damage found that projects were often incomplete in scope of work, not finished on time or within budget, or insufficiently documented. Just two of six critical stations that Transit indicated should have been made more watertight and resistant to potential flooding were completed in one project we reviewed. Another project was initiated to prevent flood water from entering 14 fan plants; however, only 11 fan plants were mitigated. Transit officials stated the three remaining fan plants were completed but did not provide documentation to support their statements. (Fan plants are facilities with large vent gratings and fans located atop shafts connected to the Transit tunnels.)
Transit did not sufficiently document inspections of individual pieces of equipment. Instead, it reported more broadly by subway stations or by rooms in off-site facilities that were inspected. In one instance, because not all rooms were inspected at a facility, we were able to determine that 51 of 72 pieces of equipment in our sample were not inspected between January 2021 and August 2022.
While Transit has developed winter, hurricane, rain, and extreme heat plans, we found that these plans were inconsistently activated, with no documentation explaining the rationale for decision making. In our sample of 18 weather events, plans were not activated for six events that included tropical storms, hurricanes, or coastal flooding.
I support the concept to identify and address potential flooding conditions. My problem with this report is that it does not recognize the differences between weather and climate, namely weather is going to cause flooding conditions whether or not climate change exacerbates the impacts. It seems that climate change must be included as part of the marketing to get support for the audit.
Discussion
Response to the 20-year plan included the concern by advocates that no costs were attached to the plans for the improvements that MTA says is necessary. For example:
“While the MTA’s needs assessment is thorough and shows that our transit system is in dire need of investment, it lacks dollar figures showing exactly how much money will be needed to fix the subways, buses, and commuter railroads,” wrote Rachael Fauss with the good government group Reinvent Albany in an email. “The needs of everyday riders must come first. In an environment of limited resources, it is essential that we prioritize capital projects based on objective measures of need, not politics, to repair the subways, buses and commuter railroads and ensure that they continue to best serve New Yorkers in this era of climate change.”
I think it is important to consider whether the net-zero transition GHG emission reduction measures in New York State will have any material effect on the extreme weather events that caused the problems observed during the latest flash flood. The answer to that question is no. As noted previously, the fact that there were days with greater rainfall before GHG emissions allegedly became the driver of observed global warming suggests that GHG emissions reductions would have to go to pre-industrial levels to just keep rainfall rates at the same level as 1882. That is clearly an ambitious target even if you believe that GHG concentrations are a driver of extreme weather and I don’t believe that. It gets worse. New York GHG emissions are less than one half of one percent of global emissions and global emissions have been increasing on average by more than one half of one percent per year since 1990. Even if GHG emissions in New York were to get to zero, that reduction will be supplanted by increases elsewhere in less than a year.
Conclusion
One of my pragmatic principles is Russel Schussler’s observation that “We can do almost anything we want, but we can’t do everything”. In this instance the costs of the Climate Act’s net-zero transition should be considered relative to the MTA plan. The upgrades necessary to prevent extreme rainfall events and storm surge from flooding New York’s subway system will be enormous but at the end of the day those investments would have a measurable effect. In order to get to net-zero, the costs will be an order of magnitude greater than “enormous” with no hope for a measurable effect on severe weather. I agree with Rachel Fauss: “it is essential that we prioritize capital projects based on objective measures of need, not politics”.
The disconnect between MTA, the media, and even Fauss in this example is frustrating. For example, Rachael Fauss noted that the investments are necessary “in this era of climate change” misses the point that climate is what you expect and weather is what you get. Climate change had very little effect on this event and certainly not enough to cause the storm or materially change its impacts. Ultimately, throwing away money on a pointless virtue-signaling net-zero transition will likely forestall the investments needed to maintain and strengthen the resiliency of the subway system. Reducing New York GHG emissions in a quest to minimize extreme weather issues in New York is not going to work and will be counter-productive for real solutions.
A recent article by Ed Reid prompted me to put together this post. Reid compared different Offshore Wind (OSW) developer estimates of the capacity factor of a couple of projects and found inconsistencies. This article compares his results with Climate Leadership & Community Protection Act (Climate Act) OSW projections. I also address energy storage implications associated with OSW.
I have followed the Climate Act since it was first proposed, submitted comments on the Climate Act implementation plan, and have written over 350 articles about New York’s net-zero transition. I have devoted a lot of time to the Climate Act because I believe the ambitions for a zero-emissions economy embodied in the Climate Act outstrip available renewable technology such that the net-zero transition will do more harm than good by increasing costs unacceptably, threatening electric system reliability, and causing significant unintended environmental impacts. The opinions expressed in this post do not reflect the position of the New York State Reliability Council, the Extreme Weather Working Group, any of my previous employers or any other organization I have been associated with, these comments are mine alone.
Climate Act Background
The Climate Act established a New York “Net Zero” target (85% reduction and 15% offset of emissions) by 2050. It includes an interim 2030 reduction target of a 40% reduction by 2030 and a requirement that all electricity generated be “zero-emissions” by 2040. The Climate Action Council is responsible for preparing the Scoping Plan that outlines how to “achieve the State’s bold clean energy and climate agenda.” In brief, that plan is to electrify everything possible using zero-emissions electricity. The Integration Analysis prepared by the New York State Energy Research and Development Authority (NYSERDA) and its consultants quantifies the impact of the electrification strategies. That material was used to develop the Draft Scoping Plan. After a year-long review, the Scoping Plan recommendations were finalized at the end of 2022. In 2023 the Scoping Plan recommendations are supposed to be implemented through regulation and legislation.
Off Shore Wind (OSW) is supposed to be a major renewable resource in the “zero-emissions” electric energy system. The Climate Act mandates 9,000 MW of Off Shore Wind (OSW) generating capacity by 2035. The Integration Analysis modeling used to develop the Scoping Plan projects OSW capacity at 6,200 MW by 2030, 9,096 MW by 2035 and reaches 14,364 MW in 2040. On the other hand, the New York Independent System Operator 2021-2040 System & Resource Outlook expects 5,036 MW in 2030 and 9,000 MW in 2035 with no additional development after that. By 2030 the Integration Analysis predicts that 14% of the electric energy (GWh) produced will come from OSW and the Resource Outlook predicts nearly as much (12%). This is an extraordinary build-out for a resource that is currently non-existent.
Capacity Factors
The capacity factor is a useful metric to understand and compare electric generation resources. The annual capacity factor equals the actual observed generation (MWh) divided by maximum possible generation (capacity (MW) times 8,760 hours. At sea the wind resource higher capacity factors are higher than onshore wind resources, primarily because there are no hills and vegetation to slow down wind. Supporters of OSW tout the higher capacity factors of this resource as a big benefit.
Ed Reid writing at The Right Insight describes issues with Offshore Wind (OSW) data used for claiming benefits. Reid described developer claims for two projects:
Orsted’s recently approved Ocean Wind 1 development, to be located off the New Jersey coast near Atlantic City and Ocean City, would consist of one hundred 11MW wind turbine generators, for a total capacity of 1,100 MW. This would suggest annual generation, at a 100% capacity factor, of 9,600 GWh. The International Energy Agency uses a capacity factor of 50% for offshore wind. We will use that figure here, since there is no offshore wind capacity factor data for the US East Coast. This suggests annual production of approximately 4,800 GWh for Ocean Wind 1.
……………………..
Dominion Energy’s proposed Coastal Virginia Offshore Wind (CVOW) development, to be located off the Virginia coast near Norfolk, would consist of one hundred seventy-six 15 MW wind turbine generators, for a total capacity of 2,600 MW. This would suggest annual generation, at a 100% capacity factor, of approximately 22,800 GWh, or approximately 11,400 GWh at a 50% capacity factor.
The US Energy Information Administration reports average US residential electricity consumption as 10,600 kWh per year. The developers describe the output of their projects in terms of the number of homes served. Reid estimates capacity factors for both projects using that information. Orsted projects that Ocean Wind 1 would serve 500,000 homes. Based on these numbers, Ocean wind would have to generate 5300 GWh per year, or a capacity factor of approximately 55%. Dominion projects that CVOW would serve 660,000 homes. Using the same approach, the annual capacity factor of the Dominium CVOW would be 30%. Thar is far lower than the IEA figure.
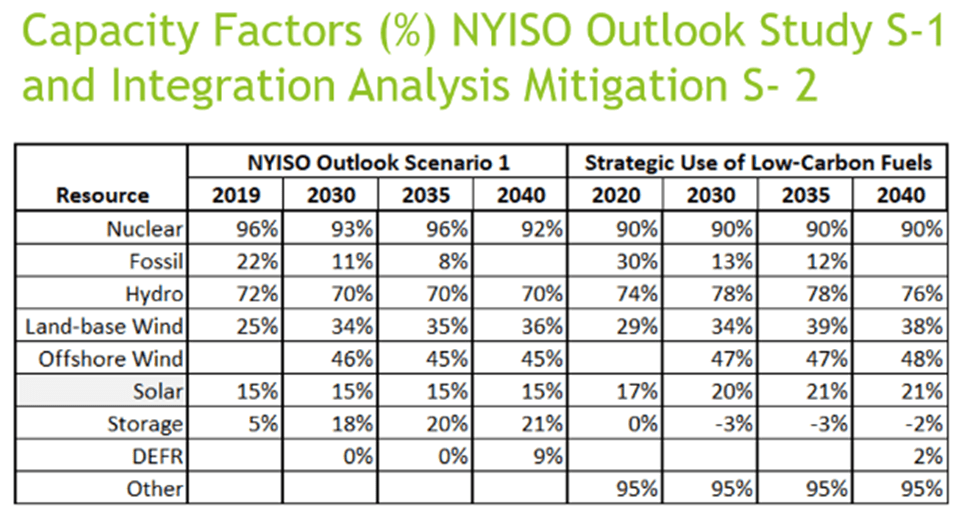
I compared the New York Independent System Operator (NYISO) 2021-2040 System & Resource Outlook modeling analysis with the Integration Analysis modeling and determined the capacity factors used. The following table lists the capacity factors for different generating resources including offshore wind. There is no question that OSW resources have higher capacity factors than onshore wind or solar. The NYISO annual projections are around 45% while the Integration Analysis projects slightly higher estimates no greater than 48% These estimates are closer to the International Energy Agency capacity factor of 50% than either Ocean 1 or CVOW. Note that the renewable resources capacity factors represent the best they can do but that the fossil capacity factor is low because, in part, they are displaced by wind and solar.
Estimates and Averages
Reid describes average estimates used for the OSW developer claims:
The estimates above are based on a number of averages: average wind resource; average capacity factor; average maintenance and repair allowances; and, average residential electricity consumption. The available wind resource varies on time scales from minutes to hours to days to seasons, as does residential energy consumption and demand. The use of averages loses a lot of the detail of the match between customer load and generator output.
He explains that intermittent generation from wind turbines shifts the resources used in the grid:
Since each of these industrial wind installations would be connected to a grid with a far larger customer base than the claimed number of residential customers served, above average output would be absorbed by other loads on the grids, displacing a portion of the output from some form(s) of conventional generation. Below average generator output would require support from some form(s) of conventional generation.
In my opinion, the intermittency of wind and solar projects should be addressed by the developer. As it stands now somebody else must provide supporting conventional generation or energy storage so wind and solar get a free ride. Reid explains the problem:
Arguably, fluctuations in generator output and customer load could also be compensated for by additions to and withdrawals from some type of energy storage capacity. However, there is no energy storage capacity included in either of the wind projects discussed above. The issue of storage can be deferred as long as there is sufficient excess conventional generating capacity available to compensate for the fluctuation of the output of the wind facilities and maintain a capacity reserve margin. However, as conventional generating capacity is retired due to age or regulation, and additional intermittent renewable generating capacity is added, addressing the issue of storage cannot be avoided.
Extremes
All issues related to the net-zero transition are more complicated than expected at first glance. In order to address this complexity, more explanation and analysis are required. For example, in this instance Reid wrote a short article addressing average fluctuating wind resources. He did not call out the extreme case when the wind resource is essentially zero for extended periods probably because it would have made the story too long. However, I think this is a critical consideration. Since the beginning of the Climate Act implementation process, lulls of renewable energy production, what I call the ultimate problem, has been a concern.
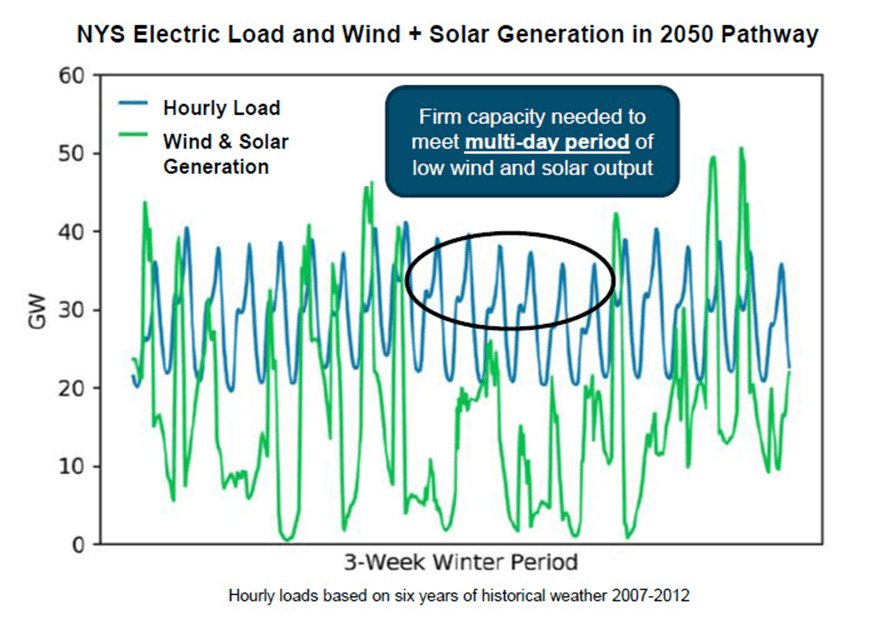
In their presentation to the Power Generation Advisory Panel on September 16, 2020 Energy + Environmental Economics (E3) noted that: “The need for dispatchable resources is most pronounced during winter periods of high demand for electrified heating and transportation and lower wind and solar output”. They also noted that: “As the share of intermittent resources like wind and solar grows substantially, some studies suggest that complementing with firm, zero emission resources, such as bioenergy, synthesized fuels such as hydrogen, hydropower, carbon capture and sequestration, and nuclear generation could provide a number of benefits.” Of particular interest is the graph of electric load and renewable generation because it shows that this problem may extend over multiple days.
Since the time of this presentation, the New York State Independent System Operator (NYISO), New York State Reliability Council, and Public Service Commission in the Order Initiating Process Regarding Zero Emissions Target in Case 15-E-0302 all have been considering the ramifications of this problem. The New York State Reliability Council Extreme Weather Working Group (EWWG) was established to “identify actions to preserve New York Control Area reliability for extreme weather events and other extreme
system conditions” and create a corresponding action plan to “evaluate the potential need for
new resource adequacy and transmission planning design rules for planning the system to meet
extreme weather and other extreme conditions.” Wind lulls are one of the extreme weather events being considered by the EWWG.
The EWWG looked at the observed correlation of the frequency and duration of low-wind episodes across the entire state, including the offshore wind development areas. This summer they finalized a report titled Off Shore Wind Data Review – NYSRC Preliminary Findings (“OSW Report”) that is relevant to this discussion. The OSW Report analysis was based on an NYISO analysis that made available 21 years of hourly wind data at seven wind development sites (Figure 1), extending from New Jersey to Rhode Island, prepared by its consultant DNV. DNV performed analysis of wind data translating meteorological data into detailed power profiles for each site including loss considerations. The report describes frequency analysis and interregional impacts.
Figure 1: Seven Wind Development Sites Analyzed
The OSW Report wind lull analysis is relevant to this discussion. The analysis defined wind lulls as periods of each hour of wind output of less than 5%-20%. For extended periods of 24 hours or longer, lulls occur about 30 times per year on average. Wind lulls of 48 hours or longer occur on average about seven times per year, and wind lulls of 72 hours or longer occur on average two times per year. About 70% of these wind lulls over the 21-year period occurred during the current peak load four-month summer period from June to September.
Of note, is the following finding:
Lastly an analysis was performed to identify the most persistent wind lull experienced in the 20-year wind data with net capacity factor less than 10% for the entire period across all seven wind sites. Analysis indicates wind lulls of up to 86 hours with an average energy output of approximately 5% net capacity factor occurring across all seven sites were observed in the DNV dataset (this compares to an average annual net capacity factor of approximately 45%). While data associated with longer periods than 21 years were not readily available it may be appropriate to characterize this as a 1 in 20 year extreme weather event.
Reid explained that compensating load can be provided by adjoining transmission operators. This report addresses this concern relative to the OSW resource:
NY relies on emergency assistance from neighboring regions to achieve reliable system design, thus continued availability of surplus power from these areas is an important consideration. Similar to NY, policy makers from PJM and New England are also moving forward with policies to install large scale wind power to address decarbonization and planned shutdown of thermal units, with proposals in each region also totaling tens of thousands of MW. As noted in Section 3.0, OSW off the coast of the state of New Jersey is targeted at 7.5 GW by 2035 increasing to 11.0 GW by 2040, and similarly OSW off the coast of Rhode Island/ Massachusetts is targeted at 8.0 GW by 2035. In total PJM member States have announced off shore wind targets totaling 24 GW by 2035, and 32.7 GW by 2040.
The OSW Report compares the output from all seven wind sites during an interregional wind lull event which occurred August 8, 2017 – August 13, 2017. Over that time period the following graph shows that the fraction of wind output from all the sites clearly correlates. The implication is that compensating load will not be available from adjoining transmission operator’s OSW resources in periods like this.
The OSW Report concludes:
It is noted reliability of the traditional interconnected power system design relies on diversity of forced outage rates and independence of outage events. Correlation of interregional wind lulls eliminates diversity of loss of power output events associated with OSW and alters this aspect of system design.
Interregional wind lulls simultaneously impacting tens of thousands of MWs of interregional OSW located in PJM, NY and NE could reduce reserve sharing and emergency assistance available for support from neighboring control areas significantly impacting operational reliability and resource adequacy.
The most important point of this article is that the OSW Report documents correlation of interregional wind lulls. I believe this problem extends to onshore and wind and solar resources. I have looked at enough New York onshore wind data to be certain that this correlation extends to all the onshore wind resources in New York and adjoining regions. When it comes to solar, cloudiness affecting New York State solar may not be as highly correlated with wind but at night every single solar facility will not be producing any power.
One of the challenges faced by the EWWG is trying to determine the worst-case renewable resource lull. NYISO has had DNV do a similar analysis for onshore wind and solar resources in New York using the same 21-year data set. Metrological experts on the EWWG have suggested using as long an input meteorological dataset as possible for an analysis to obtain a fuller understanding of range and return period of events.
Finally, there is one more complication. The meteorological conditions that lead to the lowest wind resource availability are associated with the coldest and hottest periods of the year. Those periods cause the peak annual loads. Wind and solar may provide power most of the time but when electricity is needed the most, they are expected to provide their lowest output. I think this is an enormous challenge to the proposed “zero-emissions” electric grid that can only be addressed by using nuclear power.
Energy Storage Implications
To always provide reliable electricity, energy storage is needed to cover periods when solar and wind are not available. Obviously, energy storage is needed to cover the daily variation of solar. Energy storage duration is not a large issue for this requirement. On the other hand, there is a seasonal variation of solar irradiance and resulting power output that needs a long-duration storage solution. There are no commercially available long-duration storage systems that can be expanded to meet New York’s requirements. There are also seasonal variations in wind resource availability that require a long duration system. The biggest problem is the worst-case renewable resource lull. The EWWG analysis found a one in twenty-year resource deficiency which is something that no long-duration storage system could ever effectively address.
There are serious energy storage technological hurdles that have not been resolved. Francis Menton writing at the Manhattan Contrarian summarizes energy storage problems in a recent post on a new British Royal Society report “Large-scale energy storage.” Menton explains (my emphasis added):
Having now put some time into studying this Report, I would characterize it as semi-competent. That is an enormous improvement over every other effort on this subject that I have seen from green energy advocates. But despite their promising start, the authors come nowhere near a sufficient showing that wind plus solar plus storage can make a viable and cost-effective electricity system. In the end, their quasi-religious commitment to a fossil-fuel-free future leads them to minimize and divert attention away from critical cost and feasibility issues. As a result, the Report, despite containing much valuable information, is actually useless for any public policy purpose.
As noted previously wind and solar resources will be at their lowest expected availability during periods when the electric load peaks. When heating and transportation is electrified this problem is exacerbated, peak loads will occur in the winter when solar resources are inherently low. The Scoping Plan glossed over this challenge and nothing since directly addresses the challenge. The rational thing to do would be to develop demonstration projects to prove feasibility and cost of the new technology needed before dismantling the current system. Francis Menton explains why this is necessary and how it could work.
Conclusion
Ed Reid explains how OSW developers describe the output of their projects in terms of the number of homes served. He found issues with their calculations. The developers ignore the support needed to provide electricity to the homes served when the wind isn’t blowing.
Supporters of OSW tout the higher capacity factors of this resource as a big benefit. Ed Reid describes deficiencies in their arguments using average data. This article explains that the problem becomes more acute when shorter-term extended renewable resource lulls are considered. OSW will perform better than other renewable resources during periods when the energy is not critically needed. The conundrum is that when it is needed most, OSW will fail at the same time New York’s onshore wind resources fail so an as yet commercially unavailable energy storage technology is needed. All indications are that this problem extends into the adjoining control areas so they cannot be counted on. Addressing this issue is a critical reliability consideration. If not addressed correctly then the grid will fail when needed most and people will freeze to death in the dark.
Note: For quite a while now I have put my Citizens Guide to the Climate Act article as the top post on the website because it summarizes the Climate Leadership & Community Protection Act (Climate Act). This post updates my current thoughts about the Climate Act and will replaces that post at the top of the list of articles on October 2, 2023
There is a new climate reality and it is passing New York by. New York decision makers are going to have to address the new reality that proves that the Hochul Administration’s Scoping Plan to implement the Climate Act will adversely affect affordability, reliability, and the environment. This post highlights articles by others that address my concerns.
I have followed the Climate Act since it was first proposed, submitted comments on the Climate Act implementation plan, and have written over 350 articles about New York’s net-zero transition. I have devoted a lot of time to the Climate Act because I believe the ambitions for a zero-emissions economy embodied in the Climate Act outstrip available renewable technology such that the net-zero transition will do more harm than good by increasing costs unacceptably, threatening electric system reliability, and have major unintended environmental impacts. The opinions expressed in this post do not reflect the position of any of my previous employers or any other company I have been associated with, these comments are mine alone.
Climate Act Background
The Climate Act established a New York “Net Zero” target (85% reduction and 15% offset of emissions) by 2050. It includes an interim 2030 reduction target of a 40% reduction by 2030 and a requirement that all electricity generated be “zero-emissions” by 2040. The Climate Action Council is responsible for preparing the Scoping Plan that outlines how to “achieve the State’s bold clean energy and climate agenda.” In brief, that plan is to electrify everything possible using zero-emissions electricity. The Integration Analysis prepared by the New York State Energy Research and Development Authority (NYSERDA) and its consultants quantifies the impact of the electrification strategies. That material was used to develop the Draft Scoping Plan. After a year-long review, the Scoping Plan recommendations were finalized at the end of 2022. In 2023 the Scoping Plan recommendations are supposed to be implemented through regulation and legislation.
Climate Science
In the past several weeks there have been multiple articles highlighting issues that call into question the rationale for the Climate Act and Climate Act net-zero transition. The rationale for the Climate Act is that there is an existential threat due to climate change. However, the Epoch Times reports that is not a universally held position:
There’s no climate emergency. And the alarmist messaging pushed by global elites is purely political. That’s what 1,609 scientists and informed professionals stated when they signed the Global Climate Intelligence Group’s “World Climate Declaration.”
The article gives a good overview of the World Climate Declaration. The declaration’s signatories include Nobel laureates, theoretical physicists, meteorologists, professors, and environmental scientists worldwide. The article quotes a few signatories who when asked by The Epoch Times why they signed the declaration stating that the “climate emergency” is a farce, they all stated a variation of “because it’s true.”
In my case, I signed the Declaration because I do not think we understand natural climate variability well enough to be able to detect the effect of a relatively small change to the atmosphere’s radiative budget caused by mankind’s greenhouse gas (GHG) emissions. There are so many poorly understood factors at play and the mathematical challenges of simulating the chaotic, non-linear processes are so immense that I think that claiming that Global Climate Models can simulate the atmosphere well enough to make major changes to the energy system of the world is absurd.
There is another important aspect. One of the key points made in the Declaration is that climate science is overly politicized:
“Climate science should be less political, while climate policies should be more scientific,” the declaration begins. “Scientists should openly address uncertainties and exaggerations in their predictions of global warming, while politicians should dispassionately count the real costs as well as the imagined benefits of their policy measures.”
It seems to me that every day there is another mass media story attributing any extreme weather event to climate change and insinuating that the “science” has unequivocally shown that there is a link to mankind’s GHG emissions has made the weather more extreme. The fact is that the latest research and the Intergovernmental Panel on Climate Change are finding that as Roger Pielke, Jr. explains the “projected climate futures have become radically less dire”. He argues that the consensus has accepted a large change in expected warming due to a doubling of GHG emissions — from 4oC to 2.5oC or less. Pielke notes that he has documented this trend for years and has “been talking about the incredible shift in expectations for the future” recently. Unfortunately he also notes: “Despite the growing recognition that our collective views of the future have changed quickly and dramatically, this change in perspective — a positive and encouraging one at that — has yet to feature in policy, media or scientific discussions of climate.” He concludes “That silence can’t last, as reality is persistent.”
Affordability
I think this is the one issue that might force political change to the Climate Act net-zero transition. A coalition of business organizations have called for a “reassessment” of how the Climate Act is being implemented highlighting current policies to determine “what is feasible, what is affordable and what is best for the future of the state.” In response, Department of Environmental Conservation Commissioner Basil Seggos told Capital Tonight that “the costs of inaction are much higher.” He goes on: “Listen, we know from two years of very intensive research that the cost of inaction on climate in New York far exceeds the cost of action by the tune of over $100 billion”. I disagree.
The Scoping Plan that documents this claim by Seggos has been described as “a true masterpiece in how to hide what is important under an avalanche of words designed to make people never want to read it”. No where is this more evident than in the tortuous documentation for this cost claim. I documented the issues with costs and benefits in my comments (social cost of carbon benefits, Scoping Plan benefits, and electric system costs). In brief, the Hochul Administration has never provided concise documentation that includes the costs, expected emission reductions and assumptions used for the control strategies included in the Integration Analysis documentation making it impossible to verify their assumptions and cost estimates.
The claim that the costs of inaction are more than the costs of action compares real costs to New Yorkers relative to societal benefits that can be charitably described as “biased high” or more appropriately “cherry picked” to maximize alleged benefits and, more importantly, do not directly offset consumer costs. The benefits claimed are also poorly documented, misleading and the largest benefit is dependent upon an incorrect application of the value of carbon. The plan claims $235 billion societal benefits for avoided greenhouse gas emissions. I estimate those benefits should only be $60 billion. The Scoping Plan gets the higher benefit by counting benefits multiple times. If I lost 10 pounds five years ago, I cannot say I lost 50 pounds but that is what the plan says. The cost benefit methodology was duplicitous because the cost comparisons were relative only to Climate Act requirements that did not include “already implemented” programs. For example, this approach excludes the costs to transition to electric vehicles because that was a requirement mandated before the Climate Act. I maintain that the total costs to transition to net-zero should be provided because that ultimately represents total consumer costs.
It is also frustrating that the State ignores that other jurisdictions are finding costs are an issue. In a recent article I noted that the Prime Minister of Great Britain, Rishi Sunak, said he would spare the public the “unacceptable costs” of net zero as he scaled back a string of flagship environmental policies. The fact is that every jurisdiction that has tried to transition away from fossil-fueled energy has seen a significant increase in consumer costs. For example, Net Zero Watch recently published a report that describes six ways renewables increase electricity bills that makes that inevitable. The article explains:
In order to reduce bills, a new generator generally has to force an old one to leave the electricity market — otherwise there are two sets of costs to cover. But with wind power, you can’t let anything leave the market, because one day there might be no wind.
The article goes on to explain that as well as adding excess capacity to the grid, renewables also have a series of other effects, each of which will push bills up further:
Renewables need subsidies, they cause inefficiency, they require new grid balancing services that need to be paid for; the list of all the different effects is surprisingly long. There is only one way a windfarm will push your power bills, and that’s upwards.
Reliability
Another flawed aspect of the Climate Act narrative is that a transition to a zero-emissions electric system is straight-forward and there are no significant technological challenges. Terry Etam summed up the issues evident in the German transition that will also occur in New York. In an article about the ramifications of the energy requirements for implementing artificial intelligence applications, he argued that the fossil-fired energy growth in the developing nations has been discouraged by the G7 nations. However, those nations are pushing back on anything that is not in their best interests. He writes:
The second big tectonic shift was on full display at the recent G20 summit. The African Union was admitted as a member, which was kind of a big deal, particularly for Africa, but also for the world in general. The addition acknowledges that other voices need to be on the world stage, a sense of humility the G7 has long lacked. The final communique issued at the end of the G20 summit included doses of common sense lacking from typical utterances of the G7: “We affirm that no country should have to choose between fighting poverty and fighting for the planet…It is also critical to account for the short-, medium-, and long-term impact of both the physical impact of climate change and transition policies, including on growth, inflation, and unemployment.”
Contrast that with the west’s bizarre self-lobotomization when it comes to energy, as best personified by the entity furthest along the rapid-transition path, Germany: the dwindling economic powerhouse is chained to a green freight train it insists is under control, has shut down nuclear power plants with no low-emissions baseload to replace it, and in a final stunning swan dive to the pavement, is orchestrating the installation of 500,000 heat pumps per year to the grid, which will be in most demand in cold weather and will perform worst in cold weather, and will add a potential 10 gigawatts of cold-weather demand at the very instant the grid is least able to afford it, and for which there is no supply available anyway. A German energy economic university think tank says the additional cold-weather demand could only be met by new gas-fired power plants, which are not being built. In sum: Germany has shuttered its cleanest, most reliable energy; it has or is trying to banish hydrocarbons and replace them with intermittent power; and finally, is hastening adoption of devices that will function very well in 80 percent of conditions when it doesn’t matter much but will fail in a spectacularly deadly way at the point in time when they are needed the very most, because heat pumps will be turned up to 11 at the very time the grid will be the most taxed. German engineering isn’t what it used to be.
In the last several years I have concluded that intermittency of wind and solar is the fatal flaw for that technology. The most important consideration is the need for energy storage. Francis Menton writing at the Manhattan Contrarian summarizes energy storage problems in a recent post on a new British Royal Society report “Large-scale energy storage.” This report suffers from the same problems afflicting the Climate Act Scoping Plan. Menton explains:
Having now put some time into studying this Report, I would characterize it as semi-competent. That is an enormous improvement over every other effort on this subject that I have seen from green energy advocates. But despite their promising start, the authors come nowhere near a sufficient showing that wind plus solar plus storage can make a viable and cost-effective electricity system. In the end, their quasi-religious commitment to a fossil-fuel-free future leads them to minimize and divert attention away from critical cost and feasibility issues. As a result, the Report, despite containing much valuable information, is actually useless for any public policy purpose.
I believe that the insurmountable problem with energy storage backup for wind and solar is worst-case extremes. The Royal Society report notes that “it would be prudent to add contingency against prolonged periods of very low supply”. This contingency is the theoretical dispatchable emissions-free resource that the Integration Analysis, New York State Independent System Operator, New York State Reliability Council, and Public Service Commission in the Order Initiating Process Regarding Zero Emissions Target in Case 15-E-0302 all acknowledge is necessary. Incredibly, the loudest voices on the Climate Action Council clung to the dogmatic position that no new technology like this resource was necessary and excluded any consideration of a backup plan to address the contingency that a not yet commercialized technology might never become commercially viable and affordable.
If New York State were to embrace nuclear energy, then there might be a chance to significantly reduce GHG emissions without affecting reliability. Instead, the Scoping Plan placeholder option for this resource is green hydrogen. Menton describes the hydrogen option proposal in the Royal Society report:
Since hydrogen is the one and only possible solution to the storage problem, the authors proceed to a lengthy consideration of what the future wind/solar/hydrogen electricity system will look like. There will be massive electrolyzers to get hydrogen from the sea. Salt deposits will be chemically dissolved to create vast underground caverns to store the hydrogen. Hydrogen will be transported to these vast caverns and stored there for years and decades, then transported to power plants to burn when needed. A fleet of power plants will burn the hydrogen when called upon to do so, although admittedly they may be idle most of the time, maybe even 90% of the time; but for a pinch, there must be sufficient thermal hydrogen-burning plants to supply the whole of peak demand when needed.
The Scoping Plan proposal is slightly different. It envisions that the electrolyzers will be powered by wind and solar to create so-called “green” hydrogen. Menton and I agree that the biggest unknown is the cost. He raises the following cost issues:
How about the new network of pipelines to transport the hydrogen all over the place?
How about the entire new fleet of thermal power plants, capable of burning 100% hydrogen, and sufficient to meet 100% of peak demand when it’s night and the wind isn’t blowing.
They use a 5% interest rate for capital costs. That’s too low by at least half — should be 10% or more.
And can they really build all the wind turbines and solar panels and electrolyzers they are talking about at the prices they are projecting?
It gets worse in New York. Ideologues on the Climate Action Council have taken the position that “zero-emissions” means no emissions of any kind. They propose to use the hydrogen in fuel cells rather than combustion turbines because combustion turbines would emit nitrogen oxides emissions. This adds another unproven “at the scale necessary” technology making it even less likely to succeed as well as adding another unknown cost. In addition, it ignores that there are emissions associated with the so-called zero-emissions technologies that they espouse. All they are advocating is moving the emissions elsewhere.
Environmental Impacts
I addressed the implications that the Scoping Plan only considers environmental impacts of fossil fueled energy in my Draft Scoping Plan Comments. The life-cycle and upstream emissions and impacts are addressed but no impacts of the proposed “zero-emissions” resources or other energy storage technology are considered. The fact is that there are significant environmental, economic, and social justice impacts associated with the production of those technologies. Furthermore, the most recent cumulative environmental impact analysis only considered a fraction of the total number of wind turbines and area covered by solar PV installations proposed in the Scoping Plan. As a result, the ecological impacts on the immense area of impacted land and water have not been adequately addressed.
One of the more frustrating aspects of the Hochul Administration’s Climate Act implementation is the lack of a plan. For example, consider utility-scale solar development. There are no responsible solar siting requirements in place so solar developers routinely exceed the Department of Agriculture and Markets guidelines for protection of prime farmlands. My solar development scorecard found that prime farmland comprises 21% of the project area of 18 approved utility-scale solar project permit applications which is double the Ag and Markets guideline.
I am particularly concerned about environmental impacts associated with Off Shore Wind (OSW). This will be a major renewable resource in the proposed Climate Act net-zero electric energy system. The Climate Act mandates 9,000 MW of Off Shore Wind (OSW) generating capacity by 2035. The Integration Analysis modeling used to develop the Scoping Plan projects OSW capacity at 6,200 MW by 2030, 9,096 MW by 2035 and reaches 14,364 MW in 2040. I summarized several OSW issues in a recent article that highlighted an article by Craig Rucker titled Offshore Wind Power Isn’t ‘Clean and Green,’ and It Doesn’t Cut CO2 Emissions. He explains:
A single 12 MW (megawatts) offshore wind turbine is taller than the Washington Monument, weighs around 4,000 tons, and requires mining and processing millions of tons of iron, copper, aluminum, rare earths and other ores, with much of the work done in Africa and China using fossil fuels and near slave labor.
Relying on wind just to provide electricity to power New York state on a hot summer day would require 30,000 megawatts. That means 2,500 Haliade-X 12 MW offshore turbines and all the materials that go into them. Powering the entire U.S. would require a 100 times more than that.
These numbers are huge, but the situation is actually much worse.
This is because offshore turbines generate less than 40% of their “rated capacity.” Why? Because often there’s no wind at all for hours or days at a time. This requires a lot of extra capacity, which means a lot more windmills will have to be erected to charge millions of huge batteries, to ensure stable, reliable electricity supplies.
Once constructed, those turbines would hardly be earth or human friendly, either. They would severely impact aviation, shipping, fishing, submarines, and whales. They are hardly benign power sources.
The environmental impacts on whales of the OSW resources necessary to meet the net-zero transition are especially alarming. Earlier this year I described the Citizens Campaign for the Environment virtual forum entitled Whale Tales and Whale Facts. The sponsors wanted the public to hear the story that there was no evidence that site survey work was the cause of recent whale deaths. I concluded that the ultimate problem with the forum was that they ignored the fact that construction noises will be substantially different than the ongoing site surveys and will probably be much more extensive when the massive planned construction starts. The virtual forum noted a lack of funding for continued monitoring necessary to address the many concerns with massive offshore wind development to allay the concerns of the public. Since then, the Save Right Whales Coalition (SRWC) has found issues with the incidental harassment of whales associated with the noise levels associated sonar surveys done in conjunction with OSW development. I am very disappointed that the Hochul Administration is not investing in an adequate monitoring program that confirms that whales are not being harmed.
Conclusion
This article was intended to summarize my current concerns about the impacts of the Climate Act transition on affordability, reliability, and the environment. There is a growing realization that the alleged problem of global warming is not as big a threat as commonly assumed. Combined with the fact that New York GHG emissions are less than one half of one percent of global emissions and global emissions have been increasing on average by more than one half of one percent per year since 1990 the rationale for doing anything is weak. It may not mean that we should not do something, but clearly we have time to address the affordability, reliability and environmental impact issues.
The Scoping Plan has not provided comprehensive and transparent cost estimates so New Yorkers have no idea what this will cost. I explained why the Hochul Administration claim that the costs of inaction are more than the costs of action is misleading and inaccurate. I believe that all New Yorkers should let it be known that they need to know the expected costs so they can determine if they support the transition.
When the energy system becomes all-electric the reliability of the electric system will be even more critical than today. The State plan is to proceed as if there are no implementation issues. The rational thing to do would be to develop demonstration projects to prove feasibility and cost of the new technology needed before dismantling the current system. Francis Menton explains why this is necessary and how it could work. There is no sign that is being considered.
It is particularly galling that organizations who claim to be in favor of a better environment have failed to support comprehensive cumulative environmental impact assessment and on-going impact monitoring assessment to potential impacts from wind, solar, and energy storage development on the scale necessary for the net-zero transition. Maybe they don’t want to know that the concerns are real.
Mark Twain said: “It is easier to fool someone than it is to tell them they have been fooled.” The politicians who support the Climate Act net-zero transition have been fooled into thinking it is affordable, will not affect reliability, and benefits the environment. Unfortunately, it is very difficult to slow down, much less stop the unfolding train wreck of these policies. I encourage readers to keep asking for a full cost accounting of all the proposed programs as the most obvious concern.
A recent Siena College poll found that respondents thought that the cost of living in New York is the top issue for Governor Hochul and the Legislature to address and that threats to the state’s environments was a primary concern for only 4% of the respondents. This post argues that implementation of New York’s Climate Leadership & Community Protection Act (Climate Act) is inconsistent with the concerns expressed in the poll.
I have followed the Climate Act since it was first proposed, submitted comments on the Climate Act implementation plan, and have written over 350 articles about New York’s net-zero transition. I have devoted a lot of time to the Climate Act because I believe the ambitions for a zero-emissions economy embodied in the Climate Act outstrip available renewable technology such that the net-zero transition will do more harm than good by increasing costs unacceptably, threatening electric system reliability, and have major unintended environmental impacts. The opinions expressed in this post do not reflect the position of any of my previous employers or any other company I have been associated with, these comments are mine alone.
Climate Act Background
The Climate Act established a New York “Net Zero” target (85% reduction and 15% offset of emissions) by 2050. It includes an interim 2030 reduction target of a 40% reduction by 2030 and a requirement that all electricity generated be “zero-emissions” by 2040. The Climate Action Council is responsible for preparing the Scoping Plan that outlines how to “achieve the State’s bold clean energy and climate agenda.” In brief, that plan is to electrify everything possible using zero-emissions electricity. The Integration Analysis prepared by the New York State Energy Research and Development Authority (NYSERDA) and its consultants quantifies the impact of the electrification strategies. That material was used to develop the Draft Scoping Plan. After a year-long review, the Scoping Plan recommendations were finalized at the end of 2022. In 2023 the Scoping Plan recommendations are supposed to be implemented through regulation and legislation.
Siena College Poll
According to the press release for a recent Siena College Poll Conducted by the Siena College Research Institute:
More than eight in ten voters say that the cost of living in New York is a major problem – including at least 80% of Democrats, Republicans and independents – and 27%, a plurality, say it is the most important issue that the Governor and Legislature should be working on now. Crime, the recent influx of migrants and the availability of affordable housing are the next three most important issues for New Yorkers. Fifty-seven percent say the quality of life in the state is getting worse, while 27% say it’s staying the same and 14% say it’s getting better, according to a new Siena College poll of registered New York State voters released today.
The poll of 804 New York registered voters was conducted September 10 – 13, 2023. I spent some time looking at the poll results and think that there are ramifications of this poll on Climate Act implementation. Consistent with my personal beliefs, responses to questions about the direction of the state, the fiscal condition of the state, and quality of life were all negative as shown below.
The response to the question “Is New York State on the right track, or is it headed in the wrong direction?” yielded the following results:
Right track 35%
Wrong direction 52%
Don’t know/No opinion 13%
The question “How would you describe the fiscal condition of New York State right now? Would you describe it as excellent, good, fair, or poor?” generated he following:
Excellent 6%
Good 20%
Total Positive 26%
Fair 32%
Poor 27%
Total Negative 69%
Don’t know/No opinion 5%
The quality-of-life question, “As you consider all aspects of living in New York State, do you think the quality of life in the state is getting better, staying the same, or getting worse?” provided the following responses:
Getting better 14%
Staying the same 27%
Getting worse 57%
Vol: Combination (Better and worse) 1%
Don’t know/Refused 2%
In addition to the press release highlighted results, questions related to issues confronting New York were included. The poll asked respondents whether seven issues were “a major problem for New York State, a minor problem for New York State, or not really a problem for New York State.” The responses ranked by percentage that thought it was a major problem and including the question number follow
Q27: Cost of living in New York
Major problem 83%
Minor problem 12%
Not really a problem 4%
Don’t know/Refused 0%
Q25: The availability of affordable housing
Major problem 77%
Minor problem 15%
Not really a problem 6%
Don’t know/Refused 1%
Q23: Crime
Major problem 75%
Minor problem 20%
Not really a problem 6%
Don’t know/Refused 2%
Q24: The recent influx of migrants
Major problem 62%
Minor problem 22%
Not really a problem 14%
Don’t know/Refused 2%
Q28: Access to quality, affordable health care
Major problem 52%
Minor problem 28%
Not really a problem 16%
Don’t know/Refused 4%
Q26: Threats to the state’s environment
Major problem 44%
Minor problem 34%
Not really a problem 15%
Don’t know/Refused 6%
Q29: New Yorkers choosing to leave the state for other parts of the country
Major problem 38%
Minor problem 25%
Not really a problem 33%
Don’t know/Refused 4%
The final question in the poll asked which of these issues “is the single most important issue that the Governor and Legislature should be working on now?”. The ranked order results:
The cost of living in New York 27%
Crime 19%
The recent influx of migrants 18%
Affordable housing 17%
Having access to health care 8%
Threats to the environment 4%
New Yorkers leaving the state 4%
Something else 2%
Don’t know/Refused 1%
With respect to the Climate Act there are two notable results. The Climate Act narrative is that there is an existential threat to society due to climate change. The question concerning threats to the state’s environment found that only 44% agreed that environmental threats was a major problem. That 49% thought that threats to the state’s environment were either a minor problem or not really a problem is inconsistent with the “existential” threat narrative. Furthermore, only 4% of respondents thought this was the most important issue for the Governor and Legislature to consider.
The Hochul Administration has not provided clear and transparent costs to ratepayers for expected energy costs nor the costs of electrification of homes and transportation. All my analyses suggest that the costs to achieve the Climate Act mandates will be extraordinary and there is no question that they will add to the cost of living. The only issue nearly all respondents responded to was the cost of living in New York and 83% of respondents thought this was a major issue. This was also the highest ranked of the most important issues questions.
Discussion
There is no question that Climate Act implementation will add to the cost of living in New York. I recently described expected ratepayer costs due to the New York Climate Act. James Hanley explained: that multiple offshore wind projects that are not even built yet have asked the state’s Public Service Commission (PSC) to renegotiate their strike prices which will add to costs. Colin Kinniburgh wrote an article that notes that the renewable energy developers are not in agreement that bailing out struggling projects is appropriate.
In other jurisdictions that are further down the net-zero transition there are concerns. In the Climate Act, section 16 of § 75-0103, there is a mandate to consider efforts at other jurisdictions: “The council shall identify existing climate change mitigation and adaptation efforts at the federal, state, and local levels and may make recommendations regarding how such policies may improve the state’s efforts.” Although not expressly noted, I believe that this should extend to other jurisdictions wherever they are.
The Prime Minister of Great Britain, Rishi Sunak, recently said he would spare the public the “unacceptable costs” of net zero as he scaled back a string of flagship environmental policies. A summary of articles about this new position suggests that New York Climate Act implementation plans should pay attention to the lessons learned in Great Britain. A few highlights follow,
The Prime Minister warned that voters would revolt against making the UK a net zero carbon emitter by 2050 unless politicians were more honest and “realistic” about the costs involved.
Mr Sunak delayed the ban on new petrol car sales from 2030 to 2035, pushed back the ban on new oil boiler sales from 2026 to 2035, and increased heat pump grants to £7,500.
An editorial in the The Daily Telegraph, 21 September 2023 notes that “Market forces and scientific advancement should create a greener world. We won’t get there by impoverishing Britain and alienating voters”.
Those disappointed by Rishi Sunak’s sensible decision to delay the deadlines that set the pace of the British economy’s transition to net zero should not blame the prime minister. It was Boris Johnson, playing as statesman as the United Kingdom prepared to host the Cop26 climate summit, who rushed forward by a decade the ban on new petrol and diesel vehicles. It was Theresa May, in the final weeks of her premiership, who led the desultory 90 minutes of parliamentary debate that waved a legally binding 2050 net zero target onto the statute book. Both decisions were symptomatic of a political culture that has persistently failed to reckon with the true costs of a policy that will fundamentally reshape the Britain’s economic landscape.
Those articles provide a backdrop to an essay by Ben Pile that calls the entire Great Britain transition into question. The essay is a worthwhile read. He describes six failures of green policy:
“No politician has any clue how to realize Net Zero targets.” This extends to New York because there is no implementation plan just a scoping plan outline. The failure to include details ensures that the plans will fail.
“The green lobby has LONG promised lower prices and greater energy security but has failed to deliver.” As noted above the New York renewable lobbyists are asking for money before projects even break ground. Electric reliability issues have been ignored to date by the Climate Action Council.
“Behind the scenes, the failure of both global and national climate policy has been known for a long time — since the Paris Agreement (PA) at the latest.” New York GHG emissions are less than one half of one percent of global emissions and global emissions have been increasing on average by more than one half of one percent per year since 1990. Why is there any urgency in New York?
“Despite claims that other countries are steaming ahead with boiler bans, car bans, heat pumps, and championing Net Zero policies, especially in Europe, they are in fact creating deep schisms between and within EU member states”. We are starting to see this occur in the United States.
“Environmental, Social, and Governance is failing.” Pile explains that investing using these principles does not provide adequate returns.
“ Ukraine, Russia, and the realignment of geopolitics.” Pile explains that “Who really believes that Western diplomats now have any chance of bringing Russia, China, and India into the Net Zero suicide pact? “
Pile concludes:
Sunak could not have done less to correct this mess. But what he has done is a good thing. And it includes setting a trap for the eco-catastrophists. The more they howl and wail, the more they will expose their utter contempt for ordinary people. It is not in Sunak’s gift, even if he wanted it, to reverse the entire sorry policy agenda. Too much stands in his way. But every scream and tantrum from the blobbers will bring that possibility closer to him or a successor. Because no person with a functioning brain believes that banning the boiler earlier, rather than later, is a good thing. And so the blobbers are set to out themselves, for the duration of this controversy, as brainless ideological zombies. Long may it continue.
Conclusion
The Climate Act narrative is that climate change impacts are pervasive and catastrophic, the primary way to deal with them is not through practical adaptation measures but through policies that reduce greenhouse gas emissions, and the emission reduction strategies will be cheaper because wind and solar are “free”. I believe that all those beliefs are flawed but have been discouraged because it seems that the media pushes the narrative so much that there is little hope that the net zero transition will be slowed down or stopped. However, the experience in Great Britain clearly shows that the costs of the net-zero transition are enormous there and will be here too.
The Siena College Research Institute poll showed that despite the relentless climate threat propaganda, the public does not agree that there is an existential threat to society due to climate change. Most of the respondents to the poll thought that threats to the state’s environment were either a minor problem or not really a problem. Only 4% of respondents thought environmental threats was the most important issue for the Governor and Legislature to consider. Those results contradict the Climate Act existential threat narrative.
The only issue nearly all respondents responded to was the cost of living in New York and the highest percentage of respondents thought this was a major issue. This was also the highest ranked of the most important issues questions. It is obvious from the situation in Great Britain that renewable energy costs will increase the cost of living. This should make all New York politicians stop to think.
It is not unfair to ask the Hochul Administration to define what is unaffordable, what reliability risks are too great, and which environmental impacts are unacceptable. This poll offers some hope that if the potential costs are made clear that the politicians will consider pausing implementation until the costs are described completely, the reliability risks addressed, and a cumulative environmental impact assessment of the impacts of all the wind and solar developments that are estimated to be needed by the Scoping Plan is completed.
I have been following the Climate Act since it was first proposed, submitted comments on the Climate Act implementation plan, and have written over 350 articles about New York’s net-zero transition. I have devoted a lot of time to the Climate Act because I believe the ambitions for a zero-emissions economy embodied in the Climate Act outstrip available renewable technology such that the net-zero transition will do more harm than good. The opinions expressed in this post do not reflect the position of any of my previous employers or any other company I have been associated with, these comments are mine alone.
Climate Act Background
The Climate Act established a New York “Net Zero” target (85% reduction and 15% offset of emissions) by 2050. It includes an interim 2030 reduction target of a 40% reduction by 2030 and a requirement that all electricity generated be “zero-emissions” by 2040. The Climate Action Council is responsible for preparing the Scoping Plan that outlines how to “achieve the State’s bold clean energy and climate agenda.” In brief, that plan is to electrify everything possible using zero-emissions electricity. The Integration Analysis prepared by the New York State Energy Research and Development Authority (NYSERDA) and its consultants quantifies the impact of the electrification strategies. That material was used to develop the Draft Scoping Plan. After a year-long review, the Scoping Plan recommendations were finalized at the end of 2022. In 2023 the Scoping Plan recommendations are supposed to be implemented through regulation and legislation.
Consider the influence of climate change in isolation without any suggestion that climate change might not be the dominant driver of the impacts described;
Ignore or downplay practical actions that can counter the impact of climate change;
Focus the discussion and graphics on metrics that will generate the most eye-popping numbers; and
Choose the timescale for the analysis to magnify the impacts
In another article Kip Hansen explained that there are climate news organizations that provide local newspaper and TV stations with propaganda talking points and articles. He explains:
I know that that sounds like a “conspiracy theory”… but it is not a conspiracy theory if it is true and if those involved in the act of conspiring together not only do so openly but proudly publicize their actions.
The lesson today comes from an email I received from Covering Climate Now which characterizes itself this way: “CCNow collaborates with journalists and newsrooms to produce more informed and urgent climate stories, to make climate a part of every beat in the newsroom — from politics and weather to business and culture” and when they say “urgent” climate stories, they mean the more alarming and frightening, the better.
The farming article described the trial and tribulations of hay farming. Lisa Cohen writes:
But as we come to the end of the wettest July on record, “make hay while the sun shines” has been shifting from self-evident axiom to rueful irony. Yes, you have to make hay while you can. But also you need sunshine to make hay.
Here’s how it works. It takes at least two sunny days to complete the cycle: mow, dry, rake, bale. Much of that time is waiting for the sun to do its work. (The hay must dry completely, because moisture can breed heat-producing bacteria deep inside a bale — which might then spontaneously combust and burn down a barn.) In theory, if Adam mowed a field on a Tuesday morning, he could expect to bale it late Wednesday afternoon.
In a good year — what we used to call a normal year — Adam would have extended stretches of sunny days that went like this: Mow in the morning, then unload wagons piled with bales from fields mowed two days before, then, in the afternoon, rake and finally bale the field he mowed yesterday.
In 2019 an acquaintance made a similar claim about climate change and haying. I analyzed a Hay Harvest Climate Trend and concluded that climate numerical analysis results are likely ambiguous, picking a climatic trend out of weather records is not simple, and, most importantly, any statistically significant trends are likely smaller than the observed inter-annual variation. As a result, anecdotal claims of observed changes of weather parameters due to climate change are likely biased and unsubstantiated.
My hay trend data analysis showed ambiguous results. It suggested that there is conflicting support for a climate-change induced problem with hay harvesting in August and September. The New York site at Mohonk House data indicate a statistically significant trend in more days suitable for harvesting hay whereas another observation site in Ithaca data indicate a trend towards less days suitable for harvesting hay but the trend is insignificant. At both stations there is a negative statistically significant trend in the number of growing degree days. Depending upon your intent, statistics can “prove” an argument that there is a problem or there isn’t a climate change problem. This work supports my belief that hay harvesting variation is caused by the vagaries of weather not climate change.
Poison ivy is having a banner year in Central New York, climbing up trees and creeping into yards with greater vigor than ever.
“I’ve been in this business for almost 30-plus years and I’ve not seen it this bad,” said Dave Oakley, groundcrews supervisor for TJ’s Lawns Plus in Cicero.
Many landscapers and master gardeners we spoke to, from Watertown to Ithaca, Baldwinsville to Chittenango, report similar observations: poison ivy’s growth this season has been explosive.
So why is this year different? Doug Beyel, owner of Chittenango Landscape, blames last spring’s drought, which was followed by plenty of rain and warm temperatures.
“When you get a heat wave, most plants will go dormant or die,” Beyel said. “If they don’t die, as soon as they get the moisture they need to survive, they’ll explode and push out a ton of growth, and that’s exactly what happened. Plants just took off.”
The following table shows that May was dry but that the last three months were wet. It is not surprising then that the poison ivy “explosive” growth was noticeable.
The article could have been content to show that this was a good growing year for everything that survived the drought including poison ivy. The article does a good job describing the plant, its growing habits, why it causes problems, and how to deal with it. Apparently, that information was not good enough because the author also blamed climate change for the poison ivy problem this year.
Consider the claims relative to Brown’s climate change narrative techniques. For example, one technique considers the influence of climate change in isolation without any suggestion that climate change might not be the dominant driver of the impacts described. In this instance the following claim makes no attempt to determine if this summer’s moisture pattern was unusual or part of a trend.
Climate change is fueling the growth of many plants, especially poison ivy, which grows larger, faster, and even more potent.
The article already explained that this year’s weather was the primary cause of the plant growth pattern. The absence of any context about climate relative to weather makes the claim that climate change had any effect whatsoever entirely without basis.
It gets worse because Featherstone invokes the threat of GHG emissions not only affecting the climate but also the growth of poison ivy.
There’s another factor that’s fueling the growth of many plants, especially poison ivy: climate change. We’re pumping ever more carbon dioxide, a key component in photosynthesis, into the atmosphere.
Because poison ivy doesn’t have branches, stems, or a trunk to support, it can channel all that extra energy into “growing larger, faster,” said Kim Adams, extension biologist for the State University of New York College of Environmental Science and Forestry.
Adams citeda 2006 study from scientists at Duke University showing that poison ivy “benefitted hugely” from increased carbon dioxide levels, more than doubling in biomass (149%) compared to plants grown under ambient conditions.
A quick check on the 2006 study shows that the authors also followed the climate threat narrative playbook. In the 6-year study at the Duke University Free-Air CO2 Enrichment (FACE) experiment, the study evaluated the impacts of elevated atmospheric CO2 on poison ivy growth. However, they increased the CO2 level (200 ppm above the ambient level of ≈370 ppm) to levels unrepresentative of current conditions. They chose a timescale for the analysis to magnify the impacts by using what they claimed represented the predicted global concentration in 2050. In order to do that they had to use an unrealistic estimate of future emissions. I believe these numbers are more representative of global concentration in 2100 or later.
The article goes on to quote Kim Adams, extension biologist for the State University of New York College of Environmental Science and Forestry, who notes that the article claims that urushiol production was increased. Not mentioned was that the article said urushiol may “may increase under elevated CO2” when grown in “low resource levels and/or in competitive environments”. I think the following is an example of focusing the discussion on metrics that will generate the most eye-popping numbers”:
What’s worse, the turbo-charged poison ivy vines were also more toxic to humans. “The chemical that we’re allergic to, urushiol”—the compound in poison ivy sap that causes itchy blisters in 85% of the population—”was more effective,” Adams said.
I sensed that there were issues with some of these statements so I asked a friend and colleague to review this text to see if I was correct. She asked a subject matter expert for his thoughts. He scanned the article and picked up on the poison ivy claims. He agreed that “in the Duke Forest FACTS site (Free-Air CO2 enrichments study), poison ivy was apparently the biggest “winner” when it came to response to CO2 enrichment.” However, he also stated that the Duke researchers acted consistent with Patrick Brown’s characterization because they always had a “gloom and doom” agenda and consistently promoted those results above all else.
His biggest concern was a fundamental problem with the study design. The Duke researchers tried to say that, after 5 or 6 years of CO2 exposure, the pine response flatlined (which is true) indicating that these ecosystems will quickly acclimate to higher CO2 (which is not true). The design flaw was “In the next to last year of study, the entire stand around the FACTS site was thinned because it had reached crown closure and competition (light, nutrients, water) was resulting in a decline in growth rate – a very normal occurrence for a 15-yr-old loblolly pine stand which is why it was thinned – to reallocate resource to the best trees and increase growth rate in these trees.” He explained that:
In wildlife biology they talk about carrying capacity (k) as the number of animals a site will maintain; the same is true for carbon – a site will only hold a finite amount of C (we can alter that via management – e.g., fertilization – but it remains a finite number). So, what had happened at the Duke site is they didn’t consider this in the study. In itself, that would have been fine; however, to conclude that the tress had acclimated to the high CO2 was inaccurate.
When I pointed this out at a meeting where these data were presented, I was told I didn’t know what I was talking about. I first told them, that I was probably one of only a few at the meeting with an actual degree and experience in forestry management. Then told them to back up their conclusion and prove me wrong – thin the study, leave the CO2 on, and see if the E/A response doesn’t return; they never did.
In my opinion, those revelations discount the probability that the poison ivy claims are as acute and pervasive as claimed in the 2006 study. It gets worse because Adams suggests that there could be a short-term effect. I believe the following paragraph is wild conjecture:
Earlier this summer, wildfires in Canada turned skies over Central New York a hazy, apocalyptic orange. Adams speculates that the smoky air, laden with extra carbon dioxide from the fires, might have given poison ivy vines an additional boost.
The National Oceanic and Atmospheric Administration website shows CO2 trends. The following graph shows the large seasonal variation in Hawaii. I could not find any short-term ambient concentration data for New York. I imagine it would show an even more pronounced seasonal fluctuation because there is little local production in the winter. Frankly I would be surprised if local CO2 concentrations would have shown any effect of the wildfires because the local concentrations are dominated by local vegetation. The smoke showed up so markedly because the baseline was low. Even if I am wrong, wouldn’t the smoke have reduced the sunlight reducing photosynthesis? Ultimately, in the absence of local data showing a substantive increase in CO2 during the wildfire smoke episodes, there is no evidence supporting the claim the poison ivy growth was given a boost.
Conclusion
I have two issues with these articles. In the first place both authors do not understand the difference between weather and climate. In simple terms, climate is what you expect and weather is what you get. Any effect of climate change on hay harvesting weather or poison ivy growth this year was unlikely to be discernable relative to natural weather variability. Both authors presumed that there was a climate change effect but did not provide any evidence of it.
My second problem is that climate change was included for no apparent reason other than to further the climate threat narrative. Patrick Brown argued that:
To put it bluntly, climate science has become less about understanding the complexities of the world and more about serving as a kind of Cassandra, urgently warning the public about the dangers of climate change. However understandable this instinct may be, it distorts a great deal of climate science research, misinforms the public, and most importantly, makes practical solutions more difficult to achieve.
This problem with climate science research also permeates the mass media’s representation of climate change. The constant drumbeat of gloom, doom, and despair about climate change impacts associated with every unusual weather event is pushing the public into unwarranted concern and poor energy policy choices.
Post Script
I had hoped to work the following Scott Adams comic strip into the article but could not find an appropriate place to make the point that much of the claims of climate change danger are based on climate models. I don’t think they have demonstrated enough skill to warrant their use for setting public policy so I agree with premise of the comic.
This is a correction to an earlier post that consolidates all the recent information on added costs associated with renewable energy development needed to meet Climate Leadership & Community Protection Act (Climate Act) targets that have been authorized or requested. Dr. Jonathan Lesser found an error that caused the explosive cost increases estimated in the original article. Although the correct increases are much lower, I still think that these costs are extraordinary albeit not explosive as I said in the original article.
I have been following the Climate Act since it was first proposed, submitted comments on the Climate Act implementation plan, and have written over 350 articles about New York’s net-zero transition. I have devoted a lot of time to the Climate Act because I believe the ambitions for a zero-emissions economy embodied in the Climate Act outstrip available renewable technology such that the net-zero transition will do more harm than good. The opinions expressed in this post do not reflect the position of any of my previous employers or any other company I have been associated with, these comments are mine alone.
Climate Act Background
The Climate Act established a New York “Net Zero” target (85% reduction and 15% offset of emissions) by 2050. It includes an interim 2030 reduction target of a 40% reduction by 2030 and a requirement that all electricity generated be “zero-emissions” by 2040. The Climate Action Council is responsible for preparing the Scoping Plan that outlines how to “achieve the State’s bold clean energy and climate agenda.” In brief, that plan is to electrify everything possible using zero-emissions electricity. The Integration Analysis prepared by the New York State Energy Research and Development Authority (NYSERDA) and its consultants quantifies the impact of the electrification strategies. That material was used to develop the Draft Scoping Plan. After a year-long review, the Scoping Plan recommendations were finalized at the end of 2022. In 2023 the Scoping Plan recommendations are supposed to be implemented through regulation and legislation.
Renewable Procurement Background
The NYSERDA is primarily responsible for facilitating projects to meet Governor Hochul’s target of generating 70 percent of New York State’s electricity from renewable sources by 2030. For background, I tried to figure out those projects will be funded. One component is solicitations for large-scale renewables. That includes a two-step process consisting of:
Step One Eligibility Application: A qualifying step through which the proposer must provide evidence that the Bid Facility is Tier 1 eligible and other general information about the Proposer and the Bid Facility. All Step One Eligibility Applications must be submitted via the RESRFP22-1 solicitation website
Step Two Bid Proposal: A competitive Bid Proposal step, through which NYSERDA will:
a. examine Bid Proposals to determine whether they demonstrate that the Bid Facility and Proposer meet the Minimum Threshold Requirements; and
b. for Bid Proposals that meet those Minimum Threshold Requirements, perform a competitive evaluation based on price and non-price factors.
The focus of this post is on ratepayer costs associated with the zero-emissions mandates. I did some research on the funding mechanisms and this is how I think renewable energy projects are funded. The Clean Energy Standard (CES) is the primary method used to “turn New York State’s ambitious clean energy goal into a reality.” The CES has two mechanisms: the renewable energy standard (RES) and the zero-emissions credit (ZEC) requirement designed to help create a low carbon energy system. According to NYSERDA:
The RES requires every load serving entity (LSE) in New York State to procure renewable energy certificates(RECs) associated with new renewable energy resources—known as Tier 1—for their retail customers. If LSEs cannot demonstrate they are meeting the Tier 1 obligation through the possession of RECs, they may make alternative compliance payments (ACPs).
The ZEC requirement mandates the LSEs procure ZECs from NYSERDA. The number of ZECs is based on each LSE’s proportionate amount of statewide load, or energy demanded, in a given compliance year.
In addition to these programs, NYSERDA is also advancing offshore wind energy projects through its Offshore Wind Program. NYSERDA also works with its State partners and local communities to rapidly advance new “Build-Ready” projects, prioritizing the development of existing or abandoned commercial sites, brownfields, landfills, former industrial sites, and other abandoned or underutilized sites.
The Renewable Energy Standard (RES) is a mechanism enacted by the Clean Energy Standard to help New York State reach its ambitious clean energy goals and transition toward a low carbon energy system. The RES requires utilities and other load serving entities in the State to procure Tier 1 renewable energy credits (RECs).
The LSEs must pay for the RECs. NYSERDA obtains the RECs from developers in auctions. For example, the 2022 solicitation tried to “procure approximately 4.5 million Tier 1 eligible Renewable Energy Certificates (RECs) from eligible facilities that enter commercial operation on or after January 1, 2015 and on or before May 31, 2025, unless extended to May 31, 2028.”
The costs for the RECs are passed on to consumers in several steps. First, NYSERDA awards contracts for the RECs to specific projects. There is no guarantee that a project that has been awarded a contract will actually get built and operate. The Utility Intervention Unit (UIU), Division of Consumer Protection NYS Department of State recently submitted a petition that noted that “only a tiny subset of awarded projects has completed the entire solicitation cycle and reached operational status (“Operational Projects”)”. When a project starts to operate, they are awarded RECs which are sold to the LSEs. The LSEs pass those costs on to their customers only after the PSC authorizes the cost in a utility rate case.
Note, however, that there are other programs described in this article that are also needed to meet the zero-emissions mandate that also add to consumer utility bills.
Informational Report on Ratepayer Costs
The Department of Public Service (DPS) first annual informational report (“Informational Report”) on the implementation of the Climate Act was released in July. The report is notable because it provided the first Climate Act ratepayer cost estimates provided by the Hochul Administration. However, those estimates only cover projects that are in the utility rate cases in 2022. There are many more costs that will eventually show up in electric bills.
The report was based on data submitted by utilities that were collected to pay for Climate Act projects. The Department of Public Service presentation on the Informational Report noted that “ the estimates of total funding authorized by the Commission to date for various clean energy programs in some instances reflect actions that pre-date the enactment of the Climate Act.” The conclusion states that the information presented “represents direct effects of Climate Act implementation only, and only the portion of direct effects of programs over which the Commission has oversight authority.”
In an earlier post I described Table 4: 2022 Electric CLCPA Recoveries from the report that summarizes costs recovered in 2022 by utilities for electric programs. The table states that $1,176 million in Climate Act costs were recovered in 2022 and it shows the amount these costs affected utility bills for seven utilities and eight program categories. I doubt that there are many people who understand what is in each of these different programs but for the purpose of trying to estimate ratepayer costs for renewable energy development we need to summarize the programs. The CES awards discussed above accounted for $348 million of that total. The Clean Energy Fund (CEF) “was established as a commitment to clean energy and efficiency measures”. The latest annual performance report lists four CEF components totaling $500 million: market development, innovation & research, NY-Sun (the distributed solar program), and the NY Green Bank. The value of distributed energy resources (VDER) also known as the Value Stack is a new mechanism to compensate energy created by distributed energy resources, like residential solar. The EV Make Ready Program goal is to support the development of electric infrastructure and equipment necessary to accommodate an increased deployment of EVs within New York State by reducing the upfront costs of building charging stations for EVs. The Integrated Energy Data Resource (IEDR) establishes a statewide centralized computer platform that “will allow effective access to useful energy data and information from New York’s electric, gas, and steam utilities – and other sources – to support new and innovative clean energy business models that deliver benefits to New York energy customers.” The “Electric EE/BE” program for home heating electrification using heat pumps and another for transmission upgrades needed to support the buildout of wind and solar developments. This is the other large ($279 million) cost component. The program categories descriptions that did not include costs total only $48 million.
The purpose of this post is to estimate the necessary cost recoveries for renewable energy development with the latest information. Informational Report Table 8: Authorized Funding to Date “gives a sense” of some of the expenditures that will ultimately be recovered in rates. The Informational Report explains:
This annual report is a review of actual costs incurred by ratepayers to date in support of various programs and projects to implement the CLCPA and does not fully capture potential future expenditures, including estimated costs already authorized by the Commission but not yet recovered in rates. To complement this overview of cost recoveries incurred to date, we also present below a table of the various programs and the total amount of estimated costs associated with each authorized by the Commission to date. Table 8 gives a sense of expenditures that ratepayers could ultimately see recovered in rates. These values are conservative and reflect both past and prospective estimated costs.
The takeaway message from Table 8 is that the authorized funding to date of program costs that will eventually make their way to ratepayer bills totals $43.756 billion. I assume that all the CES costs ($25.242 billion) are associated with renewable energy development. Although there are other components that could support the zero-emissions mandates, I am not aware of proposed adjustments to any other programs.
Offshore Wind (OSW) Transmission Support
The purpose of this post is to update the data in Table 8 with the latest information on renewable energy development costs. The first additional item is the necessary transmission upgrade for offshore wind. Buried in a footnote is an admission that these are not all the costs authorized. Footnote 7 in Table 8 states:
Not included in this table is the Propel NY transmission project, selected by the NYISO Board in June 2023 in response to the Commission’s declaration of a public policy transmission need (PPTN) to support injections of offshore wind energy to the Long Island system by 2030 at an estimated cost of $3.36 billion. Since the Commission did not directly approve this project, the estimated cost is not captured in the Table 8.
I posted an article about this component of the offshore wind implementation requirements earlier this year. The Department of Public Service has an Order for Public Policy Transmission Need (PPTN) (Case 20-E-0497) regarding Climate Act requirements related to offshore wind that drive the need to expand the number of transmission facilities between Long Island and the rest of the State. These transmission system upgrades are needed to get the generated offshore wind from where it comes on shore to where it is needed in the state.
In response to the New York Independent System Operator (NYISO) request for proposals for the PPTN 17 bids were received. The average total cost estimate was $7.1 billion, the maximum was $16.9 billion and the minimum was $2.1 billion. In June 2023, NYISO chose the Propel NY transmission project totaling $3.28 billion.
These are not the only additional costs needed to support offshore wind. The Propel NY costs are only for a portion of the new transmission lines needed and do not include additional costs associated with the impacts on the existing transmission and distribution systems on Long Island. This is the cost associated with 3,000 MW of offshore wind. The Climate Act goal is for 9,000 MW and the Scoping Plan Integration Analysis projects that 12,675 MW of offshore wind will be needed by 2040 in the Strategic Use of Low-Carbon Fuels mitigation scenario.
Offshore Wind Cost Renegotiation
The Informational Report Table 8 program costs include the costs for OSW wind projects that have contracts. One reason for this post is that inflation and supply chain issues have led developers to ask that the contracts be renegotiated. James Hanley writes:
Multiple offshore wind projects that are not even built yet have asked the state’s Public Service Commission (PSC) to renegotiate their strike prices—the amount they will be paid per megawatt hour (MWh) of electricity produced. (A megawatt hour is roughly enough electricity to power 750 homes for one hour.)
One of the glaring deficiencies of the Hochul Administration’s Climate Act implementation is the lack of information about ratepayer impacts. The Informational Report was the first report that provided any estimates of ratepayer impacts and that was a Climate Act mandate. In order to get a feel for the ratepayer impacts of the contract renegotiations it is up to outside parties to provide estimates. Multiple Intervenors and the Municipal Electric Utilities Association of New York State (“Customer Advocates”) recently submitted Supplemental Comments to the New York State Public Service Commission that includes estimates of the incremental costs to customers for these renegotiated contracts.
The Consumer Advocates comments addressed the NYSERDA submitted comments that estimated the change in contract strike prices that would result from contract modifications requested by offshore wind developers. NYSERDA did not provide any estimate of the effect on consumer costs so Consumer Advocates made their own. Their analysis found that the proposed changes could impose on customers incremental costs of between $20.8 billion and $37.6 billion. In my original article I did not pick up on the fact that the incremental costs accrue over 30 years. In other words I should have divided by 30 to get the annual ratepayer impact.
ACENY Tier 1 REC Adjustment
The crony capitalists representing other renewable developments lost no time in submitting their own petitions for additional money. The Alliance for Clean Energy New York (ACENY) submitted their own petition in June 2023 that claimed:
A number of factors not seen in decades, including the COVID-19 pandemic and the war of aggression in Europe with Russia’s invasion of Ukraine, have collectively led to intractable supply chain bottlenecks and labor constraints. Meanwhile, unprecedented increases in demand for new renewable energy development relative to other goods and services as more States and countries implement their own climate change initiatives has further exacerbated these inflationary effects for the renewable energy industry, leading to wholly unpredictable upsurges in the costs of renewable energy development.
The end result: skyrocketing, unpredictable inflationary spikes. As established herein, these effects collectively (“Post-COVID Impacts”) have eroded the viability of Awarded Projects that have not already been cancelled, are not operational and are not yet nearing operation (“Under Development Projects”). Proceeding with the Tier 1 REC program on a status quo basis is, thus, no longer viable.
Using the same methodology used for the offshore wind renegotiation costs, the Consumer Advocates estimated that the ACENY petition would add another $10.69 billion to ratepayer costs. This value needs to be divided by 30 to get the annual impact.
Transmission Project Adjustments
The ACENY petition did not over similar adjustments for the Clean Path New York (CPNY) and Champlain Hudson Express (CHPE) transmission line projects.
CPNY submitted their own petition asking for a similar adjustment:
Clean Path New York LLC (“CPNY”) requested that the New York Public Service Commission (“Commission”) authorize the New York State Energy Research and Development Authority (“NYSERDA”) to adjust CPNY’s strike price to adjust CPNY’s strike price attributable to the generation portion of the Tier 4 Renewable Energy Certificate Purchase and Sale Agreement entered into between CPNY and NYSERDA (the “CPNY Contract”), solely by the amount of the adjustment provided in response to the petition (the “Tier 1 Petition”) filed by the Alliance for Clean Energy New York (“ACE-NY”) requesting that the Commission authorize NYSERDA to incorporate an express adjustment mechanism provision in its Clean Energy Standard Tier 1 contracts (“Adjustment Mechanism”) for projects awarded through NYSERDA’s 2021 Renewable Energy Certificate (“REC”) Solicitation (“Under Development Projects”). As ACE-NY explained, this corrective action will produce RECs that are consistent with New York Public Service Law Section 65 and is required due to the unforeseen and severe market disruptions that have occurred since those solicitations were held. The changes have resulted in materially adverse impacts that have rendered the Under Development Projects economically infeasible.
CHPE also submitted a petition with Hydro Quebec Energy Services (HQES). The introduction to the petition states:
Unprecedented economic factors including rising interest rates, inflation, and supply shortages are jeopardizing all clean energy infrastructure projects needed to achieve New York’s climate goals. With respect to the CHPE Project, the construction costs for its new-build transmission components have increased significantly from the time of the CHPE Project bid submission (in May 2021) to the closing on the financing for the U.S. portion of the CHPE Project in October 2022, shortly after which construction began. Notwithstanding these challenges, Petitioners’ actions allowed the CHPE Project to start construction, and they remain committed to this necessary project and to the HQUS REC Contract.
The CHPE Project is indisputably critical to maintaining reliability while achieving New York State’s longstanding goal of decarbonizing Downstate New York energy consumption. By entering service in Spring 2026 as anticipated, the CHPE Project will create sufficient “reliability margins within New York City” to push off the need to add new generating or other resources for up to five or six years.
Like the other many developers that have filed petitions, Petitioners faced global supply chain shortages and market disruption, and the substantial negative impacts of inflation and interest rate increases on construction costs in both the United States and Canada. For this reason, the CHPE Project is similarly situated to the other major New York renewable energy project petitioners seeking cost adjustments and should be treated equally and consistently with respect to any cost adjustments granted by the Commission.
Accordingly, Petitioners propose that the Commission authorize NYSERDA to adopt a program-wide cost adjustment formula covering all Approved Projects, based on the inflationary adjustment already provided by NYSERDA for new Tier 1 REC contracts.9 The adoption of a program-wide, formula-based price adjustment for construction costs for all new-build project components is Petitioners’ preference, as it would treat all developers equally.
Consumer Advocates did not calculate an impact to consumers for these two project renegotiations. I did not try to estimate any additional ratepayer impacts for them.
Discussion
The Utility Intervention Unit, Division of Consumer Protection NYS Department of State submitted a petition responding to ACENY. They describe the ACENY petition as follows:
The ACE-NY petition seeks a one-time adjustment mechanism for solar and wind projects claiming it would restore “viability to support project completion, while also ensuring efficiency, transparency, and simplicity in their application.”
ACE-NY proposes an adjustment factor on each project so that Under Development Projects will become economically viable and claims this is necessary to meet a viable schedule to achieve the 2030 goal.
The Utility Intervention Unit had issues with the ACENY petition:
Yet, PA Consulting’s assessment did not consider “specific circumstances faced by individual renewable energy project or developer.” Nor did they analyze which portion of Under Development Projects would be successful, fail, or offer new projects in subsequent solicitations due to the number of judgement calls that would be required.10 While PA Consulting focused on the financial aspects, it did not consider or speak to whether the sought adjustment mechanism could overcome supply chain or labor shortages among the increase demand of renewable resources. Therefore, it appears ACE-NY and PA Consulting are proposing an adjustment factor with no guarantee that the 2030 goal will be met. Without such guarantees, UIU opposes the petition as requested and suggests the focus be on supporting only those projects worthy of ratepayers’ support.
For markets and competition to function efficiently, contracts and obligations should be honored. Altering contracts after terms are defined can diminish the competitive process that potentially disadvantages those bidders not selected in a respective solicitation and consumers who are paying for the project. The unsuccessful bidders may have included a risk premium that could be less than the REC price adjustment ACE-NY is seeking in its petition.
I agree with UIU. There are implications not only to costs but also to the schedule for all the factors cited by the developers.
Consolidated Ratepayer Cost Estimate
The following table lists all authorized and incremental relief ratepayer costs that could be on the backs of New York ratepayers except for the CPNY and CHPE project costs. The Informational Report listed $43.8 billion in costs that have been authorized but are not yet in ratepayer bills. That report did not include the $3.3 billion Propel NY transmission project needed for offshore wind. If total costs for the Integration Analysis offshore wind projection are proportional to the offshore wind capacity (12,765 MW to 3,000 MW) the transmission upgrades for offshore wind will be $13.9 billion. The Consumer Advocate petition estimated ratepayer costs for the NYSERDA and ACENY petitions ranging from $26.4 billion to $48.4 billion. When the Informational Report authorized funding to date, offshore wind transmission support, and the Consumer Advocate additional funding requirements are totaled the range is $73.47 billion to $105.7 billion.
Ratepayer Potential Impacts
The Informational Report included Table 7: 2022 Typical Monthly Electric Bills with Climate Act related costs disaggregated that was the first admission by the Hochul Administration of potential costs of the Climate Act to ratepayers. The basis for the typical electric delivery and supply bills for 2022 was provided for the following customer types:
A. Residential customers (600 kWh per month),
B. Non-residential customers (50 kW & 12,600 kWh per month),
C. Non-residential customers (2,000 kW & 720,000 kWh per month), and
D. Non-residential high load factor customers (2,000 kW & 1,296,000 kWh per month).
PSC Staff requested that utilities disaggregate the cost components reported in Table 2 (electric) to determine CLCPA related impacts on customers as shown in Table 7. Climate Act costs added between 9.8% and 3.7% to residential monthly electric bills in 2022.
This is the point where my mistake caused the results to go off the rails. It turns out that I made the same mistake in a previous post too. I pro-rated the Informational Report ratepayer Climate Act cost recoveries for $43.8 billion in costs for contracts that have been awarded but not yet authorized for cost recovery but did not account for a 30-year accrual. In the original post I showed calculations two ways but will only show the slightly more refined version here.
Recall that Table 4: 2022 Electric CLCPA Recoveries in the Informational Report summarizes costs recovered in 2022 by utilities for electric programs. The table states that $1,176 million in Climate Act costs were recovered in 2022 and it shows the amount these costs affected utility bills for seven utilities and eight program categories. I assume that future ratepayer costs will increase proportionally to the
Informational Report authorized funding to date, offshore wind transmission support, and the Consumer Advocate additional funding requirements in the range of $73.47 billion to $105.7 billion if these numbers are divided by 30 to account for the appropriate accrual rate.
Instead of using the ratio of the totals I prorated costs from the Table 8 program cost categories for all the additional costs expected and then scaled costs per utility for the lower and upper bounds. This adds another 4 to 20% increase in the Climate Act costs. Ultimately, the PSC should provide the refined numbers not the Consumer Advocates or folks like me. New Yorkers deserve the best estimates of ratepayer costs.
Note that if you want the spreadsheet with these data please contact me.
Conclusion
I believe that the Hochul Administration is trying hard to coverup the ratepayer cost impacts. The Informational Report is a useful first estimate of ratepayer impacts but it was a required Climate Act mandate. It provides as little information as possible. For example, it excludes the Propel NY transmission costs because “the Commission did not directly approve this project.” The intent of the Climate Act mandate was to describe all the effects of the Act on ratepayers not just what is politically palatable.
The costs shown here are notable and they are not the total costs. All the ratepayer costs that are described in this post are only for the supply portion of utility bills. The Hochul Administration is implementing a Cap-and-Invest program that will increase the costs of delivery. There has been absolutely no hint of the expected costs for the cap-and-invest program but it will certainly cause an additional increase in costs. In addition, this is just for the costs of the electricity. The Climate Act plan is to convert homes and transportation to zero emissions energy too so New Yorkers will have to pick up those costs too.
When I thought that the Climate Act would more than double electric utility bills I said I expected that a ratepayer revolt would occur when the public caught on. Even at these lower costs I believe that the Hochul Administration has a vested interest in covering up these costs up for as long as possible. I am disappointed that there have not been news stories about this issue. There always seems to be space for the latest unsubstantiated claim that an unusual weather event is proof of climate change but there does not appear to be room to show that New York’s plan to do something about climate change will make electricity unaffordable for many. The real impacts of energy poverty on health and welfare should be a higher priority than the speculative effects of climate change that New York cannot alter because New York GHG emissions are less than one half of one percent of global emissions and global emissions have been increasing on average by more than one half of one percent per year since 1990. Anything we do is supplanted by emission increases elsewhere in less than a year.
Update:There is an error in this post. Please refer to the corrected version . Dr. Jonathan Lesser pointed out that I need to adjust the consolidated costs described here for contracts that have been awarded but not yet authorized for cost recovery and other requested costs but did not account for a 30-year accrual. As a result the correct increases are much lower, but I still think that these costs are extraordinary albeit not explosive as I said here.
This post consolidates all the recent information on added costs associated with renewable energy development needed to meet Climate Leadership & Community Protection Act (Climate Act) targets that have been authorized or requested. These costs will eventually show up in electric bills and the projected cost increases are extraordinary.
I have been following the Climate Act since it was first proposed, submitted comments on the Climate Act implementation plan, and have written over 350 articles about New York’s net-zero transition. I have devoted a lot of time to the Climate Act because I believe the ambitions for a zero-emissions economy embodied in the Climate Act outstrip available renewable technology such that the net-zero transition will do more harm than good. The opinions expressed in this post do not reflect the position of any of my previous employers or any other company I have been associated with, these comments are mine alone.
Climate Act Background
The Climate Act established a New York “Net Zero” target (85% reduction and 15% offset of emissions) by 2050. It includes an interim 2030 reduction target of a 40% reduction by 2030 and a requirement that all electricity generated be “zero-emissions” by 2040. The Climate Action Council is responsible for preparing the Scoping Plan that outlines how to “achieve the State’s bold clean energy and climate agenda.” In brief, that plan is to electrify everything possible using zero-emissions electricity. The Integration Analysis prepared by the New York State Energy Research and Development Authority (NYSERDA) and its consultants quantifies the impact of the electrification strategies. That material was used to develop the Draft Scoping Plan. After a year-long review, the Scoping Plan recommendations were finalized at the end of 2022. In 2023 the Scoping Plan recommendations are supposed to be implemented through regulation and legislation.
Renewable Procurement Background
The NYSERDA is primarily responsible for facilitating projects to meet Governor Hochul’s target of generating 70 percent of New York State’s electricity from renewable sources by 2030. For background, I tried to figure out those projects will be funded. One component is solicitations for large-scale renewables. That includes a two-step process consisting of:
Step One Eligibility Application: A qualifying step through which the proposer must provide evidence that the Bid Facility is Tier 1 eligible and other general information about the Proposer and the Bid Facility. All Step One Eligibility Applications must be submitted via the RESRFP22-1 solicitation website
Step Two Bid Proposal: A competitive Bid Proposal step, through which NYSERDA will:
a. examine Bid Proposals to determine whether they demonstrate that the Bid Facility and Proposer meet the Minimum Threshold Requirements; and
b. for Bid Proposals that meet those Minimum Threshold Requirements, perform a competitive evaluation based on price and non-price factors.
The focus of this post is on ratepayer costs associated with the zero-emissions mandates. I did some research on the funding mechanisms and this is how I think renewable energy projects are funded. The Clean Energy Standard (CES) is the primary method used to “turn New York State’s ambitious clean energy goal into a reality.” The CES has two mechanisms: the renewable energy standard (RES) and the zero-emissions credit (ZEC) requirement designed to help create a low carbon energy system. According to NYSERDA:
The RES requires every load serving entity (LSE) in New York State to procure renewable energy certificates(RECs) associated with new renewable energy resources—known as Tier 1—for their retail customers. If LSEs cannot demonstrate they are meeting the Tier 1 obligation through the possession of RECs, they may make alternative compliance payments (ACPs).
The ZEC requirement mandates the LSEs procure ZECs from NYSERDA. The number of ZECs is based on each LSE’s proportionate amount of statewide load, or energy demanded, in a given compliance year.
In addition to these programs, NYSERDA is also advancing offshore wind energy projects through its Offshore Wind Program. NYSERDA also works with its State partners and local communities to rapidly advance new “Build-Ready” projects, prioritizing the development of existing or abandoned commercial sites, brownfields, landfills, former industrial sites, and other abandoned or underutilized sites.
The Renewable Energy Standard (RES) is a mechanism enacted by the Clean Energy Standard to help New York State reach its ambitious clean energy goals and transition toward a low carbon energy system. The RES requires utilities and other load serving entities in the State to procure Tier 1 renewable energy credits (RECs).
The LSEs must pay for the RECs. NYSERDA obtains the RECs from developers in auctions. For example, the 2022 solicitation tried to “procure approximately 4.5 million Tier 1 eligible Renewable Energy Certificates (RECs) from eligible facilities that enter commercial operation on or after January 1, 2015 and on or before May 31, 2025, unless extended to May 31, 2028.”
The costs for the RECs are passed on to consumers in several steps. First, NYSERDA awards contracts for the RECs to specific projects. There is no guarantee that a project that has been awarded a contract will actually get built and operate. The Utility Intervention Unit (UIU), Division of Consumer Protection NYS Department of State recently submitted a petition that noted that “only a tiny subset of awarded projects has completed the entire solicitation cycle and reached operational status (“Operational Projects”)”. When a project starts to operate, they are awarded RECs which are sold to the LSEs. The LSEs pass those costs on to their customers only after the PSC authorizes the cost in a utility rate case.
Note, however, that there are other programs described in this article that are also needed to meet the zero-emissions mandate that also add to consumer utility bills.
Informational Report on Ratepayer Costs
The Department of Public Service (DPS) first annual informational report (“Informational Report”) on the implementation of the Climate Act was released in July. The report is notable because it provided the first Climate Act ratepayer cost estimates provided by the Hochul Administration. However, those estimates only cover projects that are in the utility rate cases in 2022. There are many more costs that will eventually show up in electric bills.
The report was based on data submitted by utilities that were collected to pay for Climate Act projects. The Department of Public Service presentation on the Informational Report noted that “ the estimates of total funding authorized by the Commission to date for various clean energy programs in some instances reflect actions that pre-date the enactment of the Climate Act.” The conclusion states that the information presented “represents direct effects of Climate Act implementation only, and only the portion of direct effects of programs over which the Commission has oversight authority.”
In an earlier post I described Table 4: 2022 Electric CLCPA Recoveries from the report that summarizes costs recovered in 2022 by utilities for electric programs. The table states that $1,176 million in Climate Act costs were recovered in 2022 and it shows the amount these costs affected utility bills for seven utilities and eight program categories. I doubt that there are many people who understand what is in each of these different programs but for the purpose of trying to estimate ratepayer costs for renewable energy development we need to summarize the programs. The CES awards discussed above accounted for $348 million of that total. The Clean Energy Fund (CEF) “was established as a commitment to clean energy and efficiency measures”. The latest annual performance report lists four CEF components totaling $500 million: market development, innovation & research, NY-Sun (the distributed solar program), and the NY Green Bank. The value of distributed energy resources (VDER) also known as the Value Stack is a new mechanism to compensate energy created by distributed energy resources, like residential solar. The EV Make Ready Program goal is to support the development of electric infrastructure and equipment necessary to accommodate an increased deployment of EVs within New York State by reducing the upfront costs of building charging stations for EVs. The Integrated Energy Data Resource (IEDR) establishes a statewide centralized computer platform that “will allow effective access to useful energy data and information from New York’s electric, gas, and steam utilities – and other sources – to support new and innovative clean energy business models that deliver benefits to New York energy customers.” The “Electric EE/BE” program for home heating electrification using heat pumps and another for transmission upgrades needed to support the buildout of wind and solar developments. This is the other large ($279 million) cost component. The program categories descriptions that did not include costs total only $48 million.
The purpose of this post is to estimate the necessary cost recoveries for renewable energy development with the latest information. Informational Report Table 8: Authorized Funding to Date “gives a sense” of some of the expenditures that will ultimately be recovered in rates. The Informational Report explains:
This annual report is a review of actual costs incurred by ratepayers to date in support of various programs and projects to implement the CLCPA and does not fully capture potential future expenditures, including estimated costs already authorized by the Commission but not yet recovered in rates. To complement this overview of cost recoveries incurred to date, we also present below a table of the various programs and the total amount of estimated costs associated with each authorized by the Commission to date. Table 8 gives a sense of expenditures that ratepayers could ultimately see recovered in rates. These values are conservative and reflect both past and prospective estimated costs.
The takeaway message from Table 8 is that the authorized funding to date of program costs that will eventually make their way to ratepayer bills totals $43.756 billion. I assume that all the CES costs ($25.242 billion) are associated with renewable energy development. Although there are other components that could support the zero-emissions mandates, I am not aware of proposed adjustments to any other programs.
Offshore Wind (OSW) Transmission Support
The purpose of this post is to update the data in Table 8 with the latest information on renewable energy development costs. The first additional item is the necessary transmission upgrade for offshore wind. Buried in a footnote is an admission that these are not all the costs authorized. Footnote 7 in Table 8 states:
Not included in this table is the Propel NY transmission project, selected by the NYISO Board in June 2023 in response to the Commission’s declaration of a public policy transmission need (PPTN) to support injections of offshore wind energy to the Long Island system by 2030 at an estimated cost of $3.36 billion. Since the Commission did not directly approve this project, the estimated cost is not captured in the Table 8.
I posted an article about this component of the offshore wind implementation requirements earlier this year. The Department of Public Service has an Order for Public Policy Transmission Need (PPTN) (Case 20-E-0497) regarding Climate Act requirements related to offshore wind that drive the need to expand the number of transmission facilities between Long Island and the rest of the State. These transmission system upgrades are needed to get the generated offshore wind from where it comes on shore to where it is needed in the state.
In response to the New York Independent System Operator (NYISO) request for proposals for the PPTN 17 bids were received. The average total cost estimate was $7.1 billion, the maximum was $16.9 billion and the minimum was $2.1 billion. In June 2023, NYISO chose the Propel NY transmission project totaling $3.28 billion.
These are not the only additional costs needed to support offshore wind. The Propel NY costs are only for a portion of the new transmission lines needed and do not include additional costs associated with the impacts on the existing transmission and distribution systems on Long Island. This is the cost associated with 3,000 MW of offshore wind. The Climate Act goal is for 9,000 MW and the Scoping Plan Integration Analysis projects that 12,675 MW of offshore wind will be needed by 2040 in the Strategic Use of Low-Carbon Fuels mitigation scenario.
Offshore Wind Cost Renegotiation
The Informational Report Table 8 program costs include the costs for OSW wind projects that have contracts. One reason for this post is that inflation and supply chain issues have led developers to ask that the contracts be renegotiated. James Hanley writes:
Multiple offshore wind projects that are not even built yet have asked the state’s Public Service Commission (PSC) to renegotiate their strike prices—the amount they will be paid per megawatt hour (MWh) of electricity produced. (A megawatt hour is roughly enough electricity to power 750 homes for one hour.)
One of the glaring deficiencies of the Hochul Administration’s Climate Act implementation is the lack of information about ratepayer impacts. The Informational Report was the first report that provided any estimates of ratepayer impacts and that was a Climate Act mandate. In order to get a feel for the ratepayer impacts of the contract renegotiations it is up to outside parties to provide estimates. Multiple Intervenors and the Municipal Electric Utilities Association of New York State (“Customer Advocates”) recently submitted Supplemental Comments to the New York State Public Service Commission that includes estimates of the incremental costs to customers for these renegotiated contracts.
The Consumer Advocates comments addressed the NYSERDA submitted comments that estimated the change in contract strike prices that would result from contract modifications requested by offshore wind developers. NYSERDA did not provide any estimate of the effect on consumer costs so Consumer Advocates made their own. Their analysis found that the proposed changes could impose on customers incremental costs of between $20.8 billion and $37.6 billion.
ACENY Tier 1 REC Adjustment
The crony capitalists representing other renewable developments lost no time in submitting their own petitions for additional money. The Alliance for Clean Energy New York (ACENY) submitted their own petition in June 2023 that claimed:
A number of factors not seen in decades, including the COVID-19 pandemic and the war of aggression in Europe with Russia’s invasion of Ukraine, have collectively led to intractable supply chain bottlenecks and labor constraints. Meanwhile, unprecedented increases in demand for new renewable energy development relative to other goods and services as more States and countries implement their own climate change initiatives has further exacerbated these inflationary effects for the renewable energy industry, leading to wholly unpredictable upsurges in the costs of renewable energy development.
The end result: skyrocketing, unpredictable inflationary spikes. As established herein, these effects collectively (“Post-COVID Impacts”) have eroded the viability of Awarded Projects that have not already been cancelled, are not operational and are not yet nearing operation (“Under Development Projects”). Proceeding with the Tier 1 REC program on a status quo basis is, thus, no longer viable.
Using the same methodology used for the offshore wind renegotiation costs, the Consumer Advocates estimated that the ACENY petition would add another $10.69 billion to ratepayer costs.
Transmission Project Adjustments
The ACENY petition did not over similar adjustments for the Clean Path New York (CPNY) and Champlain Hudson Express (CHPE) transmission line projects.
CPNY submitted their own petition asking for a similar adjustment:
Clean Path New York LLC (“CPNY”) requested that the New York Public Service Commission (“Commission”) authorize the New York State Energy Research and Development Authority (“NYSERDA”) to adjust CPNY’s strike price to adjust CPNY’s strike price attributable to the generation portion of the Tier 4 Renewable Energy Certificate Purchase and Sale Agreement entered into between CPNY and NYSERDA (the “CPNY Contract”), solely by the amount of the adjustment provided in response to the petition (the “Tier 1 Petition”) filed by the Alliance for Clean Energy New York (“ACE-NY”) requesting that the Commission authorize NYSERDA to incorporate an express adjustment mechanism provision in its Clean Energy Standard Tier 1 contracts (“Adjustment Mechanism”) for projects awarded through NYSERDA’s 2021 Renewable Energy Certificate (“REC”) Solicitation (“Under Development Projects”). As ACE-NY explained, this corrective action will produce RECs that are consistent with New York Public Service Law Section 65 and is required due to the unforeseen and severe market disruptions that have occurred since those solicitations were held. The changes have resulted in materially adverse impacts that have rendered the Under Development Projects economically infeasible.
CHPE also submitted a petition with Hydro Quebec Energy Services (HQES). The introduction to the petition states:
Unprecedented economic factors including rising interest rates, inflation, and supply shortages are jeopardizing all clean energy infrastructure projects needed to achieve New York’s climate goals. With respect to the CHPE Project, the construction costs for its new-build transmission components have increased significantly from the time of the CHPE Project bid submission (in May 2021) to the closing on the financing for the U.S. portion of the CHPE Project in October 2022, shortly after which construction began. Notwithstanding these challenges, Petitioners’ actions allowed the CHPE Project to start construction, and they remain committed to this necessary project and to the HQUS REC Contract.
The CHPE Project is indisputably critical to maintaining reliability while achieving New York State’s longstanding goal of decarbonizing Downstate New York energy consumption. By entering service in Spring 2026 as anticipated, the CHPE Project will create sufficient “reliability margins within New York City” to push off the need to add new generating or other resources for up to five or six years.
Like the other many developers that have filed petitions, Petitioners faced global supply chain shortages and market disruption, and the substantial negative impacts of inflation and interest rate increases on construction costs in both the United States and Canada. For this reason, the CHPE Project is similarly situated to the other major New York renewable energy project petitioners seeking cost adjustments and should be treated equally and consistently with respect to any cost adjustments granted by the Commission.
Accordingly, Petitioners propose that the Commission authorize NYSERDA to adopt a program-wide cost adjustment formula covering all Approved Projects, based on the inflationary adjustment already provided by NYSERDA for new Tier 1 REC contracts.9 The adoption of a program-wide, formula-based price adjustment for construction costs for all new-build project components is Petitioners’ preference, as it would treat all developers equally.
Consumer Advocates did not calculate an impact to consumers for these two project renegotiations. I did not try to estimate any additional ratepayer impacts for them.
Discussion
The Utility Intervention Unit, Division of Consumer Protection NYS Department of State submitted a petition responding to ACENY. They describe the ACENY petition as follows:
The ACE-NY petition seeks a one-time adjustment mechanism for solar and wind projects claiming it would restore “viability to support project completion, while also ensuring efficiency, transparency, and simplicity in their application.”
ACE-NY proposes an adjustment factor on each project so that Under Development Projects will become economically viable and claims this is necessary to meet a viable schedule to achieve the 2030 goal.
The Utility Intervention Unit had issues with the ACENY petition:
Yet, PA Consulting’s assessment did not consider “specific circumstances faced by individual renewable energy project or developer.” Nor did they analyze which portion of Under Development Projects would be successful, fail, or offer new projects in subsequent solicitations due to the number of judgement calls that would be required.10 While PA Consulting focused on the financial aspects, it did not consider or speak to whether the sought adjustment mechanism could overcome supply chain or labor shortages among the increase demand of renewable resources. Therefore, it appears ACE-NY and PA Consulting are proposing an adjustment factor with no guarantee that the 2030 goal will be met. Without such guarantees, UIU opposes the petition as requested and suggests the focus be on supporting only those projects worthy of ratepayers’ support.
For markets and competition to function efficiently, contracts and obligations should be honored. Altering contracts after terms are defined can diminish the competitive process that potentially disadvantages those bidders not selected in a respective solicitation and consumers who are paying for the project. The unsuccessful bidders may have included a risk premium that could be less than the REC price adjustment ACE-NY is seeking in its petition.
I agree with UIU. There are implications not only to costs but also to the schedule for all the factors cited by the developers.
Consolidated Ratepayer Cost Estimate
The following table lists all authorized and incremental relief ratepayer costs that could be on the backs of New York ratepayers except for the CPNY and CHPE project costs. The Informational Report listed $43.8 billion in costs that have been authorized but are not yet in ratepayer bills. That report did not include the $3.3 billion Propel NY transmission project needed for offshore wind. If total costs for the Integration Analysis offshore wind projection are proportional to the offshore wind capacity (12,765 MW to 3,000 MW) the transmission upgrades for offshore wind will be $13.9 billion. The Consumer Advocate petition estimated ratepayer costs for the NYSERDA and ACENY petitions ranging from $26.4 billion to $48.4 billion. When the Informational Report authorized funding to date, offshore wind transmission support, and the Consumer Advocate additional funding requirements are totaled the range is $73.47 billion to $105.7 billion.
Ratepayer Potential Impacts
The Informational Report included Table 7: 2022 Typical Monthly Electric Bills with Climate Act related costs disaggregated that was the first admission by the Hochul Administration of potential costs of the Climate Act to ratepayers. The basis for the typical electric delivery and supply bills for 2022 was provided for the following customer types:
A. Residential customers (600 kWh per month),
B. Non-residential customers (50 kW & 12,600 kWh per month),
C. Non-residential customers (2,000 kW & 720,000 kWh per month), and
D. Non-residential high load factor customers (2,000 kW & 1,296,000 kWh per month).
PSC Staff requested that utilities disaggregate the cost components reported in Table 2 (electric) to determine CLCPA related impacts on customers as shown in Table 7. Climate Act costs added between 9.8% and 3.7% to residential monthly electric bills in 2022.
In a previous post I pro-rated the Informational Report ratepayer Climate Act cost recoveries for the $43.8 billion in costs for contracts that have been awarded but not yet authorized for cost recovery. I simply calculated the ratio of the authorized Climate Act funding to date ($43.8 billion) to the Climate Act costs that have been authorized and were in the 2022 residential bills ($1.2 billion). For a rough approximation of impacts by utility I simply multiplied the ratio by each of the monthly Climate Act disaggregated cost components reported by the utilities to determine CLCPA future related impacts on customers. This will not give an exact utility-specific estimate because the money authorizations per utility for 2022 and the future will not necessarily be the same. The following table uses the same methodology for all the expected ratepayer costs.
These numbers are so large that I suspect that I am missing something. I tried an alternative way to estimate ratepayer impacts. In the alternative approach I prorated costs from the Table 8 program cost categories for all the additional costs expected and then scaled costs per utility for the lower and upper bounds. This probably is a better estimate of utility costs but the numbers are still extraordinarily high.
I believe that when all the costs not included in the Informational Report are authorized for rate cases that residential bills will more than double, at least. Ultimately, the PSC should provide the refined numbers not the Consumer Advocates or folks like me. New Yorkers deserve the best estimates.
Conclusion
I believe that the Hochul Administration is trying hard to coverup the ratepayer cost impacts. The Informational Report is a useful first estimate of ratepayer impacts but it was a required Climate Act mandate. It provides as little information as possible. For example, it excludes the Propel NY transmission costs because “the Commission did not directly approve this project.” The intent of the Climate Act mandate was to describe all the effects of the Act on ratepayers not just what is politically palatable.
Furthermore, even the additional costs that I provided in this post are not the total costs. All the ratepayer costs that are described in this post are only for the supply portion of utility bills. The Hochul Administration is implementing a Cap-and-Invest program that will increase the costs of delivery. There has been absolutely no hint of the expected costs for this program but it will certainly cause an additional increase in costs. In addition, this is just for the costs of the electricity. The Climate Act plan is to convert homes and transportation to zero emissions energy too so New Yorkers will have to pick up those costs too.
I concluded that electric utility bills would double but I believe that is a lowball estimate. I think that most ratepayers would be grabbing pitchforks and torches to march on Albany in protest of these projected utility bill increases if they knew what was coming their way. Clearly the Hochul Administration has a vested interest in covering up these costs up for as long as possible. I am disappointed that there have not been news stories about this issue. There always seems to be space for the latest unsubstantiated claim that an unusual weather event is proof of climate change but there does not appear to be room to show that New York’s plan to do something about it will make electricity unaffordable for many. The real impacts of energy poverty on health and welfare should be a higher priority than the speculative effects of climate change that New York cannot affect because New York GHG emissions are less than one half of one percent of global emissions and global emissions have been increasing on average by more than one half of one percent per year since 1990. Anything we do is supplanted by emission increases elsewhere.