There is a consistent disconnect between reality and the State’s consideration of climate change incorporated in the Climate Leadership and Community Protection Act (Climate Act). Nowhere is this more obvious than in the op-ed by NYS Department of Environmental Conservation Commissioner Basil Seggos and NYS Department of Agriculture and Markets Commissioner Richard Ball published in the Auburn Citizen on August 30.
New York’s Climate Leadership and Community Protection Act (Climate Act) Act establishes a “Net Zero” target (85% reduction and 15% offset of emissions) by 2050. I have written extensively on implementation of the Climate Act. Everyone wants to do right by the environment to the extent that efforts will make a positive impact at an affordable level. My analysis of the Climate Act shows that the ambitions for a zero-emissions economy outstrip available renewable technology such that the transition to an electric system relying on wind and solar will do more harm than good. The opinions expressed in this post do not reflect the position of any of my previous employers or any other company I have been associated with, these comments are mine alone.
New York Permitting Requirements
New York’s Article Ten process defines the permitting requirements for all large-scale electric generating new construction or expansion. It includes extensive and time-consuming public notification and public participation requirements. The 2011 revisions to the Article Ten law were intended to speed things up but were largely ineffective in that regard. In early April 2020, NYS passed the Accelerated Renewable Energy Growth and Community Benefit Act (AREGCBA) as part of the 2020-21 state budget. The legislation was intended to ensure that renewable generation is sited in a timely and cost-effective manner. Unfortunately, the result has been an unchecked land rush of solar development in the state with no limitations on the conversion of prime farmlands to utility-scale solar development.
Discussion
The primary purpose of the op-ed was to congratulate Greenfield Farms in Skaneateles, NY for being “the recipient of this year’s prestigious New York Leopold Conservation Award for its extraordinary environmental protection efforts, uses healthy soil practices that enhance water quality and strengthen carbon sequestration”. That is a great achievement and I believe it should be a keystone component of the state’s efforts for a resilient agricultural economy.
The op-ed also describes New York State’s innovative Climate Resilient Farming Program. This program “assists farmers who proactively tackle climate concerns by providing cost-shared grants to incentivize transformative management practices that reduce greenhouse gas emissions, draw down carbon dioxide from the atmosphere, and increase carbon storage in soils and woody plants.” Those are laudable efforts, are necessary for Climate Act implementation, and I support them.
However, the op-ed goes off the rails when it continues: “At the same time, it helps protect at-risk agricultural land across the State.” I have written multiple articles about solar siting with respect to agriculture in New York. Based on that work I believe that the biggest risk to agricultural land in New York State is the lack of a responsible solar siting framework for the massive utility-scale solar projects needed to meet the Climate Act targets. There is a policy option roadmap for the proposed 10 GW of distributed solar development. However, there is not an equivalent set of policies for utility-scale solar development.
On July 25, 2022 a press release from Governor Hochul announced siting approval of New York’s largest solar facility to date. The release said that the “New York State Office of Renewable Energy Siting has issued a siting permit to Hecate Energy Cider Solar LLC, to develop, design, construct, operate, maintain, and decommission a 500-megawatt solar facility in the Towns of Oakfield and Elba, Genesee County.“ In the press release Commissioner Basil Seggos was quoted as saying:
DEC applauds Governor Hochul’s ongoing prioritization of renewable energy development to support our state’s necessary transition away from fossil fuels. As more solar projects continue to be approved and come online, we are closer to achieving the goals and requirements set in the Climate Leadership and Community Protection Act. This will continue to provide renewable energy benefits here in Genesee County and throughout the state.
In my article on this approval, I noted that according to the exhibit titled “Farmland Classification Mapping” that lists landcover class data.:
According to NLCD data, the dominant landcover class in the Project Site is active agriculture, followed by forestland. Agricultural lands in the Project Site are comprised of active agricultural land (both row crops and mowed/maintained hayfields) and there are numerous family and commercial farms and farm structures in the Project Site. Row crops comprise approximately 68% (3,143 acres) of the Project Site, and less than 1% (23 acres) of the total Project Site is maintained hayfields. Additionally, there is approximately 3.5% (161 acres) of the Project Site where the dominant land cover is grasslands or pasturelands.
Relative to agricultural soils, the Project Site includes approximately 41% (1,912 acres) of land classified as Prime Farmland, 27% (1,252 acres) as Prime Farmland if Drained, 19% (891 acres) as Farmland of Statewide Importance, and 13% (596 acres) as Not Prime Farmland (Natural Cooperative Soil Survey 2020).
The prime farmland and prime farmland if drained categories total 2,143 acres well in excess of 1,400-acre Greenfield Farms.
I believe best practices for solar development should meet the Department of Agriculture and Markets target for prime farmland conversion. In particular, “The Department’s goal is for projects to limit the conversion of agricultural areas within the Project Areas, to no more than 10% of soils classified by the Department’s NYS Agricultural Land Classification mineral soil groups 1-4, generally Prime Farmland soils, which represent the State’s most productive farmland.” Four recently approved solar projects totaling 920 MW all exceeded that threshold and converted 3,456 acres of the state’s prime farmland to industrial use. Overall, those projects converted 28% of the prime farmland in the Project Areas. In addition, none of these projects propose practicing responsible solar siting consistent with the state’s distributed solar development roadmap. For example, there are no provisions for agricultural practices consistent with the solar panels.
Conclusion
The current projections for utility-scale solar development call for over 43,000 MW in order to meet the requirements for zero-emissions power. At the current rate of converted prime farmland to capacity development upwards of 161,000 acres of prime farmland could be lost. Until such time that the state adopts responsible solar siting guidelines for utility-scale development consistent with existing policies for distributed solar, the impacts of solar development will have bigger impacts on agriculture than those purported to occur because of climate change.
Obviously, Commissioner Seggos recent press releases are hypocritical. Regarding the massive solar project, he states that “Solar farms of this scope produce enough energy to power thousands of homes while also creating well-paying, family-sustaining jobs and breathing new life into our local economies.” His op-ed states that the Climate Resilient Farming Program “helps protect at-risk agricultural land across the State”. The fact is that unbridled utility-scale solar development is the major risk to agricultural land in the State and no amount of protection from any virtue signaling state agricultural program is going to stop that.
I am going to start summarizing updates I make to the pages I maintain at Pragmatic Environmentalist of New York and Reforming the Energy Vision Inconvenient Truths. I have an extensive list of reference materials on my original blog that I occasionally update when I run across an article that is particularly interesting and relevant and this blog also has reference material. This article describes some recent page updates.
I started blogging in late 2017 on New York’s energy policies because I was convinced that they are going to end as an expensive boondoggle driving electricity prices in particular and energy prices in general significantly higher. Reforming the Energy Vision (REV) was the previous comprehensive energy strategy for New York. I wrote about the inconvenient unpublicized or missing pieces of New York State’s REV policy: implementation plan, costs and impacts. At some point I should probably combine that blog with this one but in the meantime, I will maintain them both. The opinions expressed in this post do not reflect the position of any of my previous employers or any other company I have been associated with, these comments are mine alone.
Updates
I linked two articles to the renewable energy feasibility page. This very good overview of all the problems associated with green energy was described at the Australian Stop These Things website. Author Andrew Roman points out six issues ignored by New York State energy policy:
All energy sources have some adverse effects on the environment, including wind and solar:
extensive use of scarce minerals supply, largely controlled by China;
massive concrete bases and steel towers of wind generators require extensive use of coal in manufacturing;
low energy density requires huge amounts of land (some 25 per cent of the US land area if all electricity was to be generated by solar panels);
wind turbines kill birds and bats;
both solar panels and wind turbines create huge amounts of un-recyclable waste
China dominates solar panel and wind turbine manufacturing by burning a lot of coal.
The article goes on to document these issues.
The second renewable feasibility article by Francis Menton made the point that the easiest Net-Zero goal is to eliminate emissions in the electric generation sector. However, he points out that not only has no jurisdiction successfully made the transition but also argues that it will be never be achieved. He notes that wind and solar development is entirely dependent upon government subsidies. All other energy transitions have been based on organic consumer demand not on government mandates. His article describes the current situation in Europe where net=zero energy transition policies have created a situation where they don’t have dispatchable, emissions-free generating resources available for extended periods of low wind and solar resource availability causing affordability and reliability issues. He concludes:
So, if you have a chance to make a bet, you’ll be extremely safe betting against Net Zero generation of electricity any time during your life. Nuclear is the only way it could potentially be done, and that’s blocked by regulatory obstruction more or less everywhere.
Chris Denton from New York’s Southern Tier wrote a great article describing a reasonable development policy for industrial solar that I linked to my solar issues page. He points out that it is reasonable to have a policy framework in place before we “advance the production of electric energy by means of industrial free-standing solar collectors”. He argues that developing industrial solar facilities diverts land from an existing use (e.g., habitat or agriculture) it follows that “how much and where we divert the sun’s rays ought be very carefully measured and studied before allowing any further industrial development of solar electric generation.” He points out that there are plenty of locations that do not impact agriculture and sequestration so those should a priority. He concludes:
The damage caused by our refusal to recognize these impacts can destroy our environment as effectively as any other unexamined industrial or commercial project. It is that very blindness to incremental, unplanned action that has led to the very global warming which we are now trying to unwind. We should not make the same mistake in the cure as we did in acquiring the disease. We need to take care that in our zeal to protect our environment from unrestricted global warming, we don’t destroy the very plants, animals, land, water, and scenic values which we are trying to protect.
I added a link to this article on offshore wind turbine spacing to the wind issues page. As turbines become bigger their wakes become bigger and that leads to a reduction of output at any existing turbine that is too close. “An important new working paper from renewables consultants ArcVera is reporting that the wake effects behind the huge turbinesthat are now coming onstream are going to be much worse than previously thought.”
Other Articles of Interest
There were a couple of other articles that were interesting but inappropriate for my pages.
Science and religion belong to separate domains. Science is empirical, falsifiable and logical, where later scientists “stand on the shoulders” of the earlier. It constitutes the finest achievement of Western civilization. The Tenth Climate Commandment’s prohibition against debate leads to the death of science, when science is replaced by an ideology that justifies its authority by its order not to question. This is the same claim which religions have made through the ages. As the Roman poet Horace warns: “vestigia terrent”- the footprints are frightening
The implementation plan for New York’s Climate Leadership and Community Protection Act (Climate Act) “Net Zero” target (85% reduction and 15% offset of emissions) by 2050 is being developed. Here is a question for the Climate Action Council. How do you expect to avoid the affordability and reliability issues evident in Europe occurring as their net-zero policies are implemented?
I have written extensively on implementation of the Climate Act and submitted extensive comments on the Draft Scoping Plan. Everyone wants to do right by the environment to the extent that efforts will make a positive impact at an affordable cost. Based on my analysis of the Climate Act I don’t think that will be the case. I believe that the ambitions for a zero-emissions economy outstrip available renewable technology such that the transition to an electric system relying on wind and solar will do more harm than good. The opinions expressed in this post do not reflect the position of any of my previous employers or any other company I have been associated with, these comments are mine alone.
Climate Act Background
The Climate Act established theClimate Action Council who is responsible for preparing the Scoping Plan that will “achieve the State’s bold clean energy and climate agenda”. They were assisted by Advisory Panels who developed and presented strategies to meet the goals. Those strategies were used to develop the Integration Analysis prepared by New York State Energy Research and Development Authority (NYSERDA) and its consultants that quantified the impact of the strategies. That analysis was used to develop the Draft Scoping Plan that was released for public comment on December 30, 2021 and will be finalized in 2022. The Climate Action Council has set up three subgroups to consider alternative fuels, economy-wide strategies to fund the transition, and gas system transition. While I do not deny that these are worthwhile topics, I am disappointed that reliability, feasibility, and affordability are not being explicitly considered. This is of particular concern given the energy affordability and reliability crises underway in Europe.
Great Britain Affordability
Net Zero Watch publishes a newsletter that describes climate and decarbonization policies, what they cost, whether they are delivering and what their real impact is on the environment. Based in Great Britain they are following the affordability impacts of current net-zero energy policy. The latest reports from their newsletter are disturbing.
The Office of Gas and Electricity Markets (OFGEM), supporting the Gas and Electricity Markets Authority, is the government regulator for the electricity and downstream natural gas markets in Great Britain. The energy price cap is a backstop protection from the government for people who default onto their supplier’s basic energy tariff. Ofgem calculates the cap level that suppliers must apply to these tariffs.
According to the Independent, August 27, 2022, the “United Kingdom faces ‘catastrophe’ after energy bills soar 80% amid warning price cap could hit £7,000”. The article notes that:
Regulator Ofgem has revealed that the price cap, which is supposed to protect consumers from unfair energy bill increases, will rise to £3,549 per year for an average household – more than three times last winter’s level. That is expected to leave some 8.9 million households in fuel poverty, charity bosses have said, with a “real risk” that children will go hungry as Britain’s poorest see almost half of their income taken up by gas and electricity.
There also were articles describing the impacts beyond the obvious energy poverty ratepayer effects. The energy caps apply only to consumers but not, for example, health care providers. It has been reported that:
The chief executive of Care England said providers faced a staggering 683 per cent increase in energy costs during the past 12 months, with bills expected to rise again early next year. For gas and electricity, the costs were £660 per bed, per year, this time last year; this week, care providers have to pay an astonishing £5,166.
The Daily Telegraph writes that this is not just a problem for low-income people. In an interview with the Telegraph, Nadhim Zahawi said that “support cannot be confined to families on benefits and added that gas prices could remain punishingly high for two years.” He went on to say: “If you are a senior nurse or a senior teacher on £45,000 a year, you’re having your energy bills go up by 80 per cent and will probably rise even higher in the new year – it’s really hard”.
An editorial in the Wall Street Journal brings home the impacts of these high prices. It notes that the latest price increases bring the average household’s annual bill to £3,549 and that the median household income is £31,400. That means that for half of the households if their average annual budget for central heating, cooking, and keeping the lights on is equal to the average that the percentage of income spent on energy is over 11%. New York has an energy poverty target of only 6% so if the adverse affordability effects of New York net-zero implementation are anyway similar then we can expect a major increase in the number of households in energy poverty.
German Reliability
Writing at No Tricks Zone, P. Gosselin translates an article from Die kalte Sonne. He explains that Germany’s massive, subsidized expansion of electricity generation from renewable sources has squeezed conventional generation units out of the market. Two experts warn of growing grid instability.
The conclusion of the two is very alarming. Here, too, not a word about “storage facilities galore. Here, reality clashes with the wishful thinking of some green energy protagonists who think there is enough storage and that all that needs to be done is to change the “mindset,” as Patrick Graichen put it.
The continued expansion of highly volatile renewable energy sources and the further displacement of more conventional generation units from the market are making the power grid increasingly sensitive to weather-related fluctuations. Unusual weather phenomena such as dark doldrums pose significant challenges to the security and stability of supply to the power grid. The largely intermittent output of solar and wind farms does not correlate with fluctuations in electricity demand.
The excess supply of renewable energy should be buffered during periods of low electricity demand, and the stored capacity should be injected back into the grid during periods of high electricity demand when fewer renewable sources are available. However, large battery energy storage systems, which have been promisingly announced, are still not on the horizon due to their low capacity and maturity, as well as their exorbitantly high cost of deployment.”
At this point, at the latest, some people’s ears should be ringing:
As long as economic energy storage systems are not established, even proponents of the current direction of Germany’s energy transition will have to admit that reliable conventional power plants will be needed for a long time to come.”
This article is also an urgent reading recommendation for politicians and experts who like to be interviewed.
The authors also conclude:
The importance of nuclear power plants for security of supply in base-load operation and their and their ability to operate the grid in parallel with renewable renewable energies have been demonstrated. The nuclear power plants appear to be well suited for the energy made to achieve the future goal of carbon-free power generation. However, the Atomic Energy Act foresees an early end to nuclear power generation by the end of 2022.”
So without nuclear power in Germany, grid stability problems are a future certainty.
Conclusion
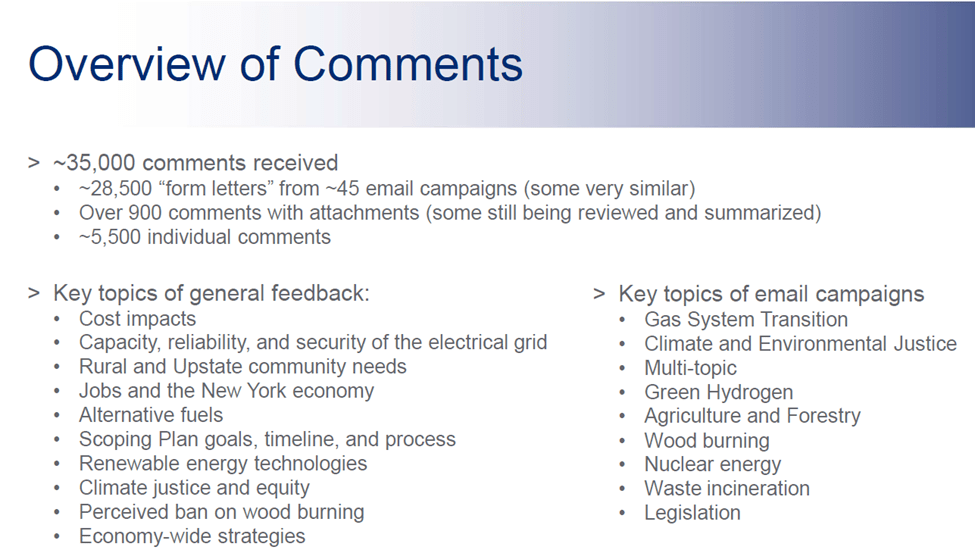
At the August 23, 2022 Climate Action Council meeting some of the comments were discussed. Among the 35,000 comments submitted were around 900 with attachments including “some still being reviewed and summarized”. There was no mention of a couple of points I raised in comments about specific Climate Act mandates including one for the Climate Action Council to consider results from other jurisdictions and another for the New York Public Service Law § 66-p. “Establishment of a renewable energy program” safety valve conditions for affordability and reliability. In order to address both mandates the Climate Action Council should respond to the question: How do you expect to avoid the affordability and reliability issues evident in Europe occurring as their net-zero policies are implemented?
I don’t think there is any way to avoid the issues seen in Europe. So, I have to wonder whether the Climate Action Council is willfully or naively ignoring the energy crisis as it unfolds. In any case failure to account for the issues will ensure that New York goes over the same cliff.
The implementation plan for New York’s Climate Leadership and Community Protection Act (Climate Act) “Net Zero” target (85% reduction and 15% offset of emissions) by 2050 is underway. Prior to the August 23 the Climate Action Council meeting I posted a prediction for the “Public Comments Summary and Proposed Process for Integration” agenda topic. This post is a forecast verification based on the meeting presentation slides. I will update this more when the video for the meeting is posted.
I have written extensively on implementation of the Climate Act and submitted extensive comments on the Draft Scoping Plan. Everyone wants to do right by the environment to the extent that efforts will make a positive impact at an affordable cost. Based on my analysis of the Climate Act I don’t think that will be the case. I believe that the ambitions for a zero-emissions economy outstrip available renewable technology such that the transition to an electric system relying on wind and solar will do more harm than good. The opinions expressed in this post do not reflect the position of any of my previous employers or any other company I have been associated with, these comments are mine alone.
Climate Act Background
The Climate Act established theClimate Action Council who is responsible for preparing the Scoping Plan that will “achieve the State’s bold clean energy and climate agenda”. They were assisted by Advisory Panels who developed and presented strategies to meet the goals. Those strategies were used to develop the Integration Analysis prepared by the New York State Energy Research and Development Authority (NYSERDA) and its consultants that quantified the impact of the strategies. That analysis was used to develop the Draft Scoping Plan that was released for public comment on December 30, 2021 and will be finalized in 2022. The Climate Action Council has set up three subgroups to consider alternative fuels, economy-wide strategies to fund the transition, and gas system transition. While I do not deny that these are worthwhile topics, I am disappointed that reliability, feasibility, and affordability are not being explicitly considered.
Climate Action Council Meeting August 23, 2022
The agenda and meeting information are available in the 2022 Climate Action Council Meetings section of the Climate Act Materials and Meetings website. In the previous post, I predicted that the agenda item discussing public comments would make the number of posts a point of emphasis, will undoubtedly count the comments in favor and make a big deal that the majority of the comments support the Draft Scoping Plan approach. The number of posts was a point of emphasis in the following slide but the slides did not provide a scorecard of comments in favor relative to the comments opposed. So I was only half right.
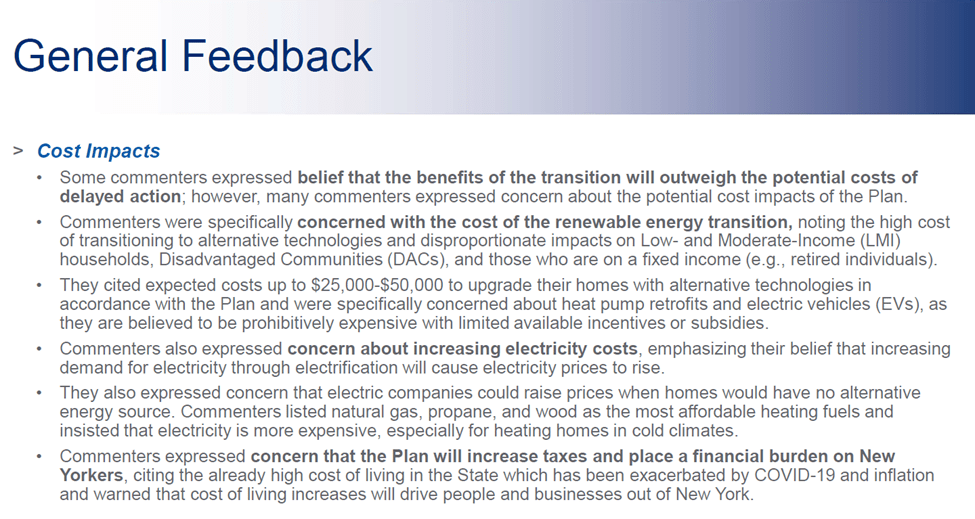
The slides summarized the feedback received. There were cost impact concerns as shown in the following. It will be interesting to see if the Council responds to the issues raised or just decides that they need to do more advertising to convince people that these issues are not real.
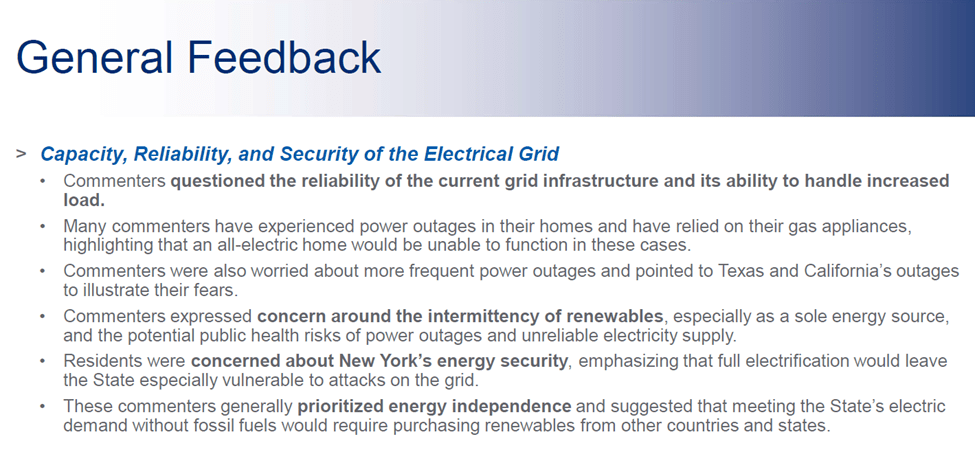
Capacity, reliability, and security of the electric grid issues were raised. I have often written about those issues so will be very interested to see how the council handles them,
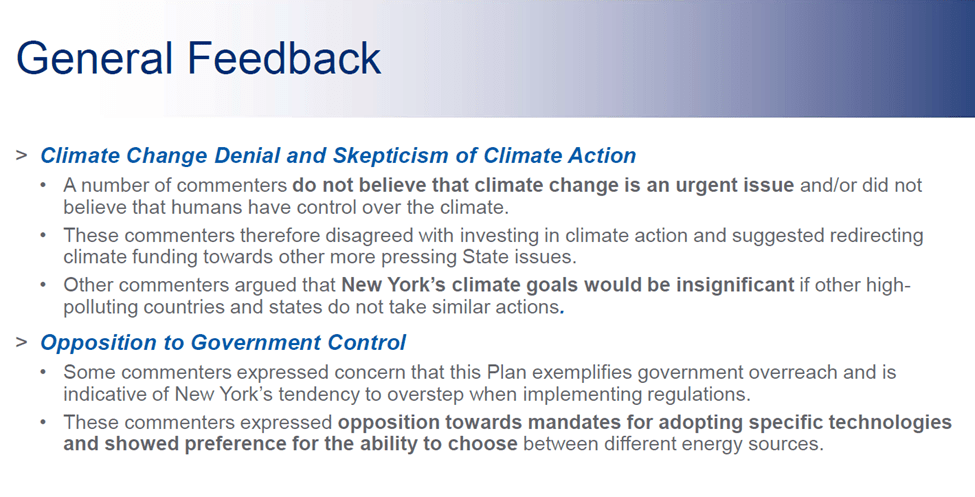
The presentation also described comments made about “Jobs and the New York economy”, “Alternative fuels”, “Scoping Plan goals, timeline and process”, “Renewable energy technologies”, “Climate justice and equity”, “Perceived ban on wood burning”, “Economy-wide strategies”, and Sector-specific feedback”. Frankly, the commenters who supported the Draft Scoping Plan descriptions of these topics are naïve in my opinion and just parroted the talking points of special interest groups. Many valid concerns were raised on these topics.
While the descriptions are mostly unbiased, I also got the impression that comments contrary to the narrative were not taken seriously and will be dismissed. This is most evident in the following slide with the description climate change denial. Denial in this context is a pejorative term equating anyone who does not accept the climate change science narrative of the Climate Act and Draft Scoping Plan as the same as those that do not accept the Holocaust. Drawing a similarity to a scientific theory with the documented horrors of the holocaust is an insult and inappropriate in the presentation. Also consider that one of the descriptions highlights the argument that some said New York’s climate goals would be insignificant if other jurisdictions do not take similar actions. My concern is what happens to this point now? Will the Final Scoping Plan provide a calculation showing the impact of New York’s climate goals relative to other jurisdictions or will the response just be blown off?
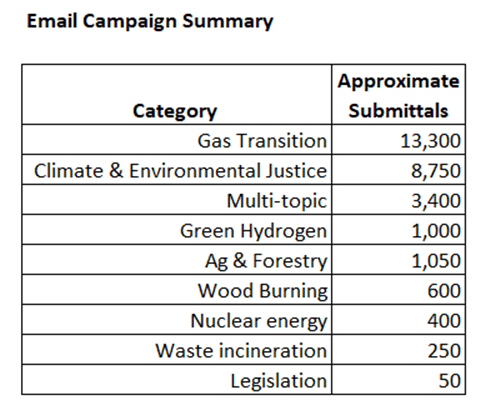
The remaining descriptions of the comments addressed the 28,500 email campaign categories. Forty five organizations developed a form letter and had their members submit a form letter using their template. All of these letters represent special interest of one form or other. The campaigns were separated into nine categories: gas transition, climate & environmental justice, multi-topic, green hydrogen, agriculture & forestry, wood burning, nuclear energy, waste incineration, and legislation. I will break down the numbers below but if you wonder what the special interest campaigners were exercised about then I refer you to these summaries.
The slides did list the approximate number of commenters in each of the campaigns. I have summarized the interesting totals below. For example consider the 13,300 gas transition comments that expressed support about doing something about climate change but basically said they were not willing to give up natural gas. There was an email campaign (~ 500 submissions) in the multi-topic category that similarly expressed support for climate change action but said that it “Must strike the right balance between protecting our planet and safeguarding our economy”. I think that could be taken to mean that they are not willing to take hits to the economy they think are inherent in the Climate Act. There was similar support with conditional concerns with the agriculture and forestry commenters. Amazingly to me, if all those comments can be categorized as we don’t support the current content of the Draft Scoping Plan, then half the comments were against. I fully expected that a clear majority of comments would support the Draft Scoping Plan transition plan for the Climate Act so predicted that would be highlighted. That was not the clearcut case and could be the reason that no scorecard was presented.
It is notable that no email campaign addressed the electric vehicle mandate. It is not surprising because all the car companies have signed on to do electric vehicles and the government support for electric vehicle purchases means they can raise prices commiserate with those subsidies. I am convinced however, that most people Upstate have no intention of switching to an electric car as their primary mode of transportation and were simply unaware of the opportunity to comment. I imagine if there was some organization that asked people to submit a comment against the requirement to lose the ability to purchase an internal combustion engine by 2035 that the submittals against that component would be overwhelming.
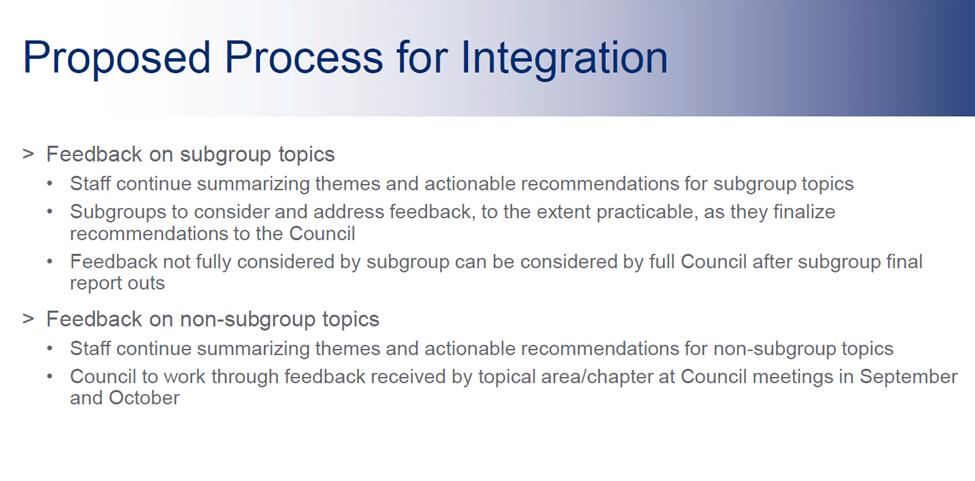
When I described my predictions, I outlined what I thought should be done if the Council really wants to integrate public comments and predicted that it would not be included. I said the comments have to be provided in a searchable database for the Council and public as soon as possible. The comments have to be categorized into specific topics for the Council with a summary of the issues raised with an emphasis on substantive issues. The proposed process for integrating the comments slide makes no mention of a database. The staff will summarize themes which is equivalent to categorizing the comments. The slide says that staff will continue developing actionable recommendations which I guess relates to my substantive issues. However, the slide presentation to the Council did not highlight issues that must be addressed. Maybe that occurred during the discussion but that review will have to wait until the video recording is available and I have to review it.
One final point about the presentation. The initial slide mentioned that 900 comments included attachments and that some of those are still being reviewed and summarized. The only way to provide substantive comments is by using attachments. There was no mention of comments submitted by the New York Independent System Operator (NYISO) or New York State Reliability Council. The staff summary of those comments should be highlighted to the Council members and the fact that no slide highlighted their comments suggests to me that haven’t been reviewed yet.
At some point I should discuss the section of the presentation that described continuing Integration Analysis work. It is a problem for me that this work has been going on apparently absent comment input. I think the NYISO comments would be directly relevant to the Integration Analysis work but there was no suggestion of that. The presentation claimed that benefits out-weighed the costs but I submitted comments that directly contradicted that. I described the games played to be able to conclude that “The cost of inaction exceeds the cost of action “. The reality is that the benefits are imaginary but the costs are real and the Integration Analysis that provides the basis of the Draft Scoping Plan consistently over-states benefits and under-estimates the costs. Shouldn’t the Council know that there were comments on that specific topic or will my comments be ignored because there was only one comment that said that?
Conclusion
There is no indication that any comment that is not consistent with the Draft Scoping Plan narrative will be incorporated into the Final Scoping Plan. Given the schedule and the approach outlined at the meeting, I doubt that the Council will ever hear about those comments, much less discuss why they should be ignored.
The Climate Action Council has to make a case that a net-zero electric system will work and to date they have totally ignored that analysis. Francis Menton recently summarized the issues with such a transition and concluded that it will never work. I have little faith that the current administration is going to address the issues he raises. I only hope that the folks who are foisting this travesty on the state will be in some way held accountable when the plan fails.
I am on the road and don’t have the ambition to develop a long post so this will be a short one. The implementation plan for New York’s Climate Leadership and Community Protection Act (Climate Act) “Net Zero” target (85% reduction and 15% offset of emissions) by 2050 is underway. On August 23 the Climate Action Council meeting agenda includes an item for “Public Comments Summary and Proposed Process for Integration”. This post provides my prediction for that item.
I have written extensively on implementation of the Climate Act. Everyone wants to do right by the environment to the extent that efforts will make a positive impact at an affordable cost. Based on my analysis of the Climate Act I don’t think that will be the case. I believe that the ambitions for a zero-emissions economy outstrip available renewable technology such that the transition to an electric system relying on wind and solar will do more harm than good. The opinions expressed in this post do not reflect the position of any of my previous employers or any other company I have been associated with, these comments are mine alone.
Climate Act Background
The Climate Act established theClimate Action Council who is responsible for preparing the Scoping Plan that will “achieve the State’s bold clean energy and climate agenda”. They were assisted by Advisory Panels who developed and presented strategies to meet the goals. Those strategies were used to develop the Integration Analysis prepared by the New York State Energy Research and Development Authority (NYSERDA) and its consultants that quantified the impact of the strategies. That analysis was used to develop the Draft Scoping Plan that was released for public comment on December 30, 2021 and will be finalized in 2022. The Climate Action Council has set up three subgroups to consider alternative fuels, economy-wide strategies to fund the transition, and gas system transition. While I do not deny that these are worthwhile topics, I am disappointed that reliability, feasibility, and affordability are not being explicitly considered.
Climate Action Council Meeting August 23, 2022
The agenda and meeting information are available in the 2022 Climate Action Council Meetings section of the Climate Act Materials and Meetings website. At some point a recording for the meeting will be posted on the site. I will eventually do a post to see if my forecast for what I think will happen verifies.
Public Comments Summary and Proposed Process for Integration
Proposed Process for CJWG Feedback Integration
Proposed Process for Disadvantaged Communities Barriers & Opportunities Report Integration
Next Steps
Most of these discussions will be perfunctory. The subgroup progress reports will give vague updates of the work to date. The primary issue with these topics is that there is no way to reconcile different opinions so I doubt that they will add value to the process. It is intriguing that work on the Integration Analysis has been going on. It will be interesting to see what topics were addressed.
Given that I submitted 27 comments totaling 356 pages I am particularly interested in the process for handling Draft Scoping Plan comments. In previous meetings Agency staff has talked about the volume of comments. I predict that the summary agenda item will make that a point of emphasis, will undoubtedly count the comments in favor and make a big deal that the majority of the comments support the Draft Scoping Plan approach. Of course, this ignores the fact that most people in the state are unaware of any of the details of the plan and did not submit comments.
If the Council really wants to integrate public comments, then the process should include the following. The comments have to be provided in a searchable database for the Council and public as soon as possible. The comments have to be categorized into specific topics for the Council with a summary of the issues raised. It is unreasonable to expect that the Council and the public should have to figure out the substantive issues on their own. Instead I predict that the comments will be available in a list, perhaps consolidated somewhat for the obvious form letters. It might be searchable but that will be the extent of the accessibility concession.
I have become so cynical of the process that I believe the last two environmental justice topics will just be treated as window dressing. Any overlap with Administration priorities this election year will be highlighted and any inconsistencies will be ignored.
Conclusion
If the State really was planning to integrate public comments, then the process would have been on-going. As issues were raised in the comments those that were impactful should have been passed on to the Council. With only a couple of months left before the Final Scoping Plan has to be drafted there simply is not time to understand all the comments much less for meaningful integration of them.
I hope I am wrong but I am not holding my breath that the plan for integrating comments will actually address substantive comments. I expect that my comments will be acknowledged but I doubt that they will be considered.
There is an immense amount of work that needs to be done to implement New York’s Climate Leadership and Community Protection Act (Climate Act) “Net Zero” target (85% reduction and 15% offset of emissions) by 2050. It is very difficult to grasp all the different ways that this transition is going to affect all New Yorkers. Despite the lack of a reliability and affordability feasibility analysis an army of government bureaucrats are developing transition plans to change our energy choices assuming that everything will work out. This article talks about just one of those efforts.
I have written extensively on implementation of the Climate Act. Everyone wants to do right by the environment to the extent that efforts will make a positive impact at an affordable dollar cost. Based on my analysis of the Climate Act I don’t think that will be the case. I believe that the ambitions for a zero-emissions economy outstrip available renewable technology such that the transition to an electric system relying on wind and solar will do more harm than good. The opinions expressed in this post do not reflect the position of any of my previous employers or any other company I have been associated with, these comments are mine alone.
Climate Act Background
The Climate Act established theClimate Action Council who is responsible for preparing the Scoping Plan that will “achieve the State’s bold clean energy and climate agenda”. They were assisted by Advisory Panels who developed and presented strategies to meet the goals. Those strategies were used to develop the Integration Analysis prepared by the New York State Energy Research and Development Authority (NYSERDA) and its consultants that quantified the impact of the strategies. That analysis was used to develop the Draft Scoping Plan that was released for public comment on December 30, 2021 and will be finalized in 2022. At the same time this process is underway various state agencies are already implementing regulations for the transition. The problem is that the Scoping Plan is just a guide and does not include a reliability feasibility analysis or any affordability specifics about the costs for the transition. Couple that with the fact that many New Yorkers are unaware of the Climate Act much less its implications suggest to me that this that public blowback will be immense when the realization of what is required becomes obvious.
Gas Planning Procedures
In order to explain what is going on I will provide background information for this example. The New York State Department of Public Service (DPS) Case 20-G-0131 – Proceeding on Motion of the Commission in Regard to Gas Planning Procedures “seeks to establish planning and operational practices that best support customer needs and emissions objectives while minimizing infrastructure investments and ensuring the continuation of reliable, safe, and adequate service to existing customers.” The Background for the order instituting the proceeding follows with my explanations:
Gas utilities in several regions of New York State have recently claimed supply constraints that may prevent them from accepting applications for new firm service. LDCs have invoked moratoria on new service connections in some locations, leading in some cases to customer hardships. In resolving the moratorium invoked by KEDNY and KEDLI, the Commission-adopted settlement requires those LDCs to develop a “Long-Term Capacity Report” to address the long-term capacity constraints affecting their operations.
This refers to gas utility load distribution company (LDC) issues. A footnote to this section explains that:
On January 17, 2019, Consolidated Edison Company of New York, Inc. (Con Edison) notified the Commission of a moratorium on new firm gas service in most of Westchester county, commencing March 15, 2019. Beginning November 2018, The Brooklyn Union Gas Company d/b/a National Grid NY (KEDNY), serving Brooklyn and parts of Queens, and KeySpan Gas East Corporation d/b/a National Grid (KEDLI) (collectively, National Grid) began informing large applicants for new service that National Grid would be unable to provide firm service unless a pending supply project was approved. As of May 15, 2019, National Grid stated that it would not fulfill applications for new firm service connections, or requests for additional firm load from existing customers on Long Island, including Queens and Brooklyn. Based on a settlement adopted and approved by the Commission, National Grid ended its moratorium as of November 26, 2019. Case 19-G-0678, Proceeding on Motion of the Commission to investigate Denials of Service by National Grid, Order Adopting and Approving Settlement (issued November 26, 2019); Case 19-G-0678, supra, Confirming Order (issued December 12, 2019). Additionally, New York State Electric and Gas Corporation (NYSEG) has declared a moratorium on new gas customer attachments in the Town of Lansing, in Tompkins County in February 2015.
In other words, there have been examples where people who want to hook up to natural gas have not been allowed to get service. This is the crux of the gas transition problem. The net-zero transition to natural gas alternatives means that at some point the choice to use natural gas will no longer be an option. The Background goes on:
These circumstances demonstrate that conventional gas planning and operational practices adopted by natural gas utilities have not kept pace with recent developments and demands on energy systems. Gas utilities need to learn from recent experience and adopt improved planning and operational practices that enable them to meet current customer needs and expectations in a transparent and equitable way while minimizing infrastructure investments and maintaining safe and reliable service. Additionally, planning must be conducted in a manner consistent with the recently enacted Climate Leadership and Community Protection Act (CLCPA).
Implicit in this is that customer choice will have to be limited. I do not believe that many New Yorkers understand that this transition is coming at them. The Background notes:
Moratoria can create adverse customer impacts, as they prevent at least some applicants from receiving firm gas service. Some types of development projects can utilize viable alternatives to firm gas service, if they are practically available. Others, however, may have more difficulty without firm gas service. Additionally, reliance on alternatives can have emission impacts. Reduced emissions impacts may result where the alternative to gas is efficient use of clean electricity, while increased emission impacts may result where the alternative to gas is oil or propane.
If viable alternatives were available, and by that, I mean affordable above all, then applicants would be choosing them willingly. I published a post describing the comments on the Draft Scoping Plan submitted by a small manufacturer in Rochester who replacing equipment that is powered by natural gas now would cost over a million dollars and said that his company could not afford that conversion. I will quote one last paragraph from the Background:
Given these potential impacts, the public interest demands that gas utilities provide information to and communicate with customers in a way that promotes effective customer planning, reduces confusion, and avoids inequities or the appearance of inequities. Similarly, the public interest demands that gas utilities provide information to and communicate with the Department, with other government entities and agencies, and with stakeholders, so as to promote effective planning and best consideration of alternatives, thus benefiting costs, emissions, and economic development.
What this means is that the DPS and gas utilities in the state are grappling with a tradeoff between providing safe and reliable natural gas to existing and new customers at the same time the Climate Act net-zero transition calls for the natural gas system to be shut down or transitioned to use something other than natural gas. A presentation at a recent meeting of the Avoided Cost of Gas Working Group offers some insight into the practical considerations that Albany bureaucrats are starting to deal with and are completely unknown to most natural gas consumers despite the public interest in this topic.
Avoided Cost Working Group First Meeting
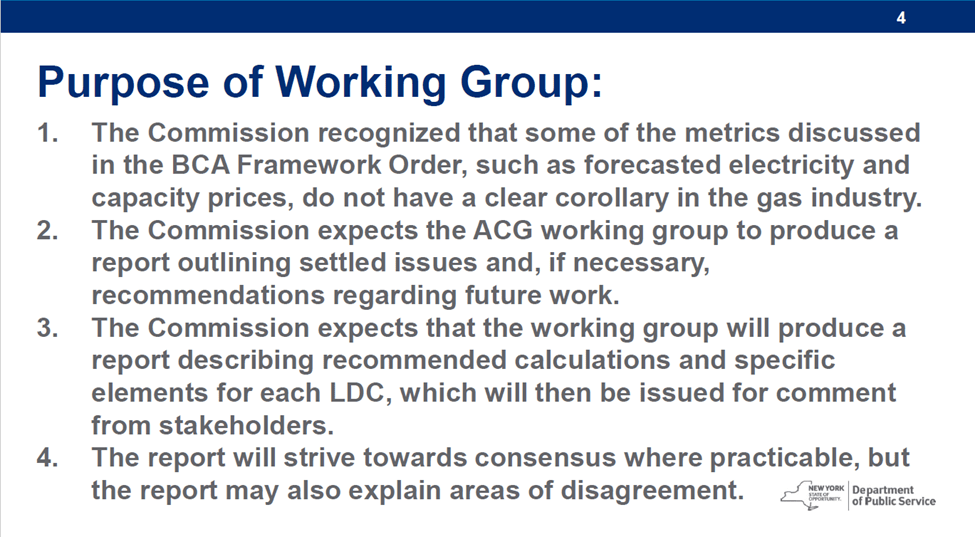
On July 6, 2022 the Avoided Cost Working Group (ACWG) met for the first time. The presentation described the purpose of the group in the following slide. The Benefit Cost Analysis Framework Order required Department of Public Service staff to develop a white paper on benefit cost analysis. That process did not address gas industry issues. This workgroup is supposed to provide the Commission with a report describing recommended calculations and specific elements for each LDC, which will then be issued for comment from stakeholders.
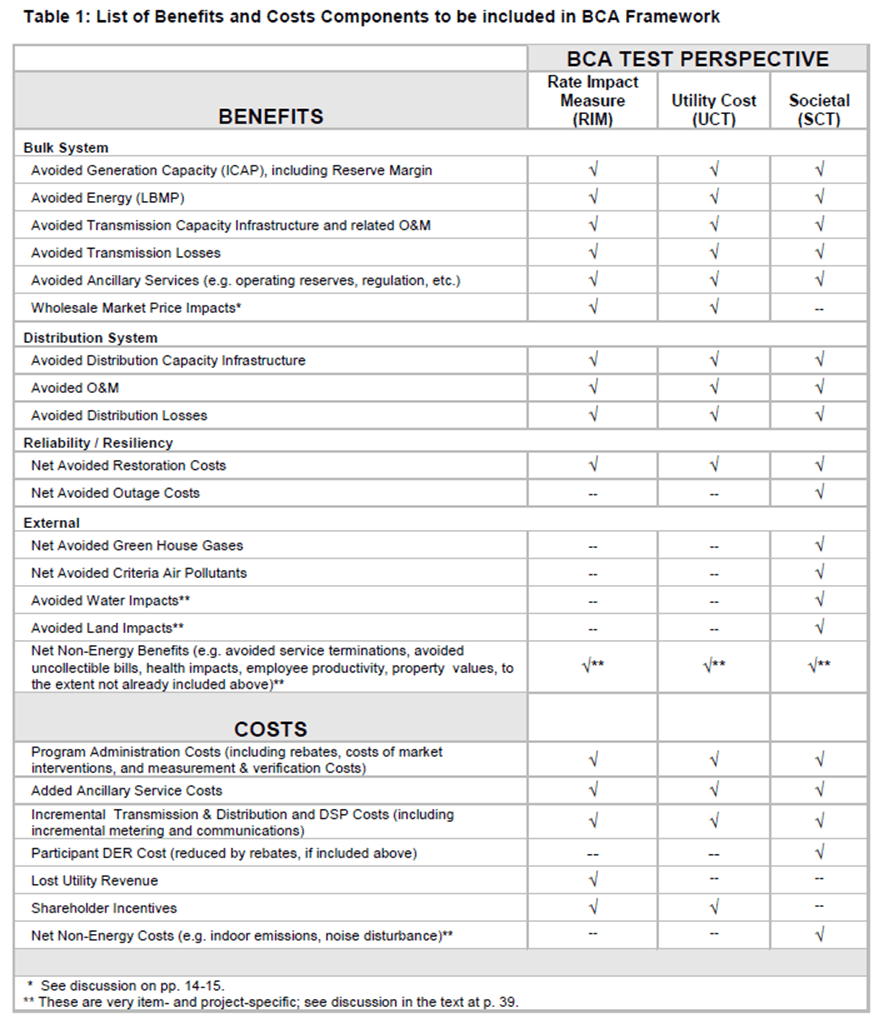
The BCA white paper included the following list of benefit and costs components to be included in the framework. The workgroup will be adjusting the calculations for the gas industry but there are no plans for changes to the list.
The first meeting discussed the plan to address four main topics. They want to determine the avoided bulk system costs for the gas commodity, the costs necessary to meet peak loads and pipeline capacity costs. Another topic is avoided distribution costs for the high, medium, and low-pressure components of the pipeline system. There has been much discussion about the use of renewable natural gas and they want to determine what qualifies for that label. The final topic is the subject of leaks in the system. As monitoring technology has improved more leaks have been found and this has been a point of contention on the Climate Action Council.
Avoided Cost Working Group Second Meeting
The second meeting of the ACWG on August 4 included two presentations. The first presentation from the DPS staff discussed the typical non-pipelines alternatives process. This is another of the Climate Act magical solutions where an existing fossil-fuel service can supposedly be replaced by an alternative that will not affect reliability or affordability. National Grid provides a summary of the approach:
Non-Pipeline Alternatives (NPA) is the inclusive term for any targeted investment or activity that is intended to defer, reduce, or remove the need to construct or upgrade components of a natural gas system, or “pipeline investment.”
These NPA investments are required to be cost-effective compared to the infrastructure investment and are required to meet the specified gas system need. An NPA can include any action, strategy, program, or technology that meets this definition and these requirements.
Some technologies and methodologies that can be applicable as an NPA investment include demand-side measures, such as demand response, sewer heat recovery, advanced controls strategies, new business models, energy efficiency or electrification. Additional technologies may be feasible as a demand-side NPA. NPA projects can include these and other investments individually or in combination that meets the specified need. A benefit-cost analysis (BCA) will be used to determine the cost-effectiveness of the NPA project.
In my opinion there are a lot of assumptions and biases that can skew the NPA study to prove whatever the utility wants and, in order to survive and make their earnings targets, that will be what the PSC wants. The Administration’s response to public input leans to whatever constituency the Administration wants to please rather than what is best for the majority or the strength of adverse comments.
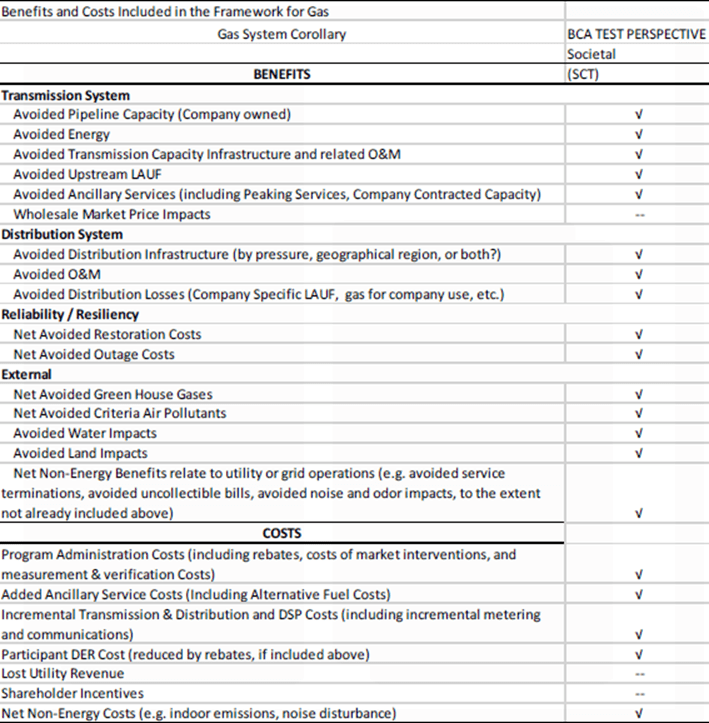
The DPS presentation outlined the process for a NPA study, reviewed the list of benefit and costs components and presented a list applicable to the natural gas system. I don’t think there is anything particularly controversial or, frankly, of interest to the general public.
The second presentation by staff from New York State Energy Research & Development (NYSERDA) and their consultant Energy + Environmental Economics (E3) described the work done to date in the Integration Analysis and Draft Scoping Plan. They gave an overview of the Avoided Cost of Gas (ACG) framework developed by E3 for NYSERDA and DPS in 2020, provided insights into other “Future of Gas” projects E3 has contributed to since 2020 , and presented key similarities and differences with the ACG framework.
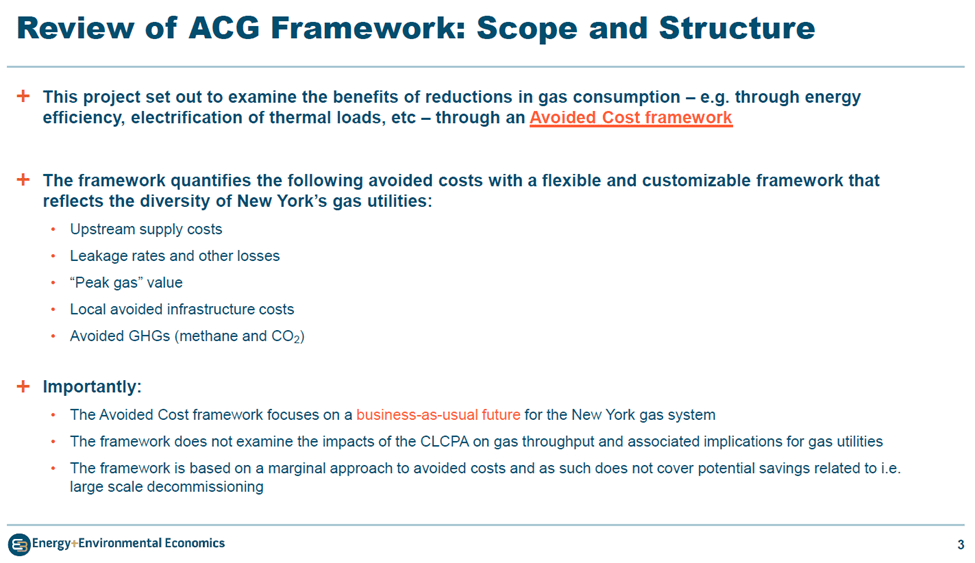
The following slide is an overview of the approach. E3 has set up a model that quantifies avoided costs that will be used to eventually justify the transition of New York’s natural gas system to net-zero consistent with the Climate Act. At this time the framework has only focused on business-as-usual and has not been used to examine the impacts of the Climate Act. It quantifies the following avoided costs:
Upstream supply costs
Leakage rates and other losses
“Peak gas” value
Local avoided infrastructure costs
Avoided GHGs (methane and CO2)
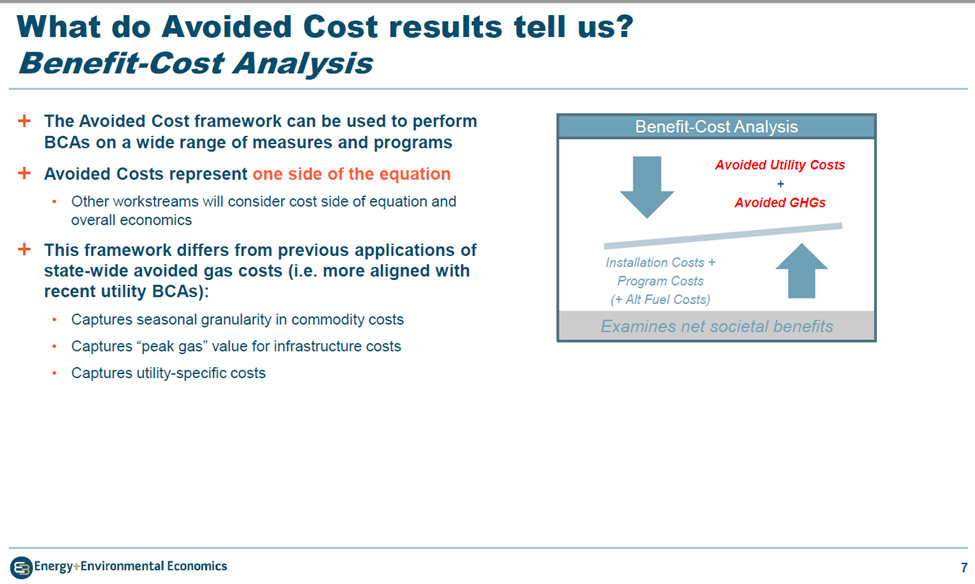
The presentation describes the ACG framework approach. The following slide explains what the avoided costs results tell us. The costs include installation, program and fuel costs. The benefits include avoided utility costs and the alleged benefits of avoided greenhouse gas emissions. Noticeably absent, in my opinion, is consideration of added costs to customers. For example, the aforementioned small manufacturer in Rochester uses natural gas because it is the best alternative for his processes. Any alternative is going to add costs not included. In my case, I value natural gas because it is extremely reliable. In the 41 years I have lived in my home there never has been a natural gas outage. There were two long duration electric blackouts including one due to an ice storm that we survived because I can provide electricity to my furnace and keep the house warm. This approach ignores these impacts and benefits.
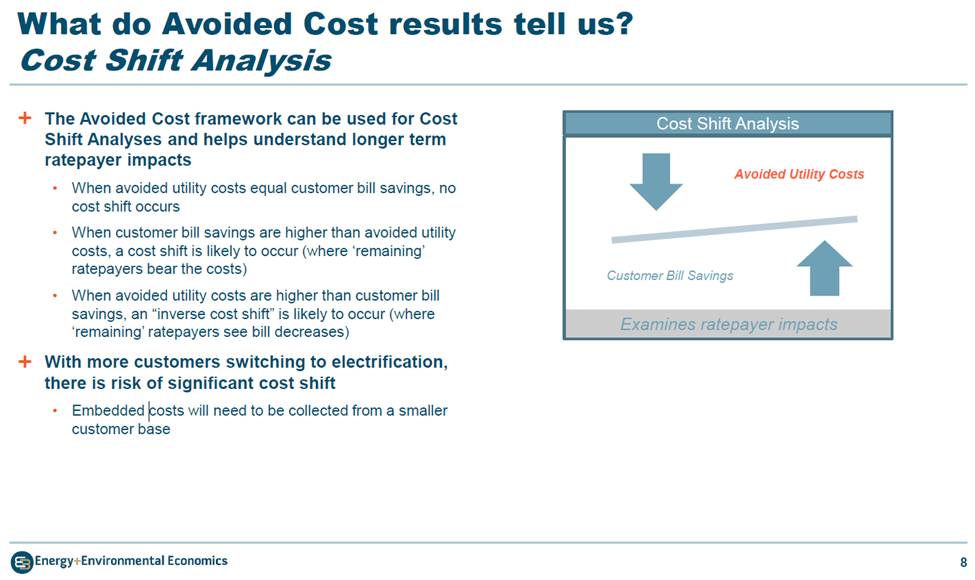
The presentation goes on to discuss cost shift analyses in the next slide that will “help understand longer term ratepayer impacts”. At this point transition complications start to become evident. If the utility avoided costs lead to bill savings, then no cost shift occurs. The slide explains that if customer bill savings are higher than avoided utility costs, a cost shift is likely to occur. In that case the first adopters make out by saving money but the ‘remaining’ ratepayers have to cover more system costs and will see their costs rise. It may be that avoided utility costs could be higher than customer bill savings so an “inverse cost shift” is likely to occur where ‘remaining’ ratepayers see bill decreases. However, the slide concludes that “With more customers switching to electrification, there is risk of significant cost shift” because “embedded costs will need to be collected from a smaller customer base”.
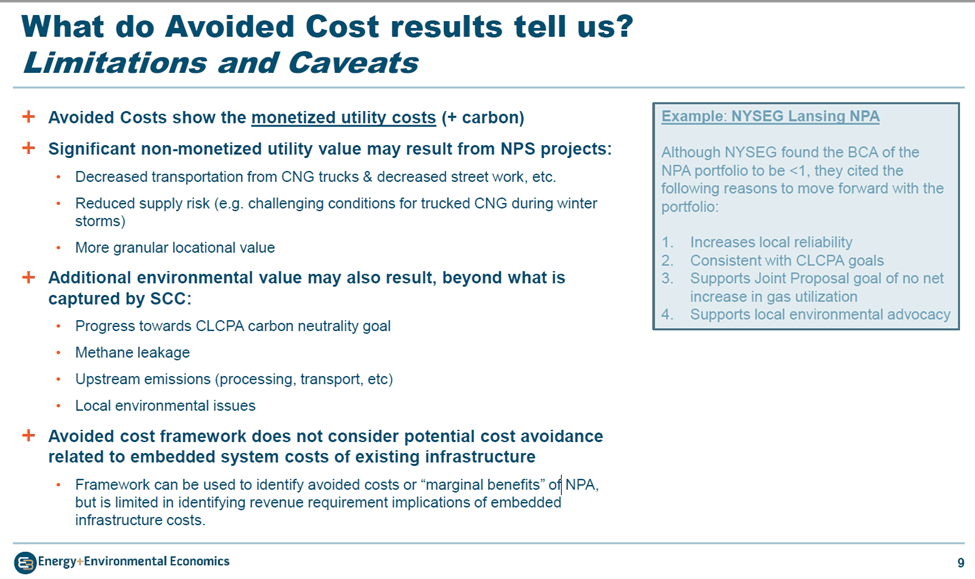
The next slide explains what the consultants want you to know about the avoided cost results. The avoided costs outputs show the monetized utility costs plus the carbon costs. They claim that significant non-monetized utility value may result from NPA projects but the examples shown are pretty weak in my opinion. They also claim that additional environmental value may also result, beyond what is captured by the social cost of carbon metric all the while ignoring that those costs are buried in the New York version of the social cost of carbon metric. Finally, they note that the avoided cost framework does not consider potential cost avoidance related to embedded system costs of existing infrastructure.
Of particular interest is the example given. After a long description of the values of the BCA approach for non-pipeline alternatives the thumb on the scale is evident. Even though the example NPA found a negative benefit cost ratio the utility went ahead and did it anyway! The BCA approach includes many value judgements despite its quantitative output. At the end of the day the State and the utility made more value judgements to justify going ahead to implement an alternative to adding natural gas infrastructure. The cited the following reasons. They claim that it will increase local reliability but that does not consider the fact that the natural gas system is much more reliable than the electric system. Going ahead may be consistent with Climate Act goals but that criterion suggests that all this is window dressing. The third rationale is that it “Supports Joint Proposal goal of no net increase in gas utilization”. I believe this is a specific component in the utility’s rate case settlement. If true it is incontrovertible proof that New York utilities are forced to meet specific Administration goals to get rate case approval. The final rationale is that it “supports local environmental advocacy”. This is blatant acknowledgement that political appeasement of a preferred political constituency is a consideration in development considerations and that any pretense that the methodology that is supposed to be used is just a sham.
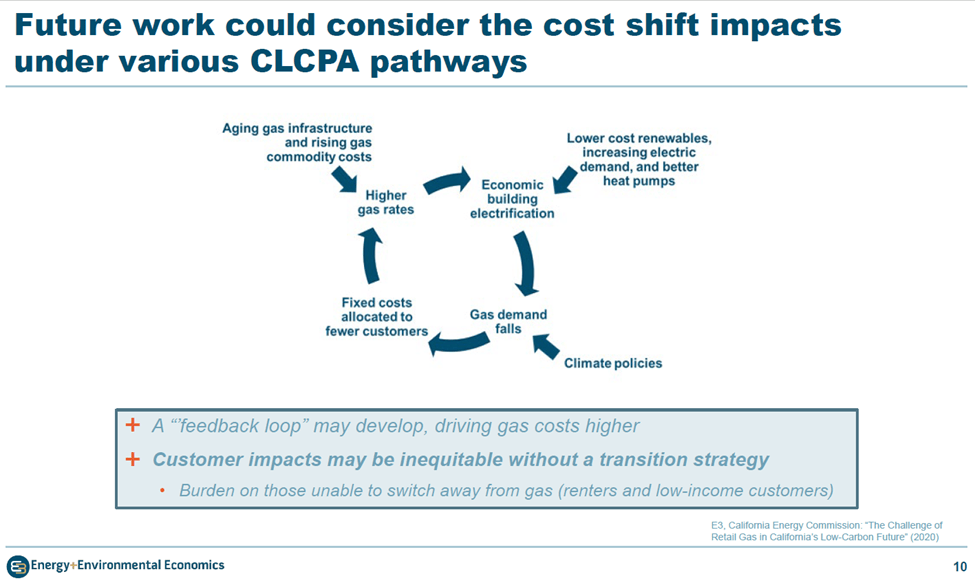
The next slide describes the inter-relationships of cost shift impacts. I want to emphasize the two final points on the slide. There is a possibility that a “’feedback loop” may develop that could drive gas costs higher. In my opinion that kind of feedback is to be expected. It is telling that they admit that customer impacts may be inequitable without a transition strategy and that it will disproportionally affect those unable to switch away from gas (renters and low-income customers). So much for the environmental justice advocacy component of the Climate Act.
The presentation goes on to argue that a structured transition could help to mitigate these impacts. E3 presented results of an analysis for a similar transition program in Massachusetts. I am not going to discuss these results in this post. The bottom line is that they believe that the better approach going forward is to target customer transitions rather than just transitioning natural gas customer use as their appliances age out.
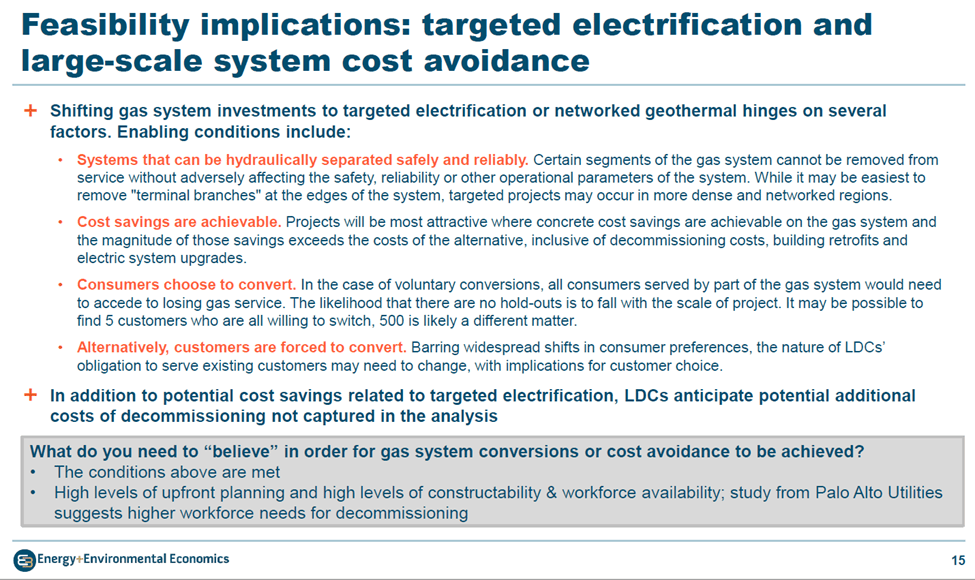
The following slide discusses the factors that affect the feasibility of the transition conversion away from natural gas. I think this is important particularly because this kind of discussion is not included in the Draft Scoping Plan. First there is a concession that the transition to “targeted electrification or networked geothermal hinges on several factors”. Because the natural gas system is inter-connected there are limitations on which segments that can be removed “without adversely affecting the safety, reliability or other operational parameters of the system”. Not surprisingly the consultant analysis keeps the customer satisfied by claiming that cost savings are achievable. However, the slide mentions two caveats relative to customer choice. If voluntary conversions are proposed “all consumers served by part of the gas system would need to accede to losing gas service”. The caveat is that the scale of the project drives the likelihood that there will be holdouts: “It may be possible to find 5 customers who are all willing to switch, 500 is likely a different matter.” The other alternative is to force customers to switch. In that case: “Barring widespread shifts in consumer preferences, the nature of LDCs’ obligation to serve existing customers may need to change, with implications for customer choice.” The second main point is that this feasibility analysis notes that there will likely be additional costs of decommissioning not captured in the analysis.
The slide also includes a highlighted section that asks the question “What do you need to “believe” in order for gas system conversions or cost avoidance to be achieved?” In order for this this to be feasible then the conditions described above have to be met. The other aspect is that “High levels of upfront planning and high levels of constructability & workforce availability” are needed. A study from Palo Alto Utilities also notes there will likely be workforce issues related to decommissioning work. That is a career with a built-in end date so training people for a short career might be a problem. Given that all of these conditions have to be met to achieve the goal I am skeptical that it will be successful.
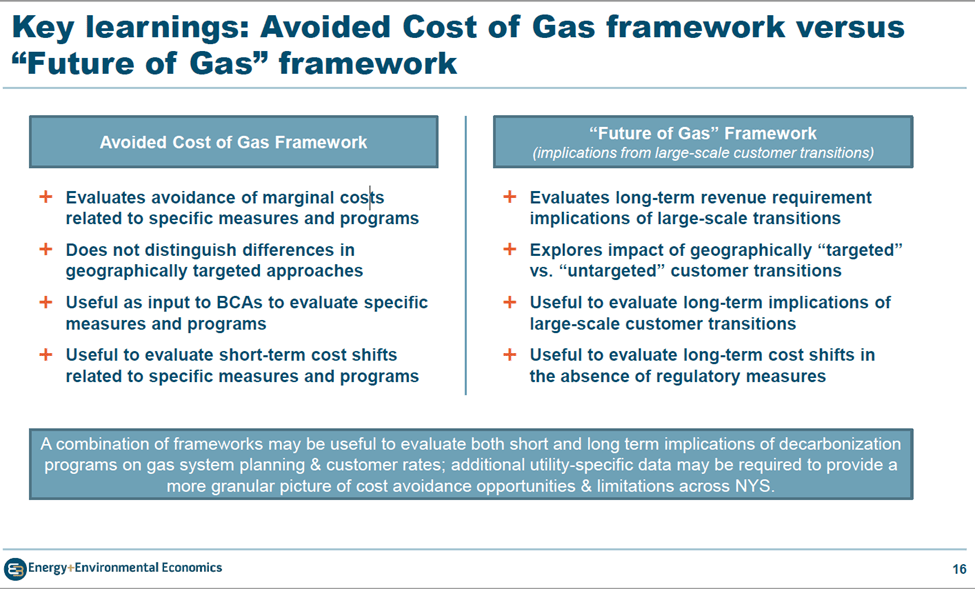
Finally, the presentation described an alternative approach to the avoided cost framework. The Climate Act transition is a mandated large-scale customer transition described in a “Future of Gas” framework. The avoided cost of gas framework appears to me to be better suited for smaller scale transition components. Like it or not New York is stuck with a larger scale transition. The alternate framework evaluates long-term revenue requirement implications for such a transition, considers geographical constraints, considers long-term implications of large-scale customer transitions and can evaluate long-term cost shifts in the absence of regulatory measures. The presentation concludes that ca ombination of these two approaches may be useful.
Discussion
I have always maintained that a fundamental flaw in the Draft Scoping Plan is that it is just a guide and does not include a reliability feasibility analysis or any affordability estimate of the costs for the transition. The point of this article is that the extraordinary effort necessary for New York State to transition to net-zero is underway without that information. Despite the recognized need that providing public information is appropriate, there are many activities going on that are necessary for the transition but are proceeding without significant public oversight. In the first place there are so many components to the transition that no individual or outside organization can follow them all. Notice and documentation of the activities are buried in the DPS DMM: Matter Master that is not user-friendly even to professionals who follow these actions. Even if someone manages to find out about an activity and tracks down the description of the activity, trying to decipher what is in the jargon-filled reports is a challenge. They may be able to claim that there is publicly available information but reality is different.
This article described the transition activities of one aspect of the net-zero transition. In order to meet the net-zero transition targets major changes to the natural gas distribution system are needed. The Avoided Cost Working Group is trying to force fit the natural gas transition analysis into the same framework as was used for the electric system benefit cost analysis. The NYSERDA consultants have suggested that it may be necessary to also include another approach and it remains to be seen whether that will be considered. I get the impression the emphasis is on getting it done rather than taking the time to get it right.
Most importantly, it is clear that there are feasibility issues to the natural gas net-zero transition. The Scoping Plan is only intended to provide a framework for the transition but what if that framework isn’t feasible? With regards to the natural gas transition, the Draft Scoping Plan insinuated that the transition would occur as the appliances aged out. In other words, at some date owners would not be able to replace their broken appliances with a natural gas-fired option. However, it appears that the ACWG is considering options to transition certain segments of the network and is grappling with how to deal with the practical issues associated with that approach. I doubt very much that this will be the only situation where the Scoping Plan implied implementation approach does not past muster as a viable methodology.
I am also troubled by the overt manipulation of the analytical techniques to make them consistent with the Climate Act narrative. The framework analysis depends on a model that is large, includes many value judgements, and has so many variables that it can provide any answer that the Climate Action Council wants. For example, I believe that the modeling approach ignores the benefits of natural gas options and does not include the costs to replace it with other less reliable and affordable options which makes the transition conversion more beneficial than it actually will be. This bias is also evident in the application of the benefit cost analysis methodology. An example is given where the NPA calculation did not project that the benefits would out-weigh the costs. Nonetheless the utility went ahead and chose that option anyway. At some point the public has to ask what is the point of all this if you modify the rules to get the answer you want anyway.
Conclusion
The background for the DPS order for this effort states that “public interest demands that gas utilities provide information to and communicate with customers in a way that promotes effective customer planning, reduces confusion, and avoids inequities or the appearance of inequities”. There is no way that is happening at this time and all indications that it will not occur until it is too late for meaningful public input and the possibility of changing anything significant.
The Administration is controlling the implementation approach for the Climate Act’s net-zero transition. A fundamental assumption in the Climate Act is that this transition is only a matter of political will and there are people involved in this process that actually believe that is the case. This approach over-simplifies the problem and the solution. The lack of a detailed reliability and affordability feasibility analysis kicks the problem down the road. State agencies are rushing ahead to implement plans and regulations for the transition without taking into account this risk. Moreover, the analyses and processes for the implementation are biased and even if the results suggest that implementation now is premature, decisions are being made consistent with the narrative and not reality. I cannot believe that this won’t end badly.
This is a follow up to my article published at Watts Up With That Resources for the Future: Retail Electricity Rates Under the Inflation Reduction Act of 2022 and re-published here. The article addressed the Resources for the Future (RFF) Issues Brief titled Retail Electricity Rates Under the Inflation Reduction Act of 2022 claim that the legislation, will “save typical American households up to $220 per year over the next decade and substantially reduce electricity price volatility.” I got a comment here that raised two flaws in my arguments. I used data from the United States Energy Information Administration (EIA) Electricity Data Browser for Texas to test the hypothesis that increased renewable energy resources would lower electricity costs. This article addresses the flaws raised.
When I follow your directions for your chart using the EIA data you describe, I get a very different picture. Avg residential power prices in Texas peak in mid 2008, then fall for several years before coming up more recently. Your chart is showing something other than what you describe.
Further, inflation adjusted power prices have been falling over the 2001-2022 period. Using CPI data with January 2022 = 100, average real price in early 2001 was about 12.5 cents then jumped up to 18.5 cents in mid 2008 before falling back to about 12.5 cents in 2022.
I hypothesized that if I used the United States Energy Information Administration (EIA) Electricity Data Browser tool I could find data that showed that prices would go up in states where renewable energy development has increased the fraction of renewable energy generated and I used Texas an example. I downloaded the monthly total net generation (GWh) and the net generation from just renewable resources so I could calculate the percentage of renewable generation energy. Then I downloaded the average monthly residential average price of electricity.
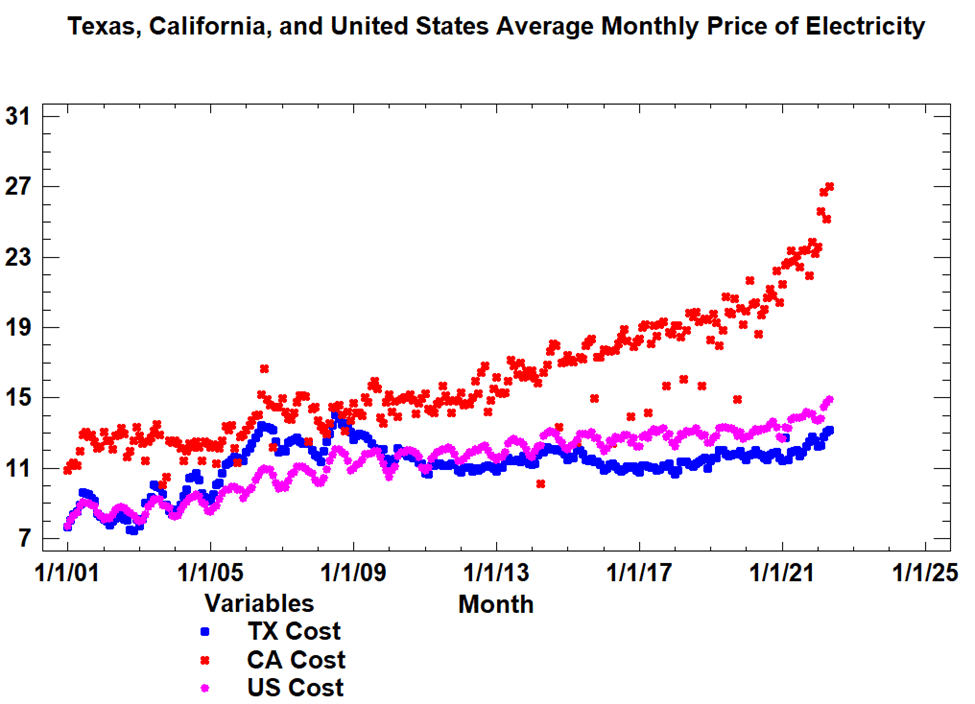
I went back and reviewed my work and have to apologize to everyone because I mistakenly used the wrong monthly residential cost data. Dr. Giberson used the correct data as shown below. The Texas data do not illustrate any relationship between the percentage of monthly renewable energy generated per month (left axis) and the monthly residential electric price (right axis). What it does show is that the observed variability of the monthly prices is large in Texas.
Importantly, this result invalidates my hypothesis that these two parameters could be used to show that when the Texas electric system added more renewable energy the costs went up. Obviously, these data do not confirm that hypothesis. Upon further review in order to pick out a trend in the cost data I should have adjusted for inflation as Dr. Giberson suggested. The variation in the data before the renewable energy production kicked in also suggests that picking out a trend is more complicated than I thought it would be.
An alternative hypothesis is that this is an issue with just the Texas data so I did the same thing with California data. The results shown below are significantly different than Texas. There is less cost variability and the increase after 2005 is not as pronounced. It does appear that costs go up and renewable penetration goes up but I did not adjust for inflation to test that theory.
The axes in the Texas and California charts are different so inter-comparison is difficult. When combined the results are messy but there are a couple of interesting things. Texas residential electric costs are significantly lower (89% in 2021) and the spread has increased over time. However, during the years 2005 to 2009 the Texas energy costs were less than 20% lower apparently because something happened to the Texas market in that time. Dr. Giberson notes that the inflation adjusted real price in early 2001 was about 12.5 cents then jumped up to 18.5 cents in mid-2008 before falling back to about 12.5 cents in 2022. The other interesting point is that as the percentage of renewable generation increases the spread between the monthly values increases which I think reflects seasonal variations in resource availability.
I also extracted data for the United States as a whole. Note that US residential electric costs increased at the same time Texas rates increased after 2005. The same volatility increase as additional renewable power is added is apparent. It is notable that historically there has been a clear annual cycle of costs peaking in the summer and troughing out in the winter. With regards to the RFF cost projection, I don’t think there is much evidence that increasing renewable penetration has increased cost but the annual cycle appears to be becoming less pronounced. Of course, trying to analyze a trend when there was a pandemic is likely to end up with massive uncertainty.
As noted, there is one aspect that is consistent for all the renewable penetration data. As the percentage of renewable energy production increases the volatility of the monthly production increases. Wind resources are generally higher when there is a greater contrast in air masses in the spring and fall. Obviously solar resources are lower in the winter when days are shorter. I believe that there is an important outcome of that finding. The RFF brief claims that adding more renewable resources will “substantially reduce electricity price volatility”. I believe that the argument is that the price of fossil fuels is subject to many extraneous factors that affect price but those factors are smaller for renewable resources. I think these data suggest that the inherent variability in a weather-dependent source of power generation could increase electric price volatility as the system becomes more dependent upon those resources.
The following figure lists cost data for Texas. California, and the country as a whole. What interests me are the outliers. For example, in March 2014 the monthly residential price of electricity in California was 15.86 cents. It dropped to 10.12 cents in April then rebounded to 16.46 cents in May. Subsequent outliers are all either in October or April for the next five years. This might represent increased wind availability but it is not clear why it is not as pronounced before or after this period if that is the case.
More important are the high outliers. In California, the monthly price was 15.17 cents in June 2005, jumped to 16.65 cents in July, and then dropped to 14.89 cents in August. In Texas, the monthly price was 11.4 cents in January 2021, jumped to 12.74 cents in February, and then went down to 11.5 cents in March. The Texas blackout was the cause for the energy price spike in February 2021 but I don’t know of any specific problem in California in July 2005. I suspect that these events will become more common as renewable penetration increases but the data do not show that yet.
Conclusion
Obviously, I need to double check my data analyses before publishing. I found that using the correct data leads to an analysis that is consistent with every other aspect of the net-zero transition that I have looked at. Everything is more complicated than it appears at first glance and any conclusions drawn are more uncertain. Any claims about conclusive evidence should be regarded cynically.
The RFF Retail Electricity Rates Under the Inflation Reduction Act of 2022 issues brief claims that the legislation, will “save typical American households up to $220 per year over the next decade and substantially reduce electricity price volatility.” My original conclusion was that the Texas cost and renewable generation data showed that it was unlikely that there would be cost savings due to increased renewable energy but I used incorrect data. Using the correct data, I could argue that the Texas results did not show a decrease which is contrary to the RFF projection, but it is also reasonable to argue that were it not for the renewable generation that costs would have increased more than they did. At first glance and without adjusting for inflation, California data suggested that increased penetration of renewable resources increases costs but there are clear uncertainties that make this a tenuous conclusion.
Despite the problems with my analysis, I remain convinced that the RFF projection is unlikely. The models used for this kind of analysis do not do future changes to the electric system well. For example in the comments on my original post, Rud Istvan explained why wind renewables cannot reduce electricity prices. He showed that EIA LCOE estimates do not accurately project future costs for renewable energy development because they don’t include the costs to make the energy generated available when and where it is needed. Francis Menton recently made a persuasive argument that all projections for future electric systems overbuild the wind and solar resources resulting in higher costs. Worse, you still need a backup dispatchable resource and someone also has to provide ancillary services to maintain the grid’s ability to move power around. I believe that the modeling down by RFF and others does not adequately take those factors into account and if it did it would not show reduced costs.
One final point about the data. There is a real trend in the renewable energy generation data that needs to be watched in the future. All the data show that as the percentage of renewable energy production increases the volatility of the monthly production increases. The RFF brief claims that adding more renewable resources will “substantially reduce electricity price volatility”. While there is no apparent impact in retail costs due to this observed volatility in these data, I suspect that will change in the future.
This article first appeared at Watts Up With That. I slightly modified the first paragraph but the rest is the same. This represents my opinion and not the opinion of any of my previous employers or any other company with which I have been associated.
Based on the Time Magazine opinion piece, “What Comes After the Coming Climate Anarchy?”, we may have reached a point where no facts have to be included in a climate fear porn editorial. This is just a short introduction to the piece and the author. I encourage you to read it yourself. After my post was published David Middleton wrote another article about the opinion piece covering much the same ground. His version has much better graphics.
The author is Parag Khanna who Time describes as a founder of Future Map and author of the new book MOVE: The Forces Uprooting Us. According to Khanna’s long bio, he is a “leading global strategy advisor, world traveler, and best-selling author”. He is Founder & CEO of Climate Alpha, an AI-powered analytics platform that forecasts asset values because “the next real estate boom will be in climate resilient regions”. He also is Founder & Managing Partner of FutureMap, a data and scenario based strategic advisory firm that “navigates the dynamics of globalization”. Dr. Khanna “holds a PhD in international relations from the London School of Economics, and Bachelors and Masters degrees from the School of Foreign Service at Georgetown University”. A quick look at the School of Foreign Service Georgetown core curriculum offers no suggestion of any scientific requirements that could provide a basis for Dr. Khanna’s climate beliefs.
The opinion piece starts out with correlation causation fallacy endemic to the scientifically illiterate and climate innumerate crisis mongers. He notes that in 2021, “global carbon dioxide emissions reached 36.3 billion tons, the highest volume ever recorded” and that this year “the number of international refugees will cross 30 million, also the highest figure ever”. Then he explains the basis for his climate anarchy belief: “As sea levels and temperatures rise and geopolitical tensions flare, it’s hard to avoid the conclusion that humanity is veering towards systemic breakdown”.
This is just a windup to:
Today it’s fashionable to speak of civilizational collapse. The U.N. Food and Agriculture Organization’s (FAO) states that just a 1.5 degree Celsius rise will prove devastating to the world’s food systems by 2025. Meanwhile, the most recent IPCC report warns that we must reverse emissions by 2025 or face an irreversible accelerating breakdown in critical ecosystems, and that even if the Paris agreement goals are implemented, a 2.4 degree Celsius rise is all but inevitable. In other words, the “worst case” RCP 8.5 scenario used in many climate models is actually a baseline. The large but banal numbers you read—$2 trillion in annual economic damage, 10-15% lower global GDP, etc.—are themselves likely massively understated. The climate bill just passed by the Senate is barely a consolation prize in this drama: a welcome measure, but also too little to bring rains back to drought-stricken regions in America or worldwide.
Then there is this:
Let’s assume that we are indeed hurtling towards the worst-case scenario by 2050: Hundreds of millions of people perish in heatwaves and forest fires, earthquakes and tsunamis, droughts and floods, state failures and protracted wars. Henry Gee, editor of the magazine Nature, wrote in an essay in Scientific American in late 2021 that even absent the hazards of climate change and nuclear war, humankind was heading towards extinction due to declining genetic variety and sperm quality.
He goes on to predict that even in the most plausibly dire scenarios billions of people will survive. He says that current population stands at eight billion but claims as a result of these dire scenarios “the world population would likely still stand at 6 billion people by 2050”. As you read on this opinion piece is simply an infomercial for Climate Alpha and FutureMap. He believes that climate migrations will be necessary for the survivors. His future vision is pockets of reliable agricultural output and relative climate resilience that may become havens for climate refugees.
He concludes:
What these surviving societies and communities will have in common is that they are able to unwind the complexity that has felled our predecessors. They rely less on far-flung global supply chains by locally growing their own food, generating energy from renewable resources, and utilizing additive manufacturing. A combination of prepping and nomadism, high-tech and simple, are the ingredients for species-level survival.
These demographic, geographic, and technological shifts are evidence that we are already doing things differently now rather than waiting for an inevitable “collapse” or mass extinction event. They also suggest the embrace of a new model of civilization that is both more mobile and more sustainable than our present sedentary and industrial one. The collapse of civilizations is a feature of history, but Civilization with a big ‘C’ carries on, absorbing useful technologies and values from the past before it is buried. Today’s innovations will be tomorrow’s platforms. Indeed, the faster we embrace these artifacts of our next Civilization, the more likely we are to avoid the collapse of our present one. Humanity will come together again—whether or not it falls apart first.
Comments
In my opinion there are several major flaws in his arguments. Apparently, his projections are based on the RCP 8.5 scenario because he thinks it is “actually a baseline”. Roger Pielke, Jr. has noted that the misuse of RCP8.5 is pervasive. Larry Kummer writing at Climate Etc. explains that it is a useful worst-case scenario, but not “business as usual”. For crying out loud even the BBC understands that the scenario is “exceedingly unlikely”. Relying on that scenario invalidates his projections.
Khanna’s worst-case scenario statement “Hundreds of millions of people perish in heatwaves and forest fires, earthquakes and tsunamis, droughts and floods, state failures and protracted wars” is absurd. He has to address the many examples that show that weather-related impacts have been going down as global temperatures have increased such as those described by Willis Eschenbach in “Where Is The “Climate Emergency?”. The theme of his opinion is climate anarchy so why are earthquakes and tsunamis included? I concede that his flawed climate projections could stress states and prolong wars but I am not convinced that climate is a major driver.
Finally, his argument that climate is a major driver is contradicted by his dependence on the Sustainable Development Index, a “ranking of countries that meet their people’s needs with low per capita resource consumption”. He states that the best performers are “Costa Rica, Albania, Georgia, and other less populated countries around middle-income status”. The fact that Costa Rica is in a tropical region and thus much warmer than mid-latitude Albania and Georgia suggests that warm climates are not a limiting factor for sustainable development.
Khanna may be a leading global strategy advisor, world traveler, and best-selling author but his lack of understanding of the uncertainties associated with climate change are evident in this editorial. Not unlike many of those advocates for climate change action, upon close review it appears that following the money is his motivation.
The Climate Leadership and Community Protection Act (Climate Act) includes a commitment for environmental justice goals. As part of that effort the Climate Act created the Climate Justice Working Group (CJWG) who has been tasked to help decide what that commitment entails. This article describes one project that I believe will be considered part of the environmental justice financial investments.
The Climate Act establishes a “Net Zero” target (85% reduction and 15% offset of emissions) by 2050. I have written extensively on implementation of the Climate Act. Everyone wants to do right by the environment to the extent that efforts will make a positive impact at an affordable level. Based on my analysis of the Climate Act I don’t think that will be the case. I believe that the ambitions for a zero-emissions economy outstrip available renewable technology such that the transition to an electric system relying on wind and solar will do more harm than good. The opinions expressed in this post do not reflect the position of any of my previous employers or any other company I have been associated with, these comments are mine alone.
Climate Act Background
The Climate Act is “Working to ensure all New Yorkers are represented in the State’s transition to a cleaner energy future and benefit from investments and opportunities provided by this historic transition”. In other words, they are addressing environmental justice. According to EPA: “Environmental justice is the fair treatment and meaningful involvement of all people regardless of race, color, national origin, or income, with respect to the development, implementation, and enforcement of environmental laws, regulations, and policies.”
One key part of that commitment is investment in disadvantaged communities. According to the Climate Justice Working Group (CJWG) webpage:
The Climate Act requires the state to invest or direct resources in a manner designed to ensure that disadvantaged communities to receive at least 35 percent, with the goal of 40 percent, of overall benefits of spending on: clean energy and energy efficiency programs and projects or investments in the areas of housing, workforce development, pollution reduction, low-income energy assistance, energy, transportation, and economic development
As I noted in a recent post on my CJWG disadvantaged community criteria comments, the distribution of those investments is sure to be contentious. I believe that the State is going to invest money in public housing for low- and middle-income housing as part of those investments. There are two concerns: is this what the CJWG thinks is appropriate and is this a good investment for society as a whole?
Ithaca Public Housing Rehabilitation
In what I believe is a prototype for public housing investments, on August 5, 2022 Governor Kathy Hochul announced a $75 million project to upgrade and preserve two outdated Ithaca Housing Authority properties with a total of 36 apartments and to replace another obsolete Authority property with 82 new affordable apartments. The 118-unit Ithaca Housing Authority Redevelopment is designed to be all-electric and was awarded funding through the Clean Energy Initiative program for multifamily buildings. A rendering of the project is shown below.
Governor Hochul: “My administration is steadfast in our commitment to preserving and creating affordable housing that is sustainable, high-quality, and comfortable,” Governor Hochul said. “Today’s $75 million investment will help strengthen communities and provide new opportunities for Ithaca residents. We will continue to upgrade and modernize New York’s supply of public housing in the Southern Tier to provide a more stable and equitable future for the next generation.”
The Ithaca Housing Authority Redevelopment complements Governor Hochul’s sweeping plans to make housing more affordable, equitable, and stable. In the 2022-23 State Budget, the Governor introduced and successfully secured a new $25 billion, five-year, comprehensive housing plan that will increase housing supply by creating or preserving 100,000 affordable homes across New York including 10,000 with support services for vulnerable populations, plus the electrification of an additional 50,000 homes.
The first component of the Ithaca Housing project will be redevelopment at Overlook Terrace and Southview Gardens. The plan will renovate two buildings with 46 apartments, a community building, and a building for laundry and mechanical equipment. Major capital improvements will include the replacement of water heaters and furnaces to an all-electric option; upgraded laundry facilities; the replacement of entry doors, vinyl and aluminum siding, soffits and trim, windows, and roofs.; and site landscaping.
The other component is a complete rebuild of 70 apartments at The Northside Developments. The new affordable development will have 17 residential buildings with a total of 82 apartments – 12 more than the original thanks to a reconfiguration that adds much-needed one-bedroom apartments. The new development will include a one-story community building with a kitchen, office spaces, and a laundry room.
The press release notes that:
In total, there will be 20 one-bedroom units, 34 two-bedroom units, 40 three-bedroom units, 22 four-bedroom units, and two five-bedroom units. All of the apartments will be for households earning at or below 80 percent of the Area Median Income.
The press release also describes the funding sources:
State funding for the $75 million Ithaca Housing Authority Redevelopment includes $10.6 million in permanent tax-exempt bonds, Federal Low Income Housing Tax Credits that will generate $29.7 million in equity, and $18.8 million in subsidy from New York State Homes and Community Renewal. The development was awarded $1.4 million from the Clean Energy Initiative. Other funding sources include $9.3 million from the Ithaca Housing Authority, $300,000 from Tompkins County Community Housing Fund, and nearly $91,000 from Ithaca Urban Renewal.
Finally, the press release says:
The Clean Energy Initiative developed by New York State Homes and Community Renewal and the New York State Energy Research and Development Authority to create more than 1,500 energy-efficient, all-electric or electric-ready, climate-friendly affordable homes in existing multifamily buildings across the state.
What about the Numbers?
I have added an addendum with quotes included in the press release. To hear those people this is the greatest thing ever. For example, New York State Energy Research and Development Authority President and CEO Doreen M. Harris said, “NYSERDA is pleased to see construction commence on the Ithaca Housing Authority redevelopment project, which demonstrates that clean, resilient and affordable housing can be accessible to all New Yorkers”. The pragmatic approach is to look into the numbers to see if this is likely.
According to the press release this is a $75 million project to upgrade and preserve outdated Ithaca Housing Authority properties that will renovate or rebuild a total of 118 housing units. That works out to $635,593 per unit. The two components of the project both include a community building that also has mechanical equipment but however you calculate the cost per housing unit it is extremely high. According to the Ithaca Journal the typical cost of a home in Ithaca’s county in June 2022 was $357,450 and the cost of these units is well above that value.
The Press Release notes that:
All three properties will be highly energy-efficient and have an all-electric building design pursuant to the New York’s nation-leading Climate Leadership and Community Protection Act to curb building emissions. Additional energy efficiency measures will include heat-reflective roofing systems with tapered insulation, ENERGY STAR rated appliances, energy-efficient lighting and low-flow plumbing fixtures for a projected 15 percent in total energy savings.
The Draft Scoping Plan for the Climate Act does not provide detailed enough data to determine an estimate of the typical residential greenhouse gas emissions per year. The New York State Energy Research and Development Authority Patterns and Trends document gives estimates of total household energy for different fuels. I used Energy Information Administration carbon dioxide emission coefficients by fuel and found that the highest estimated emissions for the New York are for homes using fuel oil. As a conservative surrogate for the largest potential impact that these projects could possibly have, I used that estimate of 10 tons per year. If we assume that the existing housing units are responsible for ten tons of GHG emissions per year and that the project will eliminate all the emissions that means that the annual reduction of GHG emissions is 1,180 tons. The resulting cost per ton of CO2 removed is $63,559.
Discussion
This article addressed two concerns: is this what the CJWG thinks is appropriate and is this a good investment for society as a whole? I believe that this project is an appropriate environmental justice investment because “All of the apartments will be for households earning at or below 80 percent of the Area Median Income”. As far as I can tell however, only Southview Gardens is in a draft Disadvantaged Community so it remains to be seen of all or only part of this investment is of the “least 35 percent, with the goal of 40 percent” investment target.
I have two relevant concerns about the Climate Act transition to net-zero. The first is affordability and the second is feasibility. The press release quotes Doreen M. Harris as saying “NYSERDA is pleased to see construction commence on the Ithaca Housing Authority redevelopment project, which demonstrates that clean, resilient and affordable housing can be accessible to all New Yorkers”. The numbers are worrisome relative to the claim that this project will demonstrate that affordable housing that meets the standards for the Climate Act is viable. Seriously, given that there are probably at least one million housing units similar to these, can New York afford to upgrade public housing to those standards at a cost over $600,000 per unit or over $600 billion in total?
As noted above the typical cost of a home in Ithaca’s county in June 2022 was $357,450. It is notable that there is such a big difference in cost relative to the redevelopment costs. Without a lot of work, it is not possible to break down the cost estimates to see how much of the projected costs are due to the energy transition enhancements. If those costs are a significant driver in the difference, then it is appropriate to ask whether this is an appropriate environmental justice investment. In my opinion, it is more appropriate to address environmental justice concerns for impacted communities today than it is to make investments that are futile unless all jurisdictions in the world also make similar commitments. Given that there is a limited amount of money available, then providing more upgraded housing is a better investment than limiting the housing upgrades because of the increased costs of the net-zero transition.
Conclusion
It will be interesting to see how this plays out. The Ithaca Housing Authority projects meet all the criteria for appropriate environmental justice investments except that most of the housing affected is outside of a Draft Disadvantaged Community. Will the CJWG recommend that all or only part of the funding be included in the 35% target and what will the State say?
The numbers are not encouraging from an affordability standpoint. If this is any indication of the potential costs for environmental justice investments then there will be problems. In addition to the magnitude of the per housing unit cost, the cost reduction efficiency is an issue. According to the Integration Analysis in 2020 the building sector emitted 105 million metric tons of carbon dioxide equivalent. Until such time that the cost per ton reduced for the building sector is brought down three orders of magnitude ($63 instead of $63,000 per ton reduced), I cannot imagine that the emissions reductions are affordable.
Addendum for Press Release Quotes:
Homes and Community Renewal Commissioner RuthAnne Visnauskas said, “This $75 million investment in the Ithaca Housing Authority speaks to our commitment to upgrading and protecting our existing affordable housing assets. The redesign of these apartments will yield modern and highly energy-efficient homes for 118 households and will preserve affordability and extend the useful life of these buildings for decades to come. Governor Hochul’s bold and forward-looking housing agenda is ensuring a brighter and more secure future for public housing residents in Ithaca and across the entire state.”
New York State Energy Research and Development Authority President and CEO Doreen M. Harris said, “NYSERDA is pleased to see construction commence on the Ithaca Housing Authority redevelopment project, which demonstrates that clean, resilient and affordable housing can be accessible to all New Yorkers. Through the Clean Energy Initiative, we are working with our sister agency, New York State Homes and Community Renewal, to make strategic investments in multifamily buildings like those being developed through this project, that reduce greenhouse-gas emissions and provide healthier, comfortable and resilient living spaces.”
Senator Chuck Schumer said, “Every New Yorker deserves access to safe affordable housing, but historic underinvestment has created a housing crisis in places like Ithaca. I am proud that the federal Low-Income Housing Tax Credit that I have fought hard to protect and expand has supplied the millions needed to make these new affordable homes a reality. Housing is a human right and I will keep fighting to get every dollar of federal support needed to help lay the foundation in Ithaca for a brighter, ‘gorges’, and more equitable future for all residents.”
State Senator Tom O’Mara said, “State investments in safe and affordable housing continue to strengthen the fabric of neighborhoods and the quality of life for tenants and residents in the city of Ithaca and communities across this region and state. It’s an important commitment that will deliver critical short- and long-term benefits.”
Assemblymember Anna Kelles said, “I am encouraged to see this project move forward at a moment when rising rents, increased home prices, and lack of supply have exacerbated the housing and affordability crisis. We must continue to create affordable and safe housing for low- and middle-income families. This project addresses this need by rehabilitating 36 units, and fully replacing 70 units that were outdated and potentially unsafe with 82 new, safe, and sustainable units. This 118 unit project will add 12 new units, including one and two bedroom units which are currently in acute deficit in Ithaca and all units will be rented at 80% area median income (AMI). Hopefully this is just one more step in a long needed road of adding to our affordable housing stock. I also applaud the project’s sustainability goals with all of the units in this housing project constructed all-electric with air source heat pumps providing heating and cooling, in line with the city of Ithaca and Tompkins County aggressive climate goals.”
Acting Ithaca Mayor Laura Lewis said, “The city of Ithaca is pleased to have the support of so many partner agencies in the redevelopment of critically needed low-income housing. Substantial renovations of Overlook Terrace and Southview Garden and, at Northside Apartments the complete replacement of outdated buildings that were first constructed decades ago, will provide families with high quality and environmentally efficient homes. This investment in our community will benefit generations of Ithacans.”
Tompkins County Legislature Chairwoman Shawna M. Black said, “This project is an excellent example of re-invigorating our affordable housing options in Tompkins County. We’re proud of what Ithaca Housing Authority offers to our community and that these projects will be energy efficient and align with New York State’s Climate Leadership and Community Protection Act. Thank you to New York State, Ithaca Housing Authority, and our Tompkins County Community Housing Fund for contributing to these developments. I can’t wait to see construction begin and to get people back into their homes.”
3d Development Group President Bruce Levine said, “Our focus was on the needs of the existing tenants, future tenants, the community at large, and the global need for improved energy sustainability and reducing fossil fuel emissions. This project was made possible by the support received from the state, federal and local government agencies. Because everyone got on board and believed in the goals and initiative, the final result will transform the Ithaca Northside neighborhood for decades to come.”
Ithaca Housing Authority Executive Director Brenda Westfall said, “Our vision and end goal is to provide quality affordable housing for our current and future tenants while ensuring that the properties are energy efficient and meet energy sustainability goals for decades to come. As a lifelong resident of the city of Ithaca, it is extremely rewarding to witness the commitment and support that many different agencies brought forth in bringing our vision to life. This project will both improve and preserve the quantity and quality of affordable housing we are able to provide while complimenting the landscape of the neighborhoods in which the properties are located.”
I have described several New York Office of Renewable Energy Siting (ORES) solar project application decisions and was all but certain that no project would ever be rejected. On August 9, 2022 the The New York State Board on Electric Generation Siting and the Environment (Siting Board) denied approval to North Side Energy Center, LLC (North Side) to build and operate a 180-megawatt solar farm in St. Lawrence County. This post describes the decision.
New York’s Climate Leadership and Community Protection Act (Climate Act) Act establishes a “Net Zero” target (85% reduction and 15% offset of emissions) by 2050. I have written extensively on implementation of the Climate Act. Everyone wants to do right by the environment to the extent that efforts will make a positive impact at an affordable level. My analysis of the Climate Act shows that the ambitions for a zero-emissions economy outstrip available renewable technology such that the transition to an electric system relying on wind and solar will do more harm than good. The opinions expressed in this post do not reflect the position of any of my previous employers or any other company I have been associated with, these comments are mine alone.
New York Solar Development
I prepared a detailed description of the New York permitting process in a recent post so I will not repeat all that information here. In brief, in order to expedite the permits for wind and solar projects New York State has established the Office of Renewable Energy Siting (ORES) which is housed within the Department of State. ORES has the authority to over-rule any local objections to renewable projects if they are unduly burdensome. To this point all the projects proposed have been approved.
I have been writing about problems associated with utility-scale solar development in New York based on input from readers of my blog. In my opinion if you are going to develop solar on the scale proposed in the Climate Act, then there should be a plan for responsible siting. My recent post on another solar project included background information for New York solar development. The takeaway message is that New York has not implemented any kind of a policy that protects prime farmland or addresses responsible solar siting for utility-scale developments. Frankly I was beginning to think that no solar development project would ever be rejected.
North Side Energy Center Decision
North Side Energy Center is being developed by a subsidiary of NextEra Energy Resources, LLC. NextEra Energy Resources is the world’s largest generator of renewable energy from the wind and sun. According to their website, the company has been investing in clean energy for more than 25 years and has a track record of safely building and operating renewable energy centers. The docket for the application is available here.
The Project as proposed would generate up to 180 megawatts (MWs) of solar energy and would consist of commercial-scale solar arrays in a tracker racking system of approximately 8 to 13 feet, but as much as 18 feet, in height. The Project also includes inverters and other components; approximately 7 miles of access roads with widths between 12 and 20 feet; parking, materials and equipment laydown, and construction staging areas; approximately 33 miles of buried and overhead electric collection lines; a collection substation covering approximately 2.2 acres of currently forested land; electrical point of interconnection facilities; an adjacent 230 kilovolt (kV) switchyard; transmission lines; and chain-link fencing seven feet in height around the entire Project.
The North Side project area consisted of approximately 2,235 acres of leased land. The project was to be sited in rural areas in each of the three towns, which is comprised of agricultural and forested land and includes 37 wetland areas and 11 regulated streams. The wetlands total 1,504 acres, or 67 percent — more than two-thirds – of the project area. The project components were proposed to be located on approximately 1,200 to 1,400 acres of the 2,235 acres making up the project area, and were estimated to impact more than 500 acres of wetlands. In addition, seven threatened or endangered species were documented in the project area.
The Order explains the rationale for the disapproval:
After a thorough and complete review of the project and its impacts, the Siting Board denied the application because the adverse environmental impacts associated with construction and operation of the project, specifically impacts to wetlands and threatened and endangered species, have not been minimized or avoided to the maximum extent practicable, as required by law. In addition, the project developer was unable to demonstrate it would comply with applicable State environmental laws related to wetlands and threatened and endangered species.
The presence of several threatened and endangered species, as well as species of special concern in the project area, is not disputed by North Side. The species observed on the site include: Endangered: Short-Eared owls and Golden Eagles; Threatened: Blanding’s Turtles, Northern Harriers, Sedge Wrens, Upland Sandpipers, and Bald Eagles; and Species of Special Concern: Vesper Sparrows, Grasshopper Sparrows.
I have been involved with environmental permitting applications for years. One of the cardinal rules is to avoid wetlands as much as possible. It is amazing that the developer thought that they could get a permit for a project that impacted more than 500 acres on a project footprint of 1,200 to 1,400 acres. Apparently, the word is out that New York is wide open for development and NextEra thought they could get away with it.
My focus on past decisions has been the impact of agricultural lands. For once a project has been proposed that does not exceed the New York State Department of Agriculture and Markets goal for agricultural land conversion. According to the Ag and Markets brief:
Of the overall 2,241-acre Project Area assessed. The Applicant states that approximately 35 percent (781.5 acres) will be used for Project Components within a fenced area of 980.7 acres to generate 180 MW of renewable energy. The Applicant also states that the remaining land outside of the Project’s fenced area will remain under its existing uses. The Project is sited within mapped Agricultural Districts. One hundred twenty-one (121) acres of soil within the Project Area are classified in mineral soil groups 1-4. Similarly, 82 acres of the lands classified as Prime Farmland are proposed to be impacted withing the 1,100-acre Limits of Disturbance.
The Department’s goal is for a project to limit converting agricultural areas to no more than 10% of mineral soil groups 1-4 classified by the Department’s NYS Agriculture Land Classification, which the Department has identified as New York State’s most productive farmland.
In this case, the Applicant has met the Departments’ siting policy in that the settlement layout and does not propose to impact more than 10% of agricultural lands comprised of Mineral Soil Groups 1-4, as described by the NYS Agricultural Land Classification.
Ramifications
One amusing aspect of the State’s description of the decision was the apologetic tone of the press release. First was the caveat that they have been approving projects:
To date, the Siting Board has approved 17 renewable energy projects since 2018. North Side is the first renewable energy project rejected by the Siting Board. Additionally, the recently created New York State Office of Renewable Energy Siting has approved five renewable energy projects to date. North Side was expected to begin commercial operation in the fourth quarter of 2023.
Then the description claimed that the State tried to get the developer to make changes thus deflecting blame:
It’s important to note that significant efforts by State agency parties were made throughout the review process to have the developer change the project to reduce the impacts on wetlands and endangered species, including by reducing the size of the project. The developer can seek rehearing and appeal the Siting Board’s decision or file a new application.
While it is encouraging that the State did deny the application for a renewable project it is important to note that the application was incredibly arrogant. The idea that a project that a project that impacted 500 acres of wetlands (over a third of the disturbed area in the project!) would be approved should have been rejected out of hand by the developer. That NextEra thought they could get away with it speaks volumes about the impression that outside of the state developers have about New York solar siting.
Unfortunately, there is no sign that ORES is concerned about the effect of massive utility-scale solar development on New York’s agricultural industry in general and on the loss of prime farmland in particular. Until such time that utility-scale solar is required to meet the New York Department of Agriculture and Markets guidelines for responsible solar siting irresponsible solar developers like NextEra will continue to destroy prime farmland.