

One of the key claims in the Draft Scoping Plan documentation is that “The cost of inaction exceeds the cost of action by more than $90 billion”. Last month I consolidated documentation that had been presented in multiple earlier posts that supports my statement that the costs far exceed the benefits. The single most glaring omission of the Draft Scoping Plan is the near complete lack of cost documentation but with two weeks left in the comment period some of the numbers that were used in the Benefits and Costs chapter of Appendix G were made available. This post uses the new information provided to evaluate the benefits claim.
Everyone wants to do right by the environment to the extent that they can afford to and not be unduly burdened by the effects of environmental policies. I have written extensively on implementation of New York’s response to climate change because I believe the ambitions for a zero-emissions economy embodied in the Climate Act outstrip available renewable technology such that it will adversely affect reliability, impact affordability, risk safety, affect lifestyles, and will have worse impacts on the environment than the purported effects of climate change in New York. New York’s Greenhouse Gas (GHG) emissions are less than one half one percent of global emissions and since 1990 global GHG emissions have increased by more than one half a percent per year. Moreover, the reductions cannot measurably affect global warming when implemented. Bottom line for me is that in its present form the Climate Act will do more harm than good. The opinions expressed in this post do not reflect the position of any of my previous employers or any other company I have been associated with, these comments are mine alone.
Climate Act Background
The Climate Leadership and Community Protection Act (Climate Act) establishes a “Net Zero” target by 2050. The Climate Action Council is responsible for preparing the Draft Scoping Plan that defines how to “achieve the State’s bold clean energy and climate agenda”. They were assisted by Advisory Panels who developed and presented strategies to the meet the goals to the Council. Those strategies were used to develop the Integration Analysis prepared by the New York State Energy Research and Development Authority (NYSERDA) and its consultants that quantified the impact of the strategies. That analysis was used to develop the Draft Scoping Plan that was released for public comment on December 30, 2021.
At a recent meeting there was an opportunity for the public to ask questions about the New York State Energy Research & Development Authority (NYSERDA) work supporting the Draft Scoping Plan. I asked about the missing cost information and John Williams, Vice President, Policy and Regulatory Affairs, responded: “In response to your inquiry for additional cost information, we have added clarifying information to the existing Excel document, ‘Appendix G Annex 2: Key Drivers and Outputs,’ which can be found on the Climate Action Council Draft Scoping Plan website.” I extracted all the new tables to a separate spreadsheet. The spreadsheet table summarizing the cost methods is difficult to read so I have also extracted that information in a document. Also note that more detailed documentation for my cost-benefit analysis is available here and here.
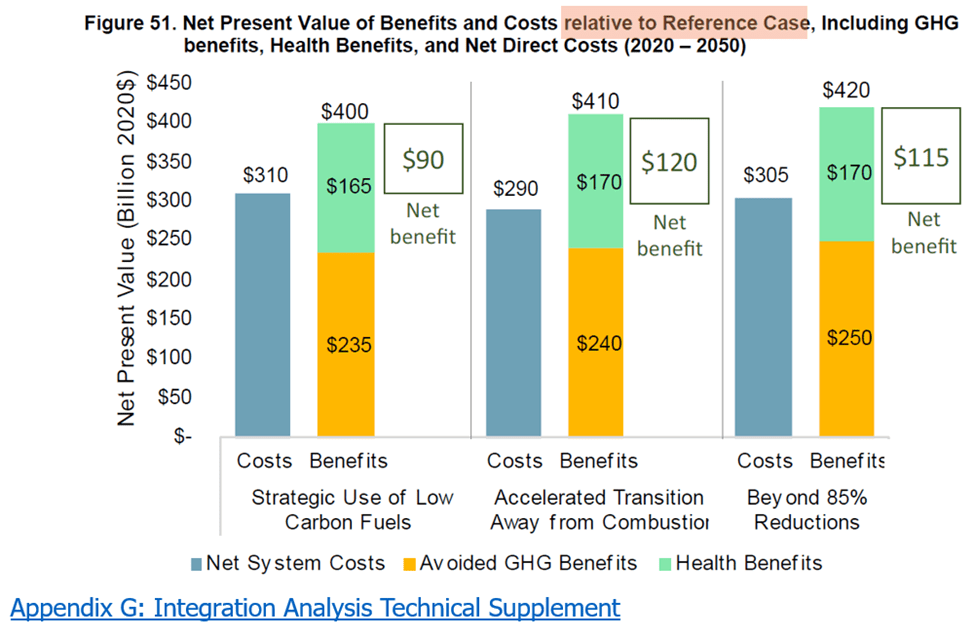
Benefits Exceed the Costs Claim The Draft Scoping Plan claim that “The cost of inaction exceeds the cost of action by more than $90 billion” is presented in Figure 51 in Appendix G Integration Analysis Technical Supplement. The Climate Act overview presentation for the public hearings included a similar figure and made the claim. However, there is a caveat or in this case, a trick. In the following figure I have highlighted the description that notes that the benefits are “relative to Reference Case”. By the way, that caveat is usually not noted when these results are presented. The clarifying data in the updated spreadsheet lists all the values in the table. Because the values are exactly the same, I believe the updated spreadsheet numbers were simply pulled from the figure and not from the analyses themselves.
Reference Case Costs
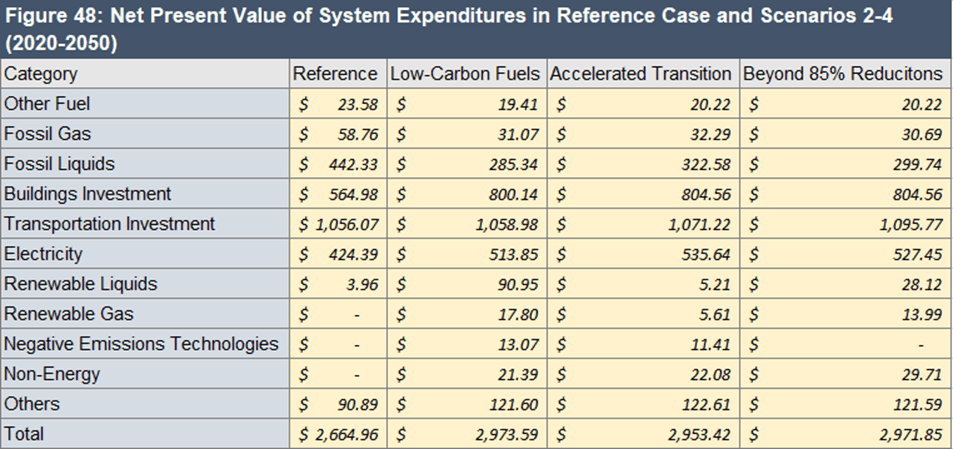
The next figure I evaluated in my analysis of the benefits claim was the total system expenditures shown in Figure 48. My biggest gripe was that the values in the Figure were not quantified. Thankfully the clarifying data in the updated spreadsheet provides numbers. The Reference Case total in the following table lists the net present value of system expenditures as $2,665 billion. Scenario 2, low-carbon fuels expenditures are $2,974 billion; Scenario 3, accelerated transition expenditures are $2,953 billion; and Scenario 4, beyond 85% reductions expenditures are $2,972 billion. More importantly the category costs are now available. Note that these numbers are not rounded in any way so I believe that they were copied from a different spreadsheet or model.

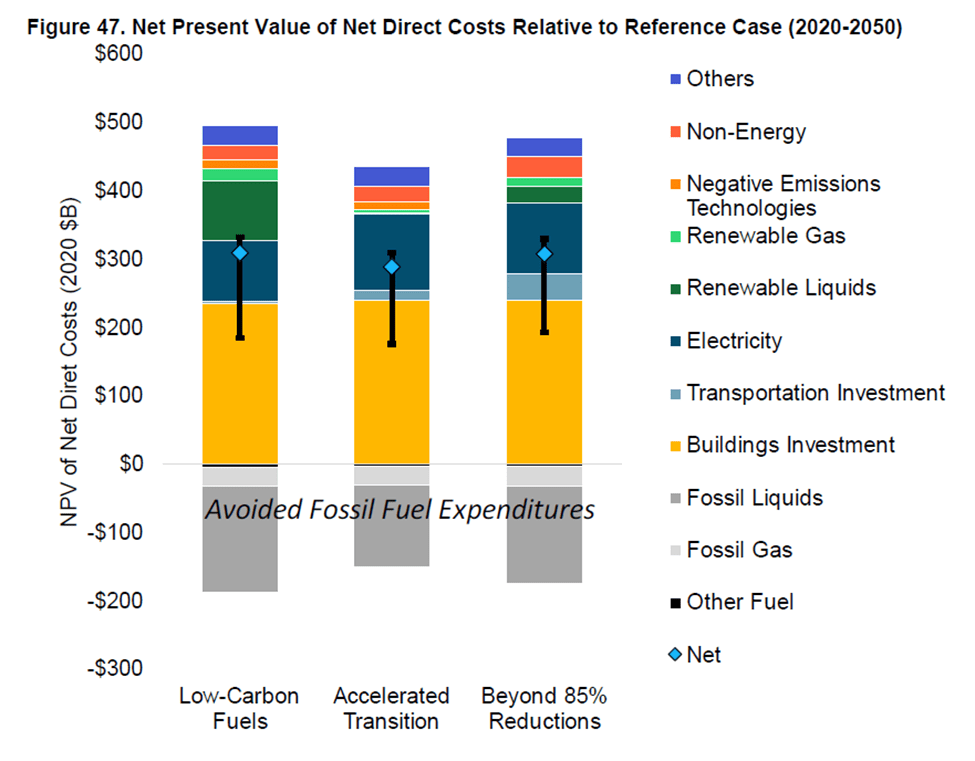
I have frequently heard Climate Action Council member refer to the net cost totals in Figure 47 as the costs of Climate Act implementation. However, these costs are relative to Reference Case for the three mitigation scenarios. In other words, the numbers presented subtract out the Reference Case costs. As explained in the previous post, the rationale for this approach is those estimates include not only the business-as-usual programs but also programs that are already implemented. This new cost information can be used to see if these already implemented programs are really business-as-usual strategies.

Category Cost Implications
The clarifying information update provides numbers associated with each category in Figures 47 and 48. In this section I will address three of the more impactful categories.
The “Buildings Investment” category “Includes capital and operating expenses for building equipment and appliances (e.g., space heaters, air conditioners, water heaters) and investments for building shell upgrades”. The net present value of system expenditures from 2020 – 2050 is $565 billion for the Reference Case. The building sector costs for the mitigation scenarios only range from $235 billion to $240 billion (42% increase) but the emission decreases relative to the Reference Case are 95% greater. In my opinion, that seems inconsistent with the Reference Case costs. It appears that Reference Case cost reductions per ton are double the mitigation scenarios. This anomaly could be caused by excluding the costs but including the emission reductions from the presented numbers.
The ”Transportation Investment” category “Includes capital and operating expenses for light-duty vehicles, medium- and heavy-duty vehicles, and buses, in addition to charging infrastructure costs”. The net present value of system expenditures from 2020 – 2050 is $1,056 billion for the Reference Case. Previously it appeared that the bar chart components difference to add charging infrastructure and the additional costs of electric vehicles relative to current alternatives seemed unacceptably low. According to the Integration Analysis, Scenario 2 transportation initiatives will reduce emissions 79% relative to the Reference Case at a cost of only $2.97 billion. Obviously, this does not pass the smell test. Something is overlooked or deliberately manipulated to make this claim.
The Figure 47 category label is Electricity but the description in the cost methods overview table is Electricity Incremental. I assume they are the same. The description of this category states that it “Includes capital and operating costs for electricity generation, transmission, costs to upgrade existing distribution system, and in-state hydrogen production costs.” The net present value of system expenditures from 2020 – 2050 is $424 billion for the Reference Case. The Integration Analysis described in the Draft Scoping Plan projects that the additional costs necessary to transition the electric grid to zero-emissions ranges between $89 and $111 billion. According to the Integration Analysis that covers the cost of between 5,659 and 7,265 MW on additional land-based wind, 7,393 and 9,310 MW of additional off-shore wind, 40,648 and 45,254 MW of additional solar, and 10,987 and 14,731 MW of additional energy storage beyond the capacity expected in the Reference Case. The additional costs necessary to the transition the electric grid to zero-emissions range between $89 and $111 for incremental electricity. Many things are overlooked or deliberately manipulated to make this claim. A US Energy Information Agency (EIA) report “Capital Cost and Performance Characteristic Estimates for Utility Scale Electric Power Generating Technologies” published in 2020 estimates that a 200 MWh battery energy storage system has a capital cost of US $65.9 million. Assuming that the average of the additional energy storage capacity provides four hours of energy for every MW and using the EIA cost number, energy storage costs alone are $213 billion.
Discussion
In my previous post I argued that the authors of the Draft Scoping Plan apparently included the already implemented transportation investment statewide zero-emission vehicle mandate in the Reference Case. I pointed out that suggesting that the zero-emissions vehicle “implemented policy” should not be included in the Climate Act implementation costs is disingenuous at best. The press release announcing that the Governor signed the legislation states: “The actions announced today in advance of Climate Week 2021 support New York’s ambitious goal of reducing greenhouse gas emissions by 85 percent by 2050, as outlined in the Climate Leadership and Community Protection Act.” It goes on to quote Governor Hochul: “New York is implementing the nation’s most aggressive plan to reduce the greenhouse gas emissions affecting our climate and to reach our ambitious goals, we must reduce emissions from the transportation sector, currently the largest source of the state’s climate pollution”. I think that these statements pretty well represent any dispassionate observer’s belief that the only reason for this mandate is to support the Climate Act. As such those costs are not legitimate Reference Case business-as-usual costs.
I also pointed out the claim that “The cost of inaction exceeds the cost of action by more than $90 billion” includes a caveat that the comparison is relative to the Reference Case. I showed how the semantic justification that the transportation investments were already implemented excluded the costs of the zero-emissions vehicle mandate from the costs side of the comparison. In order to further tilt the results, the emission reduction benefits attributed to the transportation investments were not excluded in the comparison. In other words, the comparison takes out the costs that would hurt their case but leaves in emission reduction benefits that help make the case that the benefits are greater than the costs.
The newly released categorial cost data provide evidence of similar manipulation of the data for other categories to provide the desired result. The building sector costs for the mitigation scenarios only range from $235 billion to $240 billion (42% increase) but the emission decreases relative to the Reference Case are 95% greater. The numbers also confirm my initial transportation initiative concerns. According to the Integration Analysis, Scenario 2 transportation initiatives will reduce emissions 79% relative to the Reference Case at a cost of $2.97 billion. The Integration Analysis projects that just the cost of battery electric vehicle chargers will be over $15 billion for Scenario 2 relative to the Reference Case. Finally, the claim that the additional costs necessary to transition the electric grid to zero-emissions range between $89 and $111 for incremental electricity are ludicrous. I estimate that the additional energy storage costs alone are $213 billion more than the Reference Case costs.
Conclusion
In my opinion the Climate Act claim that the benefits out-weigh costs is obviously incorrect. I have shown the recently released numbers confirm my earlier analyses. The Climate Act requires the Climate Action Council to “[e]valuate, using the best available economic models, emission estimation techniques and other scientific methods, the total potential costs and potential economic and non-economic benefits of the plan for reducing greenhouse gases, and make such evaluation publicly available” in the Scoping Plan. In order to fulfill this obligation, the Draft Scoping Plan must describe all control measures, assumptions used, the expected costs for those measures and the expected emission reductions for the Reference Case, the Advisory Panel scenario and the three mitigation scenarios. Given the overt manipulation of the data used to erroneously claim that “The cost of inaction exceeds the cost of action by more than $90 billion”, I have no faith in any cost numbers presented without that documentation.
