

Last week a strong, persistent upper‑level ridge and associated surface high formed a classic summer ridge (which the media now hypes as a heat dome) over the central and eastern United States, acting as a subsident “lid” that trapped and reinforced hot, humid air over several days. These conditions stressed electric systems across the country. This post offers examines the availability of New York renewable energy resources during classic high-load hot weather conditions.
I am convinced that implementation of the Climate Leadership & Community Protection Act (Climate Act) net-zero mandates will do more harm than good if the future electric system relies only on wind, solar, and energy storage because of reliability and affordability risks. The opinions expressed in this article do not reflect the position of any of my previous employers or any other organization I have been associated with, these comments are mine alone.
Overview
The Climate Act established a New York “Net Zero” target (85% reduction in GHG emissions and 15% offset of emissions) by 2050. Although the original interim 2030 target of a 70% renewable energy electricity mandate has been modified, there still are requirements that require much greater use of wind and solar energy generation.
Electric systems must be built around reliability during peak demand. One of my primary concerns with the Climate Act renewable energy mandates is weather variability because the conditions that characterize the highest loads also have the weakest expected wind resource availability. That makes electric resource planning for reliability during the peak period especially challenging. .
Earlier this year I wrote multiple articles about the January 23-27 winter storm and subsequent cold snap that lasted until February 9. This is a good case study for a New York extreme event that must be addressed by electric system planners. I described the New York Independent System Operator (NYISO) document Winter 2025-2026 Cold Weather Operations and the Climate Act transition implications.
For this assessment of the heat wave, I relied on the New York Independent System Operator (NYISO) fuel-mix load data are available at the NYISO Real-Time Dashboard. For last winter’s analysis I used the Operations Performance Metrics Monthly Report prepared by the NYISO Operating Committee that data set is not available yet. This article is limited to the description of the weather, generation mix, and resulting loads.
NYISO Real-Time Fuel Mix
The dashboard real-time fuel mix data includes links to current and historical five-minute generation (MW) for energy generated in New York State. I processed that data to calculate hourly averages. The generator types include “Hydro” that includes pumped storage hydro; “Wind”, mostly land-based wind but does include 136 MW of offshore wind; “Other Renewables” that covers solar energy (394 MW of “front-of-the-meter solar”), energy storage resources (63 MW), methane, refuse, or wood; “Other Fossil Fuels” is oil; “Nuclear”; “Natural Gas”; and “Dual Fuel” which are units that burn both natural gas and oil.
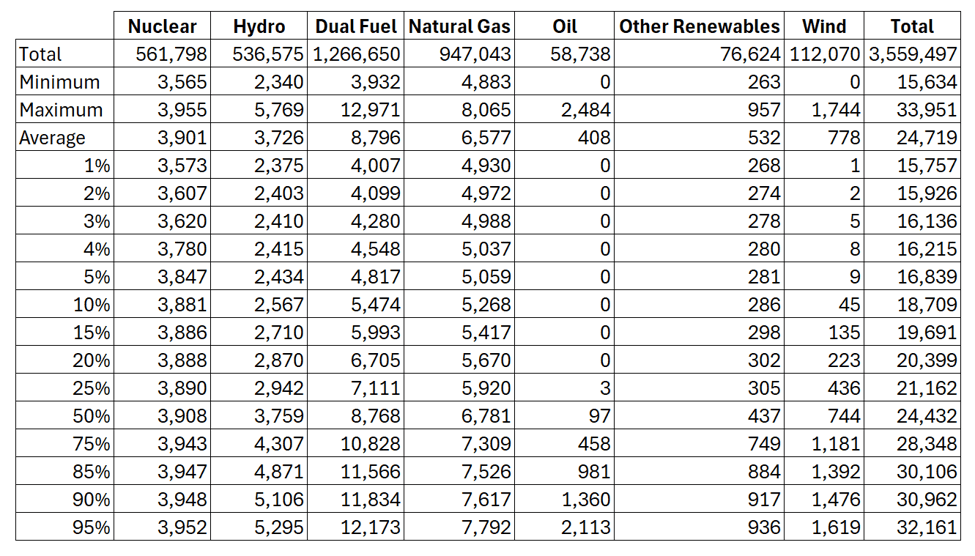
Figure 1 graphs all the fuel mix hourly data and Table 1 summarizes the data. The relative average fuel mix energy provided over the heat wave was nuclear 16% and fossil fuels 64% for a total of 80%. Although renewables accounted for 20%, hydro made up 15% of that. This year’s Budget Bill revised the Climate Act but the core power‑sector mandate—70 percent renewable electricity by 2030 and 100 percent zero‑emissions electricity by 2040—remains intact. Clearly power generation during this heat wave is nowhere near these mandates.
Figure 1: Hourly NYISO Realtime Fuel Mix June 29 – July 4, 2026
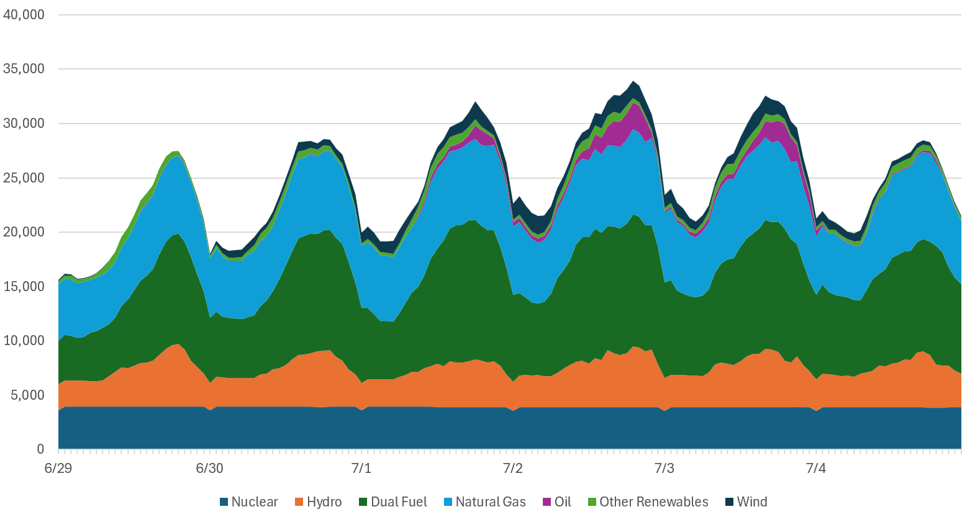
Table 1: Summary of Hourly NYISO Realtime Fuel Data Mix June 29 to July 4, 2026
These data do not show the contribution of wind and solar well. “Other Renewables” includes solar energy (394 MW of “front-of-the-meter solar” at the end of 2025), energy storage resources (63 MW), methane, refuse, or wood. The methane, refuse and wood facilities show up as the relatively constant base in Figure 3. If the 63 MW of energy storage is too small to show up, that means that the utility-scale “front-of-the-meter” solar shows up as the daily peaks each day. It appears that there some component of “Other Renewables” is base load because the nighttime values all are approximately 300 MW
Figure 3: Hourly NYISO Realtime Fuel Mix Other Renewables and Wind June 29 to July 4, 2026

Weather
New York wind resource availability dodged a bullet during this episode. Northeastern United States heat waves are typically associated with high pressure systems, the media hyped “heat dome”, and the location of the center of the dome makes all the difference. I combined daily NYISO realtime fuel data mix data and the June 29 daily weather map in Figure 4 and Table 2 to show how bad it could have been. The Weather Prediction Center National Center Environmental Prediction National Oceanic & Atmospheric Administration provides daily weather mapsthat I used to describe the weather during this heat wave episode.
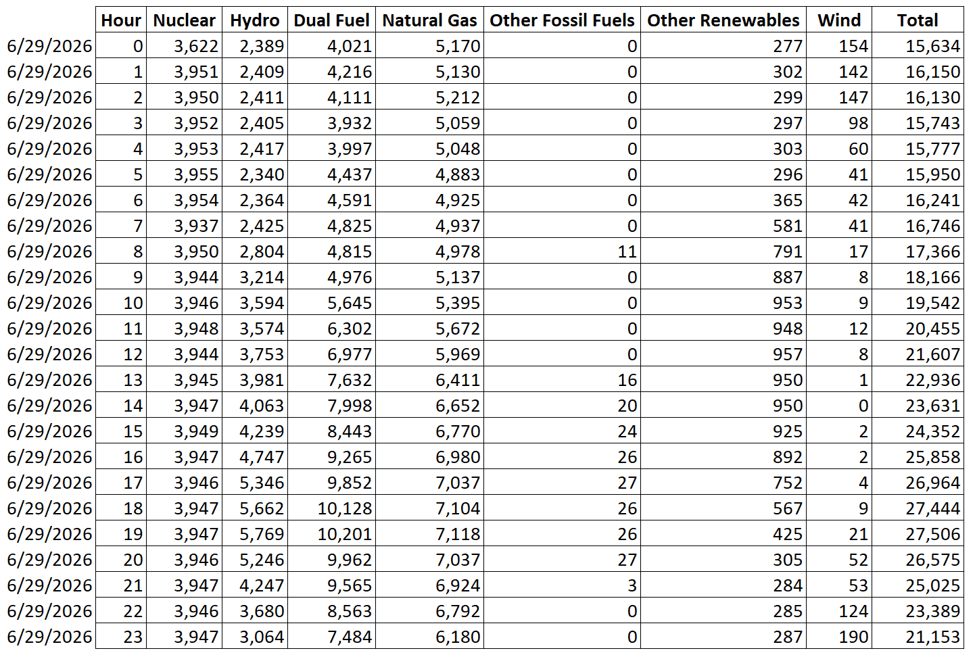
The daily weather map for June 29, 2026, shows that there was a high-pressure system centered over New York. The brown lines are isobars that show constant atmospheric pressure. Wind speed increases as the distance between isobars get smaller. Note that there are two closed 1020 isobar circles labeled with “H” in Quebec and western PA that are both labeled with pressures of 1021 millibars (mb). I have added four orange arrows that highlight the location of the 1016 mb contour. On an east to west basis the dome of air pressure greater than 1016 mb is over a 1000 miles with a peak at 1021. North south the dome is even longer. This weak pressure gradient led to extraordinarily weak wind production for New York’s land-based and offshore wind generators (Table 2).
Figure 4: June 29, 2026 Weather Map at 7:00 AM EST

Table 2: Hourly Data for June 29, 2026
I maintain that New York dodged a bullet because the center of the high pressure system was mostly south of New York for the rest of the event as opposed to June 29. Consider July 1 as shown in Figure 5. The pressure gradient on this day between 1012 mb and 1016 mb is on the order of 300 miles as opposed to 500 miles on June 29. Table 3 lists the hourly data statistics for the two days. It is important to note that even though July 1 wind resources are better the average generation was only 1,000 MW which represents 35% of the total NYS wind capacity of 2,858 MW. That is not terrible, but it surely is not good.
Figure 5: Jul 1, 2026 Weather Map at 7:00 AM EST

Table 3: Hourly Wind Statistics for June 29 and July 1
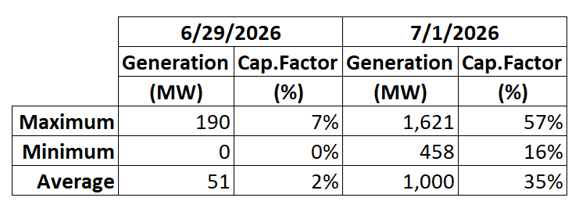
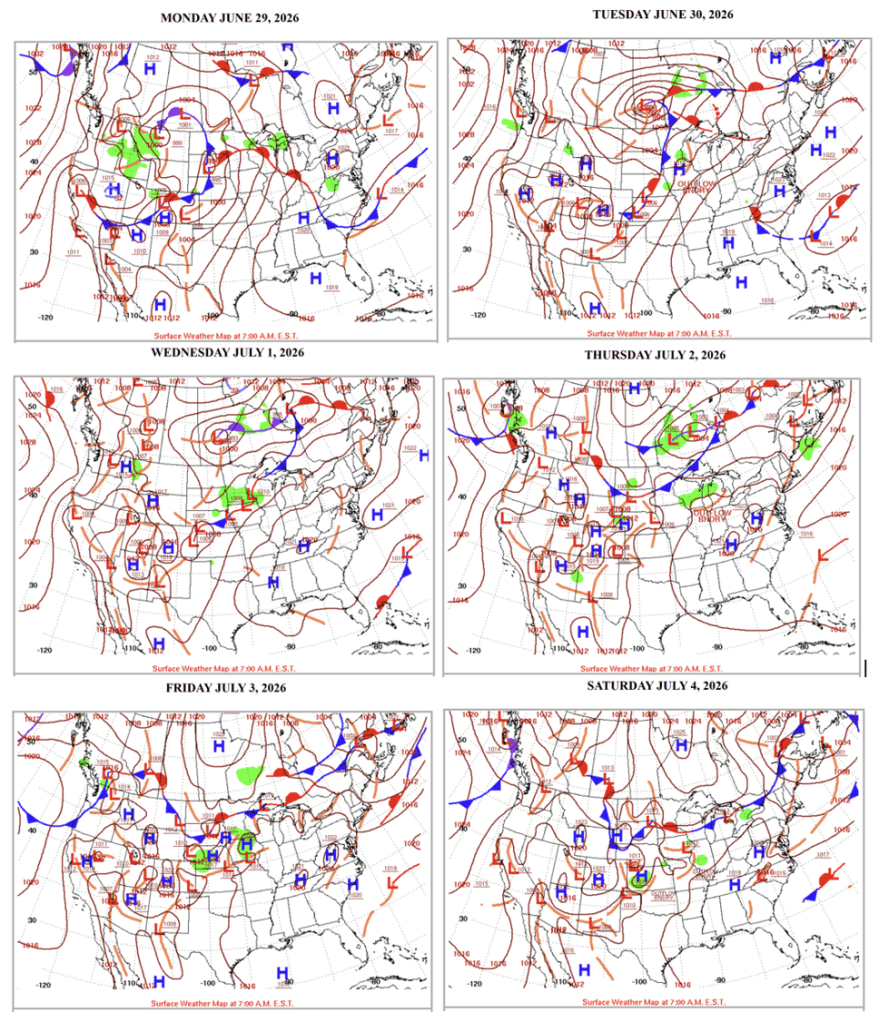
Figure 6 shows all the weather maps for the episode and I have prepared documentation with more details. The location of the high pressure ridge or dome was far enough away from New York that wind speeds did not drop off like they did on the June 29.
Figure 6: June 29 – July 4, 2026 Weather Maps at 7:00 AM EST
Because Behind-the-Meter solar data are only provided in the NYISO Operations Performance Metrics Monthly Report I was not able to determine the solar resources available. I would expect that they would be as good as they can get because the weather system had few clouds, the days were about as long as they can get and the solar angle maximized solar radiation to the panels.
Conclusion
There is no meteorological reason that the high-pressure system ridge or heat dome could not have been centered close enough to New York to replicate the poor wind resource availability or that these conditions could not have persisted longer. The takeaway message from the 2026 extreme winter and summer weather observed is that in the winter solar can go to zero availability and wind availability can go to zero at any time. This makes providing reliable electricity using an electric system that dependent upon wind and solar extremely challenging. In my opinion the challenge is so large that it is more appropriate to rely on nuclear power as the backbone of the future electric system.


