I recently analyzed how New York’s grid performed during the late-June/early-July 2026 heat wave. This post updates that analysis with a New York Independent System Operator (NYISO) presentation on the heatwave.
I am convinced that implementation of the Climate Leadership & Community Protection Act (Climate Act) net-zero mandates will do more harm than good if the future electric system relies only on wind, solar, and energy storage because of reliability and affordability risks. The opinions expressed in this article do not reflect the position of any of my previous employers or any other organization I have been associated with, these comments are mine alone. I acknowledge the use of Perplexity AI to generate summaries and references included in this document.
Overview
The Climate Act established a New York “Net Zero” target (85% reduction in GHG emissions and 15% offset of emissions) by 2050. Although the original interim 2030 target of a 70% renewable energy electricity mandate has been modified, there still are requirements that require much greater use of wind and solar energy generation.
Electric systems must be built around reliability during peak demand. One of my primary concerns with the Climate Act renewable energy mandates is weather variability because the conditions that characterize the highest loads also have the weakest expected wind resource availability. That makes electric resource planning for reliability during the peak period especially challenging. .
My post on the performance of New York’s grid performance during the late-June/early-July 2026 heat wave described strong, persistent upper-level ridge and associated surface high forming a classic summer pattern—now branded a “heat dome”—that trapped hot, humid air and stressed electric systems across most of the country.
I found that the fuel-mix profile over the heat wave showed nuclear at 16% and fossil fuels at 64%, meaning 80% of energy came from non-renewables; renewables provided 20%, but hydro alone was 15%. Those actual operations numbers contrast poorly with statutory mandates—70% renewables by 2030 and 100% zero-emissions by 2040. The data make clear that under classic high-load, low-wind conditions, New York remains heavily dependent on thermal generation, and that building a reliable peak system replacing that with wind, solar, and energy storage alone would be extremely challenging.
The NYISO has been flagging narrow reliability margins, growing dependence on emergency actions, and sensitivity to gas supply and extreme weather for several years. For example:
- Summer 2026 Capacity Assessment (Operations Committee): NYISO shows a baseline summer capacity margin of just 417 MW, the lowest in recent history, and warns that under plausible extreme‑heat scenarios the margin turns sharply negative, requiring up to 3,166 MW of emergency operating actions to maintain reliability.
- NYISO press release “New York Electric Grid Faces Narrow Reliability Margin Heading Into Summer” (April 23, 2026): The NYISO cautions that “extreme weather and aging generation pose significant risks to reliability” and that, under a three‑day heatwave with average daily temperature of 95–98 °F, capacity margins would be ‑1,679 MW to ‑3,370 MW, forcing operators to rely on emergency procedures.
This post describes a presentation that summarizes issues that showed up in the July 2026 heatwave that push these concerns from theory to high-risk reality.
NYISO July 2026 Heatwave
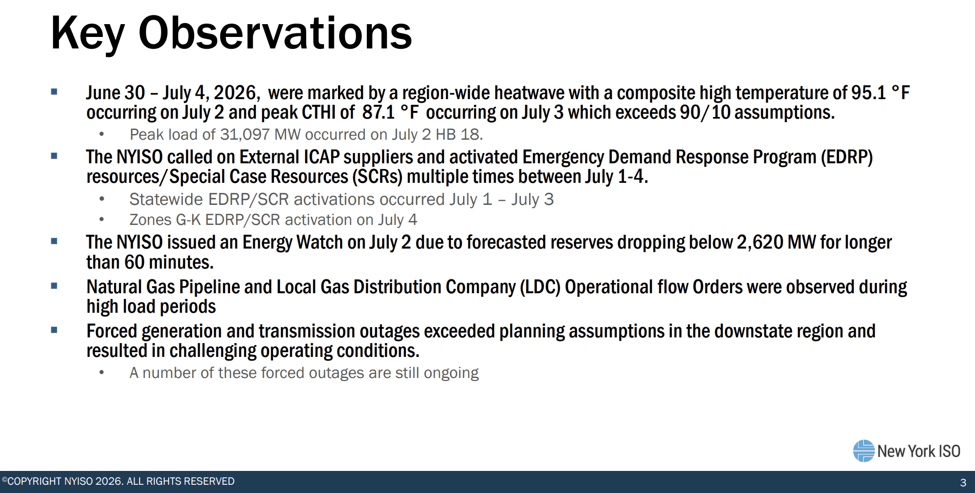
Aaron Markham from the NYISO presented a summary of the July 2026 heatwave to the Operating Committee. While there was some overlap with my post, he had access to other relevant information. We both addressed weather and loads and the real-time fuel mix. His presentation discussed unavailable capacity, transmission outages, interchange flows with neighboring areas, and demand response. Figure 1 lists five key observations about the electric system during the heat wave.
Figure 1: NYISO Presentation Key Observations
Source: NYISO July 2026 Heatwave Presentation
Weather and Loads
The first key observation in Figure 1 described the weather during the event. Most of this is self-explanatory but the “peak CTHI of 87.1 °F” reference and the “90/10 assumptions” is not. CTHI is NYISO’s Cumulative Temperature Humidity Index, a three‑day weighted temperature‑humidity metric used to represent heat stress on the system more accurately than regular temperature alone. The reference “exceeds 90/10 assumptions” means that the observed CTHI during the heat wave was higher than the extreme‑weather (90th‑percentile) conditions NYISO uses in its summer capacity and peak‑load planning studies.
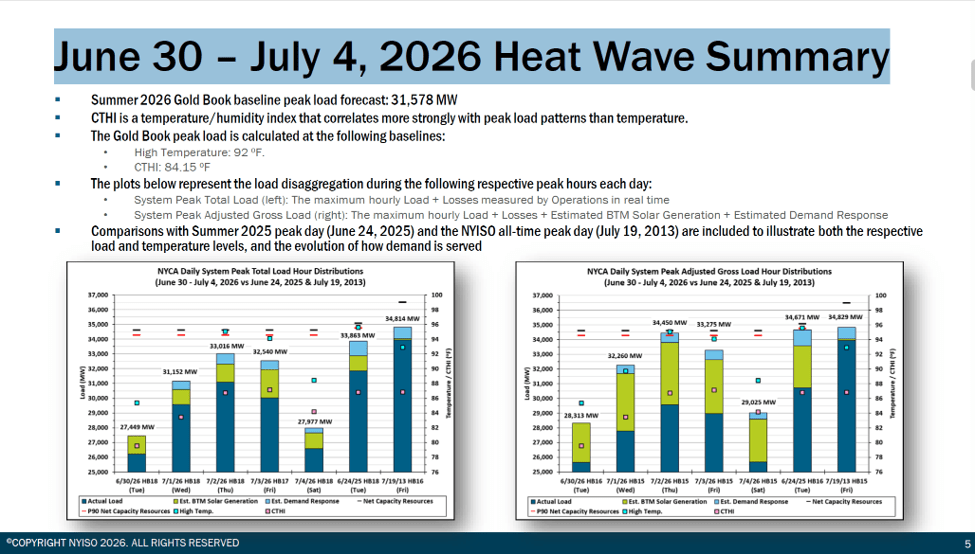
The NYISO presentation included a couple of interesting graphs describing the weather and load. The summary of the heat wave compares this episode with the NYISO all time high load day (Figure 2). The observed peak load of 31,097 MW occurred on July 2 which is pretty close to the baseline peak load projection of 31,578 MW.
Figure 2: June 30 – July 4, 2026 Heat Wave Summary
Source: NYISO July 2026 Heatwave Presentation
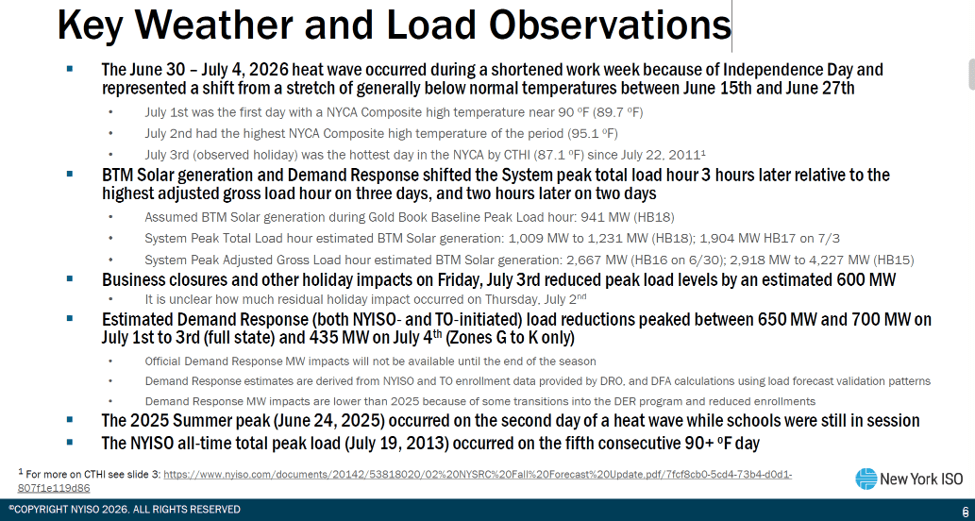
In my analysis I mentioned that the loads could have been much worse. Figure 3 details factors affecting load during the heat wave.
Figure 3: Key Weather and Load Observations
Source: NYISO July 2026 Heatwave Presentation
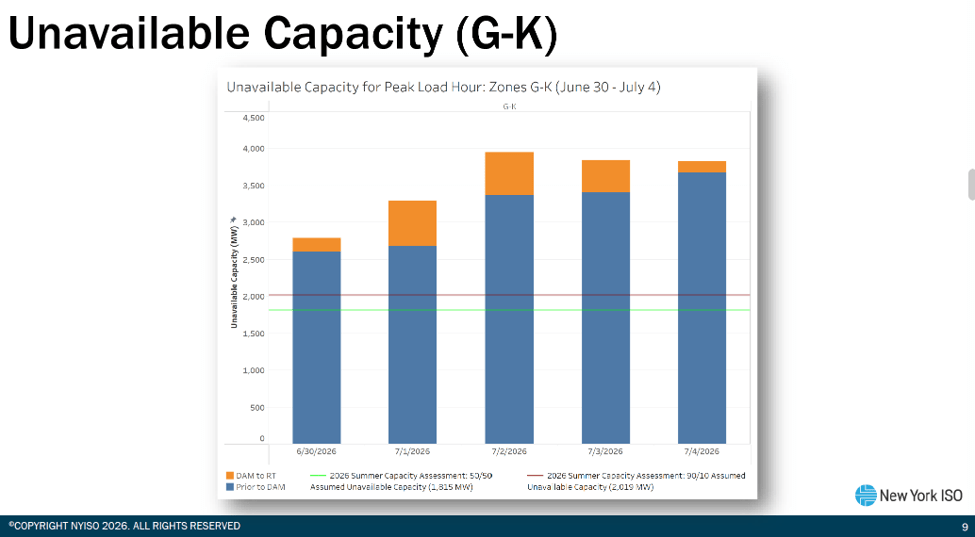
One of the key observations was that forced generation and transmission outages exceeded planning assumptions in the downstate region and resulted in challenging operating conditions. Each stacked bar in Figure 4 represents total unavailable capacity on a given day, with the blue portion labeled Prior to DAM (Day Ahead Market) and the orange portion labeled DAM to RT (Real Time). Prior to DAM means units or resources that were already unavailable before the day-ahead market ran, so NYISO could at least account for those outages in its day-ahead commitment and dispatch plan.
DAM to RT means additional capacity that was available or expected in the day-ahead case but then became unavailable during the day. The horizontal lines show the assumed unavailable-capacity levels from NYISO’s 2026 Summer Capacity Assessment under two planning cases. It is concerning that downstate New York entered the July heat wave with far more power plants already out of service than planners normally expect and then lost still more capacity as the days went on, making grid operations much tougher than the official summer assumptions anticipated.
Figure 4: Unavailable Generating Capacity in New York City and on Long Island
Source: NYISO July 2026 Heatwave Presentation
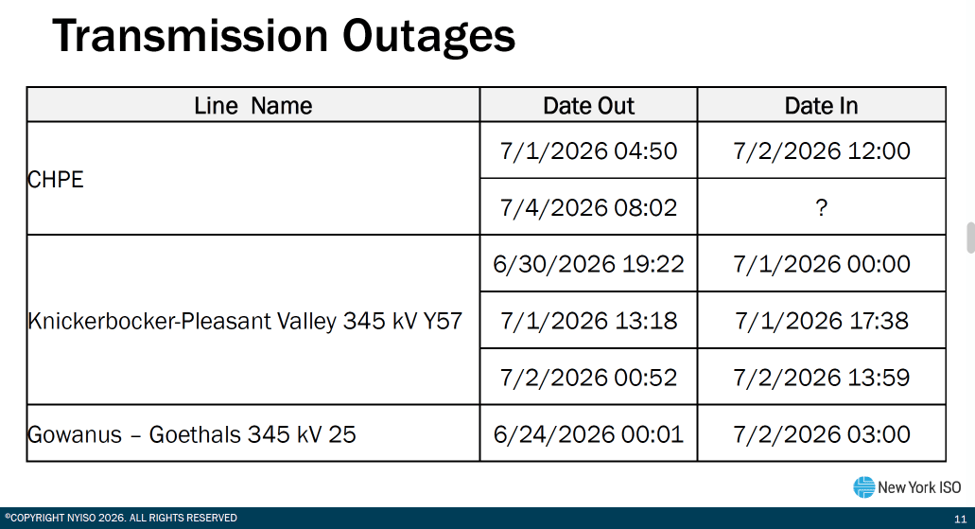
Figure 5 lists the transmission outages during the heat wave. CHPE is the nearly commissioned Champlain Hudson Power Express transmission line that is supposed to bring 1,250 MW of emissions-free electricity from Quebec directly into New York City precisely to address summer peak loads. It only worked for 32 hours during the heat wave and has yet to return to service at this time. (20 July 2100)
Figure 5: NYISO Transmission Line Outages
Source: NYISO July 2026 Heatwave Presentation
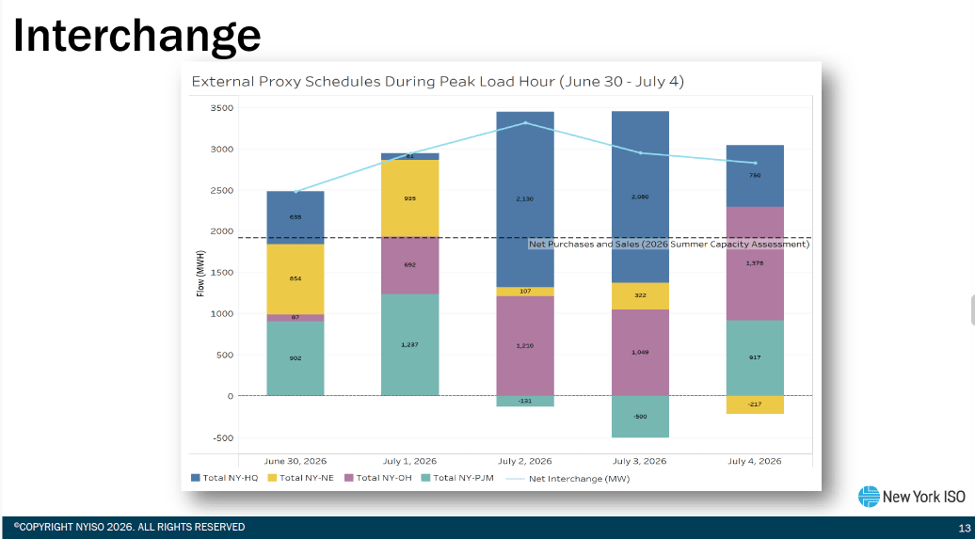
Figure 6 describes the flow of energy during the heat wave between New York and surrounding electric systems. It shows that, during the peak‑load hours of the June 30–July 4 heat wave, New York was leaning heavily on imports from its neighbors to keep the lights on. The stacked bars break out scheduled flows from Hydro‑Québec even without CHPE, New England, Ontario, and PJM, and the overlay line shows net interchange—imports minus exports—on each day’s peak hour. Net imports are consistently above the level assumed in NYISO’s Summer 2026 Capacity Assessment. The chart says that New York needed substantial help from surrounding regions at the exact hours when its own system was most stressed, and that actual reliance on imports was greater than the “normal” planning assumptions, underscoring how tight New York capacity margins have become.
Figure 6: Interchange Flows with Neighboring Areas
Source: NYISO July 2026 Heatwave Presentation
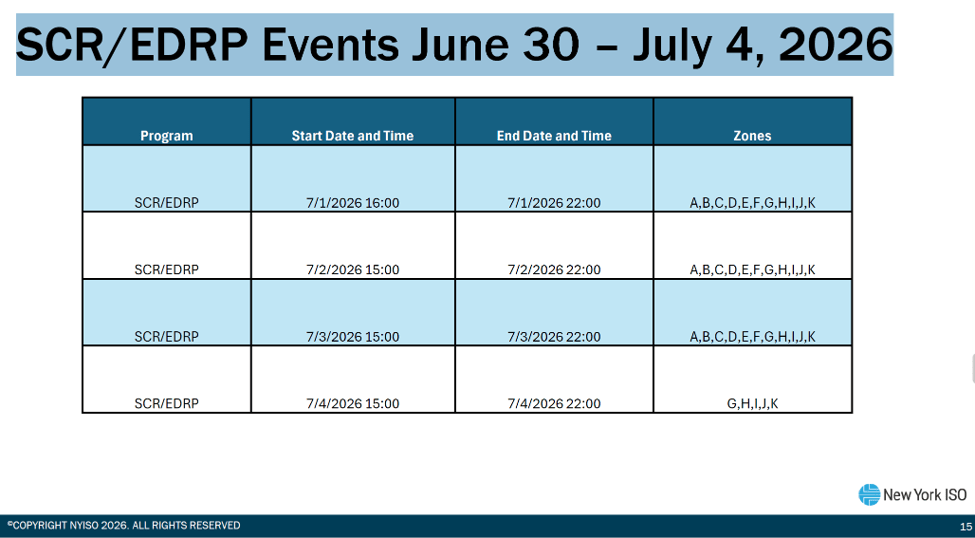
Figure 7 lists the SCR/EDRP Events June 30 – July 4, 2026. SCR stands for Special Case Resources, and EDRP stands for the Emergency Demand Response Program, both of which are NYISO demand‑response programs that pay large customers to cut their electricity use when the grid is under stress. Figure 6 shows that these emergency tools had to be activated across most of the state on three consecutive days (July 1–3) and again in downstate zones on July 4, which means the system could not meet demand with available generation and imports alone and had to lean on voluntary or obligated load curtailments just to maintain reliability. This pattern is a clear sign of a fragile grid: instead of having enough built‑in capacity margin to ride through a fairly typical multi‑day heat wave, NYISO had to call on “last‑line‑of‑defense” customer cutbacks four days in a row, indicating that routine weather now pushes the system up against its limits.
Figure 7: SCR/EDRP Events June 30 – July 4, 2026
Source: NYISO July 2026 Heatwave Presentation
One of the key observations stated: “The NYISO issued an Energy Watch on July 2 due to forecasted reserves dropping below 2,620 MW for longer than 60 minutes.” NYISO defines an “Energy Watch” as the point where operating reserves are forecast to fall below 2,620 MW for more than an hour, even though there are still enough resources on paper to meet demand. In practical terms, it’s a first level warning that the cushion of standby generation and imports the system relies on to ride through contingencies is getting uncomfortably thin. During these conditions operators start lining up extra units, lean harder on demand response, and ask customers to conserve in order to avoid escalating into an “Energy Warning” or full emergency. The fact that NYISO had to issue an Energy Watch on July 2 because reserves were expected to dip below this threshold tells you that a fairly ordinary summer heat wave was enough to erode the safety margin the grid is supposed to maintain. This is a clear sign that the system is operating closer to the edge than in the past.
Another key observation stated that “Natural Gas Pipeline and Local Gas Distribution Company (LDC) Operational flow Orders were observed during high load periods”. Operational Flow Orders (OFOs) are directives that gas pipelines and local gas distribution companies issue when the gas system is under strain and they need customers – especially large users like power plants – to keep their gas use tightly in line with what they’ve scheduled, or face penalties and possible curtailments. When NYISO notes that OFOs were in effect during the July heat wave, it means gas operators were already worried about maintaining safe pressures and overloaded pipelines at the same time the electric grid was depending heavily on gas‑fired units to meet peak air‑conditioning load.
That combination is a red flag for the public because it shows both the gas and electric systems were being pushed close to their limits at once. Tight gas conditions can force generators to reduce output just when demand is highest, shrinking the real reserve margin and making the grid more vulnerable to a single large contingency. In the winter natural gas heating raises the demand, and power plants are required to switch fuels to more expensive fuels. If this kind of gas constraint becomes a recurring feature of hot days, New Yorkers should expect more frequent price spikes, calls to conserve, and a higher risk that even routine heat waves could trigger emergency actions or outages. There is a second-order impact as well. Many power plants have limits on the number of hours that they can burn alternate, higher polluting fuels. If this situation happens frequently enough then this could limit operations from the facilities that provide critically needed energy.
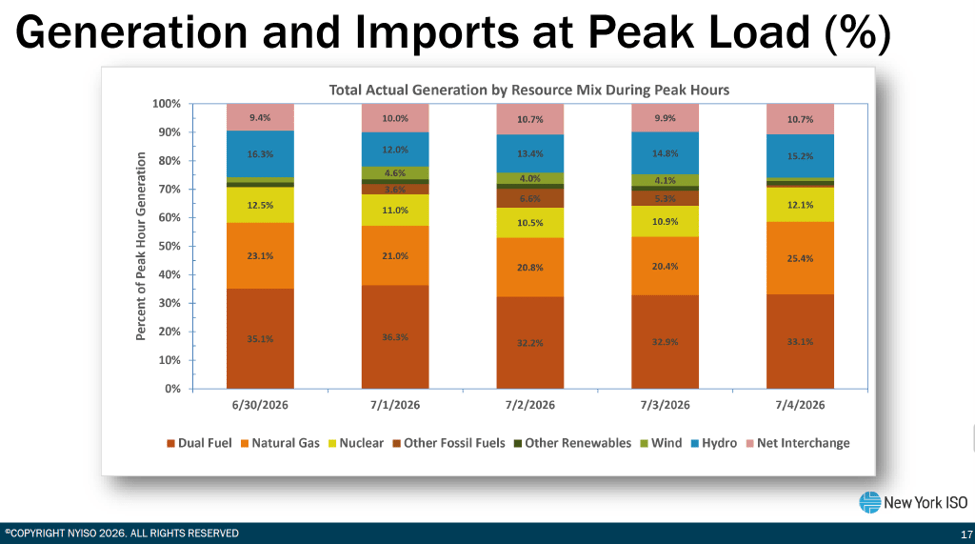
Figure 8 lists generation and import percentages at peak load. My analysis found that the fuel-mix profile over the heat wave showed nuclear at 16% and fossil fuels at 64%, meaning 80% of energy came from non-renewables; renewables provided 20%, but hydro alone was 15%. On July 3 renewables produced 41% of the power but on the previous day renewables only produced 20%. The significant fraction of wind was made possible because the edge of the heat dome was close to New York. If we were closer to the center, then the wind support at peak load would have been much smaller. The other observation is that imports accounted for 10% of the energy at peak loads. Because other electric systems are facing similar problems this may not be possible in the future.
Figure 8: Generation and Imports at Peak Load (%)
Source: NYISO July 2026 Heatwave Presentation
Conclusion Recent NYISO documents explicitly warned that the kinds of problems highlighted by the July 2026 heatwave—thin reserve margins, dependence on emergency actions, and fuel constraints—were coming. These warnings are translating into observations. The risks of a fragile electric system must be addressed, or contingencies or worse weather will occur that cause a blackout. If the system becomes overly reliant on weather dependent resources that

 Pragmatic Environmentalist of New York