More on the Enormous Ratepayer Costs of the Climate Act

Earlier this week I published an article about the enormous ratepayer costs of the Climate Leadership & Community Protection Act (Climate Act).  The basis of that article was the Public Service Commission (PSC) first annual informational report on the implementation of the Climate Act.  This article documents cost impacts of the Climate Act in the evidentiary hearing comments for the  New York State Electric & Gas Corporation and Rochester Gas & Electric rate cases. 

I have been following the Climate Act since it was first proposed, submitted comments on the Climate Act implementation plan, and have written over 350 articles about New York’s net-zero transition.  I have devoted a lot of time to the Climate Act because I believe the ambitions for a zero-emissions economy embodied in the Climate Act outstrip available renewable technology such that the net-zero transition will do more harm than good.  The opinions expressed in this post do not reflect the position of any of my previous employers or any other company I have been associated with, these comments are mine alone.

Background

The Climate Act established a New York “Net Zero” target (85% reduction and 15% offset of emissions) by 2050.  It includes an interim 2030 reduction target of a 40% reduction by 2030 and a requirement that all electricity generated be “zero-emissions” by 2040. The Climate Action Council is responsible for preparing the Scoping Plan that outlines how to “achieve the State’s bold clean energy and climate agenda.”  In brief, that plan is to electrify everything possible using zero-emissions electricity. The Integration Analysis prepared by the New York State Energy Research and Development Authority (NYSERDA) and its consultants quantifies the impact of the electrification strategies.  That material was used to develop the Draft Scoping Plan.  After a year-long review, the Scoping Plan recommendations were finalized at the end of 2022.  In 2023 the Scoping Plan recommendations are supposed to be implemented through regulation and legislation.  In addition, as the utilities determine what expenditures are necessary to support the Climate Act goals those costs are incorporated into their rate case requests.

Before the utilities in New York were de-regulated there were seven vertically integrated utility companies serving New York.  Even though those companies have been re-organized the rate case proceedings are based on the original service territories.  Subsequent to de-regulation New York State Electric & Gas (NYSEG) and Rochester Gas & Electric (RG&E) were purchased by Spanish owned Iberdrola and both companies are now in Avangrid.   Avangrid Networks, Inc. is a subsidiary of Avangrid, Inc. and “combines the resources and expertise of eight electric and natural gas utilities with a rate base of $11.7 billion, serving 3.3 million customers in New York and New England.” This article documents post

hearing comments related to the NYSEG electric rate case 22-E-0317, RGE electric rate case 22-E-0319, the NYSEG gas rate case 22-G-0318, and the RGE gas rate case 22-G-0320 that address Climate Act costs.

Evidentiary Hearing

The Department of Public Service (DPS) hearing brief explains the purpose of the evidentiary hearing:

An evidentiary hearing was held in these proceedings on July 17, 2023 and July 18, 2023. The

purpose of the hearing was to receive into evidence and evaluate the Joint Proposal (JP) filed on June 14, 2023. The hearing also provided an opportunity to consider the reasonableness of the JP and develop the record to determine whether the JP is in the public interest in accordance with the Settlement Guidelines of the New York Public Service Commission (Commission). At the hearing, Alliance for a Green Economy (AGREE), Multiple Intervenors (MI), Public Utility Law Project (PULP), AARP, Fossil Free Tompkins (FFT), and Ratepayer and Community Intervenors (RCI) conducted limited cross-examination of the Department of Public Service Trial Staff (Staff) and the New York State Electric & Gas Corporation (NYSEG) and Rochester Gas and Electric Corporation (RG&E; collectively, the Companies) Panel who testified in support of the JP.

The hearing addressed specific issues raised by the parties.  I am going to focus on the MI’s cross-examination concerning the affordability of the revenue requirements and other comments related to affordability.

DPS Hearing Brief

The DPS hearing brief argued that the JP helps customers with affordability by mitigating the revenue requirement (Note that all the footnote references have been excluded for clarity):

At the evidentiary hearing, MI’s cross-examination implied that Staff did not adequately consider affordability as part of its analysis of the provisions contained in the JP. Furthermore, MI questioned whether Staff was “aware of the relative economic conditions impacting …your handling of these rate proceedings?” In fact, the JP addresses affordability by: 1) reducing the Companies’ proposed expenditures from their initial filing; 2) accelerating the amortization of the excess depreciation reserve (EDR); and 3) phasing in a necessary increase in storm reserve rate allowance over the term of the rate plan. These provisions significantly reduce the revenue requirement to make the rates more affordable for customers.

The DPS explanation claims that the “proposed revenue requirement increases in the current cases are largely due to the impact of the Covid-19 pandemic (Pandemic) during the Companies’ last rate cases.”  During the Pandemic the PSC reduced rate increases “to help customers who were facing economic upheaval by limiting rate increases to less than two percent total bill impact in each rate year of the rate plan”. To achieve this reduction, the PSC cut cost recovery for “energy efficiency program and vegetation management spending; limited recovery of certain storm regulatory assets by extending the time period over which the costs would be amortized; and passed back several regulatory liabilities to customers in an expeditious time period.”  They note:

These efforts were warranted given the magnitude of the economic impacts that the Companies’ customers faced at that time, however, these costs and resulting build up of regulatory assets at both NYSEG electric and RG&E electric now have to be addressed in the current proceeding. Although there are unavoidable rate drivers in these cases, Staff has worked diligently to mitigate the impact of the revenue requirements on customers, which is reflected in the JP.

The DPS staff claims that they reduced the revenue requirements in several ways.  NYSEG and RGE have reduced discretionary capital expenditures. They “reprioritized the Companies’ electric capital budget and delayed several infrastructure projects that do not address immediate safety and reliability needs.”  The DPS brief notes states that “When compared to the initial filing, the JP reflects a reduction to the requested electric capital budget from 2024 through 2026 by $2.28 billion for NYSEG and $280.59 million for RG&E.”  My interpretation of this is that these projects will still be needed in the future so they are just being delayed so that this rate increase is not so bad.

Another major cost savings related to vegetation management programs.  These programs are needed to improve system reliability and reduce tree-related outages.  The JP proposes a vegetation management program that sets NYSEG on a longer cycle of vegetation trimming projects.  There is a tradeoff here between the desire to reduce outages and costs.

The JP also utilizes additional excess depreciation reserve (EDR) funds to reduce revenue requirements and help address affordability for customers. This looks like accounting magic to reduce costs but the brief claims that they will be “within the 10% band commonly accepted by the Commission.”   It goes on to say “Using any additional EDR could negatively impact the Companies’ credit ratings and would lead to an inevitable sharp rate increase or a hockey stick in subsequent rate cases, when there simply is not any additional EDR that can be used.”

In another example of accounting magic to keep the costs down the JP changes the major storm Operations and Maintenance (O&M) expense allowance to lessen the impact on customers. If there is a major storm and more money is needed than set aside this will come back and result in less timely storm restoration.  “Although the revenue requirement allowances for major storm restoration should be much higher based on historical levels experienced at the Companies, Staff supports the inclusion of a lesser amount to mitigate the immediate rate impact on customers.

The DPS brief concludes that “even with the proposed increases, the rates for residential customers of both Companies will remain among the lowest in the State, which demonstrates that the provisions referenced above will help to keep rates affordable for customers.”

Conspicuous by its absence was any mention of Climate Act spending.

Climate Act Spending

The costs associated with the Climate Act were not a subject of the evidentiary hearing.  In order to estimate those costs I relied on the June 29, 2022 Technical Conference presentation.  I did not try to determine if the costs in this initial proposal are still the same as what ended up in the final rate case but I believe the results are indicative.  The following slide lists capital expenditure estimates that includes costs for the Climate Act.

The important part of the slide is the following excerpt.

The following table calculates the total and lists percentages for each program. 

There are three capital expenditure programs that are directly associated with the Climate Act.  The Electric and Common Capital Expenditures Testimony describes plans.  The following plans were associated with the search term “CLCPA” that I think are included in the CLCPA category:

  • CLCPA Transmission Projects Phase 1
    • Project Description: The CLCPA Phase 1 Transmission Projects consist of 23 projects for the purpose of unlocking transmission-connected renewable resources by increasing headroom on the system.
  • CLCPA Transmission Projects Phase 2 “Areas of Concern”
    • Project Description: The CLCPA Phase 2 “Areas of Concern” Transmission Projects consist of 46 projects for the purpose of unlocking an incremental amount of transmission-connected renewable resources and to increase headroom on the system.
  • Low Income Clean Generation
    • Program Description: This project will develop one or more solar photovoltaic (“PV”) facilities at both NYSEG and RG&E. NYSEG will install 50 MW of installed capacity while RG&E will install 20 MW of installed capacity
  • EV Charging Hub Project
    • Project Description: This project is a large-scale, purpose-built facility that will serve 10 corridor charging needs for light-duty, medium-duty, and heavy-duty vehicles within the NYSEG service area.

The other two programs are Make Ready and Ithaca Electrification. Make Ready supports electric vehicle (EV) charging infrastructure:” With our new Make-Ready Program, businesses can now quickly install electric vehicle (EV) charging stations with up to 100 percent reimbursement of costs for the electrical improvements needed to support EV charging.”  The Ithaca Electrification project is described as local transmission and distribution projects needed to  address existing reliability needs and will help to support timely execution of the City of  Ithaca’s electrification initiative.”  The following might be another description of this initiative.

In addition to the capital expenditure projects other clean energy initiative within the rate case were described that support the Climate Act.

Another major Climate Act initiative is energy efficiency support.  The presentation describes the associated costs as follows:

These energy efficiency programs are part of a New York State Energy Research & Development Authority program.  New Efficiency: New York (NE:NY) is a “comprehensive mix of strategies to support building developers, commercial and institutional building owners, industrial facilities, and residential households to pursue improvements that reduce energy consumption across the State. These efficiency improvements will enable New York to meet an ambitious new target of 185 trillion Btus (British thermal units) of end-use energy savings below the 2025 energy-use forecast. That’s equivalent to saving the energy consumed by 1.8 million New York homes.”

Apparently DPS staff had an issue with the proposed costs and this was an issue during negotiations.  The following table shows the differences.

Affordability Issue

Three parties addressed affordability. The Public Utility Law Project of New York, Inc. (PULP) post-hearing brief described the JP rate increases as a ratepayer  “affordability crisis”.  AARP New York called the rate increases “unjust and unreasonable”.  Multiple Intervenors commented that the “delivery rate increase are enormous” and “unprecedented”. 

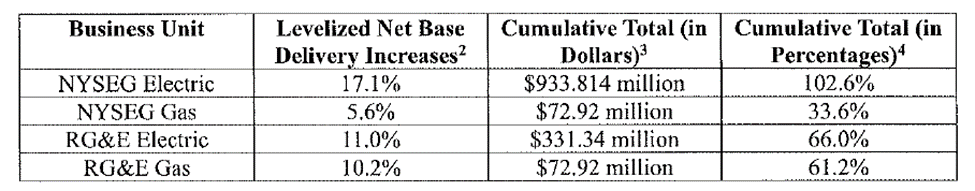
Multiple Intervenors argued that the delivery rate impacts are magnitudes higher than the impacts that the Commission previously found to be unacceptably high and included the following summary table of impacts.  The cumulative percentage total reflects the fact that the first rate-year is in effect for all three years, the second rate-year is in effect for two years, and the final rate-year is in effect for one year.  That approach projects that NYSEG electric delivery rates will be double the current rate in three years

Safety Valve

None of the comments raised the safety valve conditions for affordability in New York Public Service Law  § 66-p (4). “Establishment of a renewable energy program”.   §66-p (4) states: “The commission may temporarily suspend or modify the obligations under such program provided that the commission, after conducting a hearing as provided in section twenty of this chapter, makes a finding that the program impedes the provision of safe and adequate electric service; the program is likely to impair existing obligations and agreements; and/or that there is a significant increase in arrears or service disconnections that the commission determines is related to the program”. 

Unfortunately, the Hochul Administration has never defined these criteria which I believe should have been a primary responsibility of the Climate Action Council.  The criteria used to define “safe and adequate electric service” and “significant increase in arrears or service disconnections” should be defined so that proceedings like this have acceptability limits.   

Multiple Intervenors expressed the frustration of ratepayers relative to the desire to support the Climate Act within certain bounds of affordability:

Multiple Intervenors supports reasonable efforts to maintain, if not improve, electric and gas reliability and customer service, and reduce greenhouse gas emissions. Significantly, however, customers of all types need to be able to afford electric and gas service, and that is where the Joint Proposal fails miserably. Although Multiple Intervenors identified many specific areas of concern regarding the Joint Proposal in prior submissions, it is not in a position to unilaterally rebalance often-competing priorities to fix the Joint Proposal’s numerous shortcomings. Rather, that authority and responsibility rests solely with the Commission. Multiple Intervenors urges the Commission to (i) conclude that the balancing of priorities reflected in the Joint Proposal fails to weigh affordability concerns adequately, and (ii) take decisive action to ensure that delivery rate impacts are moderated to acceptable levels. This is no “ordinary” Joint Proposal, the Commission needs to reject or modify it to protect customers from excessive delivery rate impacts.

Climate Act Cost Discussion

The rationale for the increased costs ignores the costs of the Climate Act.  I did not find specific information in the Proceeding documentation that summarized all the costs.  Note, however, that most of the capital expenditures are related to Climate Act costs which I believe are primarily due to transmission upgrades necessary to get solar and wind project energy to where it is needed.   As an aside the primary place it is needed is New York City so Upstate ratepayers are paying to support that need. The bottom line for the Climate Act portion of the capital expense in rate year 4/23 to 3/24 is $603 million of $1,085 million (56%) total.  If the costs for advanced metering infrastructure (smart meters) are included as Climate Act costs which I believe is appropriate the rate year costs are $713 million or 66% of the total.

JP Climate Act Implementation

I believe that a major problem with Climate Act implementation is that the vast sums of money attract crony capitalists and rent-seeking opportunists all eager to take advantage of the money.  This money is going to come out of the pockets of New Yorkers so these grifters need to be called out.  The parent company of NYSEG and RGE is a good example of a company taking advantage of the Climate Act to reduce their risks and make money.

Iberdrola brags about their commitment:

The Iberdrola group has undergone a profound transformation, anticipating the current energy transition by 20 years to meet the challenges of climate change and the need for a clean, reliable and smart business model.

Today, it is a leader in renewables and smart grids, has a diversified portfolio of businesses and geographies, is present in highly rated countries and has demonstrated its financial strength, expertise and execution capabilities. Furthermore, 90% of the group’s long-term investment plan is aligned with the green investment criteria included in the EU taxonomy.

Briefing comments show how they are trying to fleece ratepayers under the guise of supporting the energy transition.  Commenters argued that the proposed earning adjustment mechanism, incentive awards for non-wires alternatives and procurement of environmental attributes, and treatment of Climate Act-related capital expenditures all increase the rate case request at the expense of consumers.

This article is already too long so I am not going to delve into specifics of all these adjustments.  One example will have to suffice.  PULP addressed the 9.2% return on equity (ROE) included in the JP.  ROE is considered a gauge of a corporation’s profitability and how efficient it is in generating profits. PULP explains:

The Companies are looking to increase from the current ROE of 8.8%, to the 9.2% ROE, which substantially adds to the already historic rate increases included in this JP. PULP generally urges careful consideration of every aspect of the JP when looking for ways to cut costs. Specifically, we urge the ALJs and the Commission to modify the JP so that the ROE is not set through confidential settlement negotiations, but rather through calculations using the generic finance model, while also providing for an annual recalculation.

The PULP comment argues that uncertainties associated with the Climate Act are not an appropriate reason to increase the ROE as asserted in the JP.  They note that it is “reasonable to assume that the risks presented by the CLCPA would be addressed in a manner that is consistent with past Commission policy that utilities should be able to recover all their operating costs and an adequate return on their investments, assuming efficient and economical management”.  Cynics like me look at this kind of sweetheart deal and wonder if this part of the political calculus of the Climate Act.  The utilities that know that there are enormous affordability and reliability risks for the net-zero transition get a bit more profit for not speaking up about those risks.

Conclusion

The bottom line is that Climate Act costs are a major factor in the extraordinarily large rate case request.  No one has stepped up to say that this is an issue in this instance and every future rate case for every New York utility is going to have to have similarly large costs.

Public Service Law §66-p (4) requires consideration of affordability and reliability for Climate Act implementation but the specific criteria have not been defined.  New York GHG emissions are less than one half of one percent of global emissions and global emissions have been increasing on average by more than one half of one percent per year since 1990.  The Hochul Administration has no plan in place to address affordability.   As a result, New York emission reductions are not going to affect climate change, so it is unacceptable to prove that affordability and reliability considerations are not adversely affected.

The PULP briefing notes that recent collection activity reports are a good indication of whether residential customers are currently able to pay their bills.  They note:

Unfortunately, these numbers are striking. As of June 2023, 130,637 residential NYSEG accounts were behind on their payments by 60-days or more, for a total of $79.3 million. For RG&E, 78,112 residential accounts were behind on their bills for a total of $61.8 million.

It is unimaginable to me that any reasonable affordability criterion defined per Public Service Law §66-p (4) would find that these rate case impacts would be acceptable.  The PSC should temporarily suspend or modify the obligations of the Climate Act until we have a better understanding of the costs to implement the Act.

Climate Act Ratepayer Costs Will be Enormous

I sent a link to my All Otsego commentary Zero Emissions Transition Realistic to my distribution list and received some feedback that prompted this article.  The commentary noted that the Public Service Commission’s first annual informational report on the implementation of the Climate Leadership & Community Protection Act (Climate Act) included the first admission of ratepayer costs.  It mentioned that more costs were coming but I did not estimate specific ratepayer impacts and the feedback suggested that information would be useful.  .  In the worst case, my analysis estimates that upcoming Climate Act related costs for every utility in the state will be greater than the total current monthly bill.

I have been following the Climate Act since it was first proposed, submitted comments on the Climate Act implementation plan, and have written over 300 articles about New York’s net-zero transition.  I have devoted a lot of time to the Climate Act because I believe the ambitions for a zero-emissions economy embodied in the Climate Act outstrip available renewable technology such that the net-zero transition will do more harm than good.  The opinions expressed in this post do not reflect the position of any of my previous employers or any other company I have been associated with, these comments are mine alone.

Climate Act Background

The Climate Act established a New York “Net Zero” target (85% reduction and 15% offset of emissions) by 2050.  It includes an interim 2030 reduction target of a 40% reduction by 2030 and a requirement that all electricity generated be “zero-emissions” by 2040. The Climate Action Council is responsible for preparing the Scoping Plan that outlines how to “achieve the State’s bold clean energy and climate agenda.”  In brief, that plan is to electrify everything possible using zero-emissions electricity. The Integration Analysis prepared by the New York State Energy Research and Development Authority (NYSERDA) and its consultants quantifies the impact of the electrification strategies.  That material was used to develop the Draft Scoping Plan.  After a year-long review, the Scoping Plan recommendations were finalized at the end of 2022.  In 2023 the Scoping Plan recommendations are supposed to be implemented through regulation and legislation.  In 2024, and every two years thereafter, there will be a program review of the progress in meeting the overall targets for deployment of renewable energy systems and zero emission sources and annual funding commitments and expenditures.

According to the Public Service press release:

The Climate Act’s directives require the Commission to build upon its existing efforts to combat climate change through the deployment of clean energy resources and energy storage technologies, energy efficiency and building electrification measures, and electric vehicle charging infrastructure. In recognition of the scale of change and significant work that will be necessary to meet the Climate Act’s aggressive targets, the Commission directed DPS staff to assess the progress made in line with its directives under the Climate Act and to provide guidance, as appropriate, on how to timely meet the requirements of the Climate Act.

The Scoping Plan does not provide any ratepayer cost impacts but the New York State Department of Public Service First Annual Informational Report on Overall Implementation of the Climate Leadership and Community Protection Act (Informational Report”) does provide estimates for 2022.  I have published three articles about the Informational Report: first impressions,  a comparison of the goals in the report and the New York Cap-and-Invest (NYCI) Program Reference Case with respect to affordability implications of the Informational Report and NYCI.

Ratepayer Impacts in Informational Report

Much of the information in this section was previously published here.  I converted the tables in the Informational Report to a spreadsheet so that I could combine the data from multiple tables.  Three tables are of particular interest: Table 4: 2022 Electric CLCPA Recoveries, Table 7: 2022 Typical Monthly Electric Bills with CLCPA related costs disaggregated, and Table 8: Authorized Funding to Date.

Table 4: 2022 Electric CLCPA Recoveries summarizes costs recovered in 2022 by utilities for electric programs.  The costs recoveries include: CES (electric only), CEF (electric only), certain VDER (electric only), Electric Vehicle Make Ready Program (electric only), Clean Heat programs (electric only), Integrated Energy Data Resource (electric only), and Utility Energy Efficiency programs (electric and gas). The table states that $1,175,788,000 in Climate Act costs were recovered in 2022.  In the context of total ratepayer costs note that transmission upgrades are not included in the 2022 estimates and that there also are gas costs that are relatively small.

Table 7: 2022 Typical Monthly Electric Bills with CLCPA related costs disaggregated is the first admission by the Hochul Administration of potential costs of the Climate Act to ratepayers.  The basis for the typical electric delivery and supply bills for 2022 was provided for the following customer types:

A.           Residential customers (600 kWh per month),

B.           Non-residential customers (50 kW & 12,600 kWh per month),

C.           Non-residential customers (2,000 kW & 720,000 kWh per month), and

D.           Non-residential high load factor customers (2,000 kW & 1,296,000 kWh per month).

PSC Staff requested that utilities disaggregate the cost components reported in Table 2 (electric) to determine CLCPA related impacts on customers as shown in Table 7.  Climate Act costs added between 9.8% and 3.7% to residential monthly electric bills in 2022.

The Climate Act costs in 2022 are just the start of eventual costs to consumers.  Table 8: Authorized Funding to Date “gives a sense” of expenditures that will ultimately be recovered in rates. The Informational Report explains:

This annual report is a review of actual costs incurred by ratepayers to date in support of various programs and projects to implement the CLCPA and does not fully capture potential future expenditures, including estimated costs already authorized by the Commission but not yet recovered in rates. To complement this overview of cost recoveries incurred to date, we also present below a table of the various programs and the total amount of estimated costs associated with each authorized by the Commission to date. Table 8 gives a sense of expenditures that ratepayers could ultimately see recovered in rates. These values are conservative and reflect both past and prospective estimated costs.

It is important to note that the Commission authorized some of the estimated costs in Table 8 prior to CLCPA enactment and that the cost associated with these authorized programs will be recovered over several years to come, based on the implementation schedules for these projects or programs and will mitigate the cost impacts to ratepayers year over year. These estimated costs represent either total program budget, estimated total cost for the program over its duration, or costs incurred to date in support of the program. Additionally, these initiatives will result in a variety of other changes that will impact how much consumers pay for energy. A number of these would put downward pressure on costs, including benefits in the form of reduced energy usage and therefore reduced energy bills to consumers. The Department has also previously described market price effects that are a result of these investments. When load is reduced or more low-cost generation is added, it would be anticipated that energy prices would fall because the market would rely less on higher cost generators. In addition, investments in transmission infrastructure not only unbottle renewable energy but also yield production cost savings and reliability benefits.

In sum, the total estimated costs associated with these programs or projects should not be considered as entirely incremental costs to what ratepayers would otherwise pay. Subsequent annual reports may include additional information about costs recovered relative to the funding previously authorized by the Commission in these programs, including funds already expended in support of these programs.

The takeaway message from Table 8 is that the authorized funding to date of program costs that will eventually make their way to ratepayer bills totals $43.756 billion.  Note that the spreadsheet version of this table details the footnote costs.

Future Ratepayer Impacts

The ratio of the authorized Climate Act funding to date ($43.8 billion) to the Climate Act costs that have been authorized and were in the 2022 residential bills ($1.2 billion) is 37.2.  It is tempting to simply multiply the ratio by each of the monthly Climate Act disaggregated cost components reported by the utilities to determine CLCPA future related impacts on customers. However, this will not give an exact utility-specific estimate because the money authorizations per utility for 2022 and the future will not necessarily be the same.  For example, earlier this year I wrote about the PSC approving requests to develop 62 local transmission upgrades that would alleviate congestion on the transmission system to get power to NYC from wind and solar projects upstate.  The transmission upgrade projects will cost $4.4 billion to support 3.5 GW of renewable energy.  The estimated bill impacts were not the same for each utility because costs were a function of where the upgrades were located.  At this time no one knows how the costs will be allocated amongst the utilities. 

In addition, the costs will not be allocated all at once.  There is no documentation that explains the annual 2022 allocations relative to the total costs of each program.  In the worst case all the costs could be allocated in a single year.

In order to give a rough idea, I used a lower ratio.  The following table gives a conservative estimate of future costs by using a ratio of 30.  I multiplied the ratio of 30 by the 2022 utility-specific monthly Climate Act related costs to estimate the future Climate Act costs.  The future total monthly bill equals the 2022 bill minus the 2022 Climate Act related costs plus the future authorized funding Climate Act cost estimated as 30 times the 2022 costs.

Summary of Ratepayer Costs

The informational Report notes that. Climate Act costs that have been authorized and were in the 2022 residential bills total $1.2 billion.  The Report notes that in 2022 the costs already associated with the Climate Act increased the Upstate residential monthly electric bills 7.6% or $7.15 per month for NYSE&G customers; 7.7% or $7.54 for RG&E customers; and 9.8% or $9.38 for Niagara Mohawk customers.  

The report does not attempt to project future ratepayer costs of the authorized Climate Act funding to date that total another $43.8 billion.  Using the conservative ratio of 30 and assuming a similar distribution of costs per utility and that all costs will be in one year, I estimate that the monthly ratepayer costs associated with the Climate Act will total at least $214.50 for NYSE&G consumers, $226.50 for RG&E customers, and  $281.40 for NMPC customers.  The Climate Act related costs for every utility in the state will be greater than the total current monthly bill.

Discussion

In two recent articles I explained why the claims that the net-zero transition will result in cheaper electricity are rubbish.  The claim that wind and solar are cheaper is only possible if you ignore all the additional costs necessary to get the energy to consumers when and where needed.  In another post I explained arguments that solar and wind are only cheaper than fossil fuels in at most a small fraction of situations and for the overwhelming majority of the world’s energy needs, solar and wind are either completely unable to replace fossil fuels or far more expensive.  These ratepayer costs are for some of the many other services and support necessary to integrate wind and solar into a “zero-emissions” electric grid.  I suspect that future additional costs will be at least an order of magnitude higher.

Unfortunately, these are not the only costs for New Yorkers.  The Scoping Pan proposes to electrify everything possible.  These costs do not include what it will take to electrify home heating, cooking, clothes drying and hot water heating.  Nor does it include the costs for home electric vehicle chargers or the very likely need to upgrade the electric service to the residence when everything is electrified.  In addition to electrification of the home there will be the costs for an electric vehicle.

These estimated costs are high, but there is no escaping the fact that ratepayers are on the hook for an additional $43.8 billion in Climate Act costs.  I admit that the distribution of costs is unlikely to be as concentrated as I have assumed.  The absence of an estimate in the PSC report suggests that even if the eventual ratepayer impact is lower, it is still significant.

Conclusion

New York GHG emissions are less than one half of one percent of global emissions and global emissions have been increasing on average by more than one half of one percent per year since 1990.  These facts coupled with the extraordinary costs noted in the PSC Informational Report suggest that it is time to step back and wrest control of New York’s energy future from the innumerate ideologues who have foisted the Climate Act on New York.

These costs may not mean New York should not do something but it does mean that we have time to re-evaluate the Scoping Plan.  We need determine how much the transition will cost, whether we can maintain current levels of reliability with an electric grid that relies on wind and solar, and determine all the environmental impacts of wind and solar resources at the scale necessary for the net-zero transition before it is too late to prevent an affordability crisis, blackouts, and more damage to the environment from this supposed “cure” than any climate change impacts.

New Pragmatic Environmentalist Principle – Bryce Iron Law of Power Density

Note that an earlier post was just the copy that links to the page of principles. This post describes the other principles too.

When I started this blog, I included a page of principles that I think represent pragmatic environmentalism. My overarching belief is that it is necessary to balance environmental impacts and public policy.  However, I did list specific principles that characterize what is needed to reflect this balance and to highlight specific rules that characterize environmental and energy related issues.  This post describes Robert Bryce’s Iron Law of Power Density that I am going to include as another pragmatic environmental principle.

The opinions expressed  in this post do not reflect the position of any of my previous employers or any other company I have been associated with, these comments are mine alone.

Pragmatic Environmental Principles

The existing principles cover several of my concerns.  An over-riding problem for anyone skeptical of any public policy initiative is exemplified by Alberto Brandolini’s Baloney Asymmetry Principle: “The amount of energy necessary to refute BS is an order of magnitude bigger than to produce it.”   After hundreds of posts, I definitely agree with Brandolini

With respect to resolution of environmental issues I have included some observations that should be kept in mind. 

There are some underlying factors that should necessarily constrain discourse and resolution of environmental issues:

  • We can do almost anything we want, but we can’t do everything: Russel Schussler explains that environmental initiatives often are presented simply as things we should do but do not consider that in order to implement those initiatives tradeoffs are required simply because the resources available are finite.
  • Iron law of climate: Roger Pielke, Jr says the “iron law” simply states that while people are often willing to pay some price for achieving environmental objectives, that willingness has its limits. 
  • Golden Rule of Climate Extremes: Cliff Mass points out that the more extreme a climate or weather record is, the greater the contribution of natural variability.
  • Gresham’s Law of Green EnergyGresham’s Law of Green Energy is named after Sir Thomas Gresham, a 16th-century British financier who observed that “bad money drives out the good.”  Lesser shows that green energy subsidies transfers wealth and does not create wealth.  The subsidies or “bad” money take money out of the system that was “good” inasmuch as it was being used productively.
  • Ridley’s Paradox: Matt Ridley notes that economic damage from man-made ‘climate change’ is illusory whereas damage from man-made ‘policies’ to fight the said change is real.
  • Pollution Control Costs Increase Exponentially: As the pollution control efficiency increases, the control cost per ton reduced increases exponentially.
  •  Pareto Principle:  The Pareto principle  or 80-20 rule states that 20% of efforts or inputs can yield 80% of results or outputs.  For environmental issues, it’s important for environmental issues because it suggests that if we don’t aim to achieve 100% reduction we still will have accomplished most of the benefits and removed most of the risks.
  • Kicking a dead whale on the beach: Engineers will rarely tell you something is impossible, even when your proposal is a very bad idea. Computer scientists at Stanford and MIT in the 1970s came up with a wonderful expression for this, an assignment that was technically feasible, but highly undesirable. They called it “kicking a dead whale down a beach”.  Credit to Andrew Orlowski.

Iron Law of Power Density

Robert Bryce makes a persuasive argument that ultimate problem with wind and solar resources is simply a matter of  “basic math and simple physics.” 

Bryce explains that there are a couple of facets to the Iron Law of Power Density.  The first is the effect on resources needed and the second is the area needed to produce power.   He describes the effect on resource intensity:

The shape and size of our energy systems are not being determined by political beliefs about climate change. Instead, those systems are ruled by the Iron Law of Power Density which says: the lower the power density, the greater the resource intensity. This can easily be seen in the graphic below. It includes a screen grab from a 2021 International Energy Agency report on the mineral intensity of various methods of electricity generation. The mineral intensity of offshore wind, including huge amounts of copper and zinc, is shocking: roughly 15,400 kilograms per megawatt of generation capacity. That is roughly 13 times more than the amount needed for natural gas-fired generation (1,148 kg) and six times more than what’s needed for a coal plant (2,479 kg).

Bryce points out that this is part of the reason that there are cost issues associated with offshore wind development:

As Howard Rhodes of EnergyPortal.eu explained earlier this month, the offshore sector is facing “a financial crisis as costs continue to rise. Inflation in components and labor costs, along with rising interest rates, has led to a 57% increase in the costs associated with U.S. offshore wind projects since 2021.” Soaring commodity prices have also increased the cost of making onshore wind turbines. By one estimate, the cost of building a wind turbine has surged by 38% over the past two years.

Bryce explains why the area needed to produce power is an important component of the Iron Law of Power Density:

Power density is the measure of energy flow that can be harnessed from a given area, volume, or mass. Power density is a measure of how many watts we can get per square meter, liter, or kilogram from a given source. This article focuses on areal power density. Proving why low-power-density sources are the wrong choice for modern society takes only a modicum of effort.

Let’s start by looking at corn ethanol and other biofuels, which have a power density of about 0.1 watt per square meter. Counteracting that paltry power density requires lots of other resources, including fertilizer, diesel fuel, water, and staggering amounts of land. In 2021, Dave Merrill, a reporter and data analyst at Bloomberg, reported that “Two-thirds of America’s total energy footprint is devoted to transportation fuels produced from agricultural crops, primarily corn grown for ethanol. It requires more land than all other power sources combined.” Merrill determined that biofuels require the cultivation of about 80,000 square miles of cropland. That’s an area bigger than the state of Nebraska.

Bryce summarizes the land-use implications:

The only way to substantially increase the production of wind and solar energy is by seizing more and more land, (or ocean) so they can be covered with more and more steel, concrete, copper, and silicon. As I reported in these pages on August 4, in “Massive Riots, Renewable Resentments,” the backlash against the encroachment of large wind and solar projects is real, it’s global, and it’s growing. As can be seen in the Renewable Rejection Database, the total number of rejections and restrictions on wind and solar in the U.S. now totals 575.

Conclusion

This is an important addition to my list of pragmatic environmental principles.  Power density affects the resources needed to develop the resource.  Its importance is confirmed as the costs of wind developments have increases significantly recently.  In addition, power density means that much more land is needed to develop wind and solar resources. 

Pragmatic Principle 15: Iron Law of Power Density

Robert Bryce makes a persuasive argument that ultimate problem with wind and solar resources is simply a matter of  “basic math and simple physics” associated with the Iron Law of Power Density

Bryce explains that there are a couple of facets to the Iron Law of Power Density.  The first is the effect on resources needed and the second is the area needed to produce power.   He describes the effect on resource intensity:

The shape and size of our energy systems are not being determined by political beliefs about climate change. Instead, those systems are ruled by the Iron Law of Power Density which says: the lower the power density, the greater the resource intensity. This can easily be seen in the graphic below. It includes a screen grab from a 2021 International Energy Agency report on the mineral intensity of various methods of electricity generation. The mineral intensity of offshore wind, including huge amounts of copper and zinc, is shocking: roughly 15,400 kilograms per megawatt of generation capacity. That is roughly 13 times more than the amount needed for natural gas-fired generation (1,148 kg) and six times more than what’s needed for a coal plant (2,479 kg).

Bryce points out that this is part of the reason that there are cost issues associated with offshore wind development:

As Howard Rhodes of EnergyPortal.eu explained earlier this month, the offshore sector is facing “a financial crisis as costs continue to rise. Inflation in components and labor costs, along with rising interest rates, has led to a 57% increase in the costs associated with U.S. offshore wind projects since 2021.” Soaring commodity prices have also increased the cost of making onshore wind turbines. By one estimate, the cost of building a wind turbine has surged by 38% over the past two years.

Bryce explains why the area needed to produce power is an important component of the Iron Law of Power Density. 

Power density is the measure of energy flow that can be harnessed from a given area, volume, or mass. Power density is a measure of how many watts we can get per square meter, liter, or kilogram from a given source. This article focuses on areal power density. Proving why low-power-density sources are the wrong choice for modern society takes only a modicum of effort.

Let’s start by looking at corn ethanol and other biofuels, which have a power density of about 0.1 watt per square meter. Counteracting that paltry power density requires lots of other resources, including fertilizer, diesel fuel, water, and staggering amounts of land. In 2021, Dave Merrill, a reporter and data analyst at Bloomberg, reported that “Two-thirds of America’s total energy footprint is devoted to transportation fuels produced from agricultural crops, primarily corn grown for ethanol. It requires more land than all other power sources combined.” Merrill determined that biofuels require the cultivation of about 80,000 square miles of cropland. That’s an area bigger than the state of Nebraska.

Bryce summarizes the land-use implications:

The only way to substantially increase the production of wind and solar energy is by seizing more and more land, (or ocean) so they can be covered with more and more steel, concrete, copper, and silicon. As I reported in these pages on August 4, in “Massive Riots, Renewable Resentments,” the backlash against the encroachment of large wind and solar projects is real, it’s global, and it’s growing. As can be seen in the Renewable Rejection Database, the total number of rejections and restrictions on wind and solar in the U.S. now totals 575.

This is an important addition to my list of pragmatic environmental principles.  Power density affects the resources needed to develop the resource.  Its importance is confirmed as the costs of wind developments have increases significantly recently.  In addition, power density means that much more land is needed to develop wind and solar resources. 

July Climate Alarmism

It seems that every day we are faced with another claim that we are facing an existential threat from climate change and the proof is right in front of us.  So simple, so obvious and so wrong.  I do not have time to do my own analysis so I am going to use the work of others to rebut the fear mongering stories about these events tied to climate change in July.

July was the Hottest Month Ever

The story that July was the hottest month in 120,000 years is the best example of the media glomming on to a story that does not stand up to scrutiny.  A post at Watts Up With That explains:

From CLIMATE DEPOT

Via The Australian: Cliff Mass, professor of Atmospheric Sciences at University of Washington, said the public was being “misinformed on a massive scale”: “It‘s terrible. I think it’s a disaster. There’s a stunning amount of exaggeration and hype of extreme weather and heatwaves, and it’s very counter-productive,” he told The Australian in an interview. “I’m not a contrarian. I‘m pretty mainstream in a very large [academic] department, and I think most of these claims are unfounded and problematic”. …

Professor Mass said the climate was “radically warmer” around 1000 years ago during what’s known as the Medieval Warm Period, when agriculture thrived in parts of now ice-covered Greenland. “If you really go back far enough there were swamps near the North Pole, and the other thing to keep in mind is that we‘re coming out of a cold period, a Little Ice Age from roughly 1600 to 1850”.

#

John Christy, a professor of Atmospheric Sciences at the University of Alabama at Huntsville, said heatwaves in the first half of the 20th century were at least as intense as those of more recent decades based on consistent, long-term weather stations going back over a century. “I haven‘t seen anything yet this summer that’s an all-time record for these long-term stations, 1936 still holds by far the record for the most number of stations with the hottest-ever temperatures,” he told The Australian, referring to the year of a great heatwave in North America that killed thousands. 

Professor Christy said an explosion of the number of weather stations in the US and around the world had made historical comparisons difficult because some stations only went back a few years; meanwhile, creeping urbanization had subjected existing weather stations to additional heat. “In Houston, for example, in the centre it is now between 6 and 9 degrees Fahrenheit warmer than the surrounding countryside,” he explained in an interview with The Australian.

Professor Christy, conceding a slight warming trend over the last 45 years, said July could be the warmest month on record based on global temperatures measured by satellites – “just edging out 1998” – but such measures only went back to 1979.

Phoenix Heat Wave

Phoenix Arizona had a streak of 31 days when the high temperature was 110 degrees or higher.  The article, “Explaining The Heat Wave: Separating Weather From Climate Change,”  claims that recent warming trends in Phoenix, Arizona are due primarily to increasing atmospheric carbon dioxide levels in the atmosphere. However, this is false because data show that the high levels of warming, especially at night and as measured at an airport, are primarily due to urbanization over time, with the modest warming of the past hundred-plus years playing a very small part in comparison.  Another rebuttal notes:

Deadly Summer in the Southwest

Kip Hansen addresses the story:  “A Deadly Summer for Hikers in the Southwest” “At least seven heat-related deaths are suspected in state and national parks during a record-breaking heat wave.” 

He explains:

But, it must be climate change, look how hot it was!”  My dear readers, that’s why they named it Death Valley.    The Monthly Report from the U.S. National Weather Service for the Death Valley station shows that every day during July this year, the average daily temperature (Daily Maximum + Daily Minimum divided by 2) was in excess of 100 °F (37.7 °C).  That’s the average!    The daily highs were above 110 °F (43 °C) every single day, above 120 °F (49 °F) twenty of the days. 

Is this unusual?  Is this “extreme”? No, the U.S. National Park Service reports on the general the Weather in Death Valley “Death Valley is famous as the hottest place on earth and driest place in North America. The world record highest air temperature of 134°F (57°C) was recorded at Furnace Creek on July 10, 1913. [ emphasis mine – kh ] Summer temperatures often top 120°F (49°C) in the shade with overnight lows dipping into the 90s°F (mid-30s°C.) Average rainfall is less than 2 inches (5 cm), a fraction of what most deserts receive. Occasional thunderstorms, especially in late summer, can cause flash floods.”  All of those conditions, except the record high temperature of 1913, occurred this summer in Death Valley, just as the National Park Service advised visitors to expect.  There was not any extreme weather, it was usual weather for Death Valley.

Climate Fact Check

If you want short rebuttal summaries to these and other false climate change stories for July check out this fact check report.  It covers the following stories: monthly average temperature is the hottest, the UN proclamation that we are in an era of global boiling, the hottest day in 125,000 years, Atlantic current to collapse by 2025, record for hot days in Phoenix, hottest day in Death Valley, emissions causing hot oceans, hottest seawater ever, and more. 

Heat Health Impacts

The rationale for alarm for the excessive heat stories is the argument that heat results in more deaths than any other weather-related event.  Five years ago I explained why there are analyses that find “most of the temperature-related mortality burden was attributable to the contribution of cold”.  Studies that show that extreme heat results in more deaths than any other weather-related event use a data base that only includes direct deaths.  An epidemiological study that does include indirect deaths concludes most deaths are associated with moderate cold weather.  Roger Pielke Jr. reports how this information can be presented to support the alarmist version:

The Lancet was caught red-handed publishing a figure that, to be as fair as possible, lent itself to misinterpretation (it was first called to my attention by Bjorn Lomborg and is in a paper by Masselot et al. 2023).

Take a look and decide for yourself. Here is the original figure comparing mortality from cold (blue) and heat (orange) in Europe from 2000-2019.

And here is how it looks when the data is graphed using a consistent scale.

Another Examples of Propaganda

We have all seen the graphs that show inexorable global warming.  However this article describes how “alarmist scientists have scared the bejesus out of people by turning a very small temperature change into a monster.”   Jim Steele writes:

Dr. Lindzen graphed the average seasonal anomalies for each weather station in the BEST temperature data base from 1900 to the present. A station’s anomaly is defined as any deviation from its 30-year mean. The results are not very scary. On any given day about half the weather stations experience warm anomalies while half experience cooling anomalies.

Most anomalies cluster between ± 4°C (+/- 7.2°F) causing each data point to merge into the thick black band of the graph. Still, larger anomalies are not uncommon, so the y-axis of the above graph scales between ± 12°C (+/- 21.6°F). The yellow dots represent the average for those anomalies on any given day. We see a small trend that is relatively tiny compared to the variation in actual temperatures. Not very scary either.

So, the showtime graphs isolate the average anomalies from reality, as done in the bottom graph. Now the scale on the y-axis only spans from -0.8°C (-1.4°F) to 1.2°C (2.2°F), turning a small 1°C (1.8°F) rise over 120 years into the illusion of a monster increase. That allows click-bait media, alarmists scientists and politicians to claim that climate change could lead to mass extinctions.

Reporting Issues Influence Results

Roger Pielke Jr. is an expert on the topic of global disaster accounting.  He recently posted an article that makes two relevant points to this post:

Below is the updated time series of global hydrological, climatological and meteorological disasters in the EM-DAT database, along with the linear trend, over the period 2000 to 2022.

You can see that there is no upwards trend. This lack of trend has not been reported by anyone in the legacy media (and I would be happy to be corrected). However, the completely false notion that global weather and climate disasters have increased and will continue to increase is commonly reported in the legacy media, buoyed by the promotion of false information by organizations that include the United Nations. In 2020 the U.N. claimed falsely of a “staggering rise in climate-related disasters over the last twenty years.”

The second point he makes is careful examination of the disaster data clearly shows that “the increase in disasters in its database to 2000 is due to better reporting, and not changes in underlying counts of actual disasters.”  He concludes: “Regardless what happens with trends in disaster counts, it is absolutely essential to remember that if you are looking for a signal of changes in climate — always look directly at weather and climate data, not data on economic or human impacts.”

Conclusion

There is a constant barrage of doom and gloom articles connecting any extreme weather event or disaster to the existential threat of climate change.  In my opinion they all are more propaganda than unbiased reporting.  Every time I have checked a weather event attributed to climate change claim on my own, I have found that the issue is more complex and less threatening than portrayed.  Don’t get scared by these stories!

Guest Post: Washington State Cap and Invest Update

Last month I published several articles about the experiences of Washington State as they implement their cap-and-invest program because I think it is likely that New York’s experiences will be similar.  In one I elevated a comment from Washington resident Paul Fundingsland into a post.  He recently did “a bit of research with some comments, thoughts and a more or less rough idea of what seems to be going on in the Washington State cap-and-invest scheme” that I have converted into a guest post.

Paul describes himself as “An Obsessive Climate Change Generalist”.   Although he is a retired professor, he say he has no scientific or other degrees specific to these kinds of issues that can be cited as offering personal official expertise or credibility. What he does have is a two decades old avid, enthusiastic, obsession with all things Climate Change related. 

Last month I published Washington State Gasoline Prices Are a Precursor to New York’s Future, which was a variation of an article published at Watts Up With That – Do Washington State Residents Know Why Their Gasoline Prices Are So High Now?.  I also published Washington State Gasoline Prices and Public Perceptions that consolidated responses from Washington residents in the comments from the Watts Up With That article.  The last article, Feedback from Washington State on Gas Prices was from Paul Fundingsland.  All the articles addressed recent reports that gasoline prices in the State of Washington are now higher than California. 

In this post Fundingsland provides an update after doing a bit of research.  I provide his thoughts with my commentary below.

Initial Thoughts

The focus of my articles was the increase in gasoline prices.  Not surprisingly that has become a hot topic in Washington.  Paul explains:

Pushback on the rise in gas prices associated with the “Cap-and-Invest” scheme (hereafter referred to as “Tax-and-Reallocate” because that is essentially how it works) has caused our Governor to publicly blame the oil companies for price gouging apparently thinking they should absorb the loss of revenue and not pass their state mandated added costs for doing business on to their customers. Apparently he thought these companies should unrealistically absorb the loss of revenue and not pass their state mandated added costs for doing business on to their customers.

The idea that the costs of the program should not be passed on is also present in New York.  When the prices necessarily go up it is a shock to many.  Why I do not know.   It is obvious that the tax-and-reallocate scheme is dealing with a lot of money and not working as planned. 

One of our state legislators claims Washington State is now making more money from the sale of a gallon of gas or diesel than the oil companies.  Our Department of Ecology (which is running this scheme) scrubbed the website original language indicating this scheme would have a minimal effect on gas prices.  The Washington Policy Center claims the proposed climate funding budget is spending 56% of the initial $306 million on expanding government. No real surprise there.

I have concluded that the underlying motive of most of the proponents of these schemes is money.  Legislator Reuven Carlyle was a sponsor of the cap-and-reallocate law and provides an example.

Carlyle who chaired the Washington State Senate Environment, Energy & Technology Committee and was a member of the Ways and Means Committee, lead the charge in the Senate for passage of the Climate Commitment Act, Clean Energy Transformation Act, Clean Fuel Standard, hydrofluorocarbon standards, building standards and much more.  He left the legislature this year to cash in on his legislative work founding a startup called Earth Finance to “help businesses hit climate goals” based on his legislative accomplishments.

Program Evolution

Fundingsland’s experience with the researching the program is similar to mine:

A cursory review of how this “tax-and-reallocate” scheme is evolving in Washington and what kinds of claims and actual emissions reductions result going forward reveals a quagmire of incredibly convoluted intertwined moving parts. Trying to unravel the threads is proving to be very difficult and quite frustrating. 

He notes that descriptive information is not available.  That is a common trait in cap-and-invest programs in my experience:

For example under the Department of Ecology one can find a list of the companies who participated in the 2nd auction under “Washington Cap-and-Invest Program Auction #2 May 2023 Summary Report” but no data on how many allowances each company bought or what their total costs were. Interestingly, high profile Washington businesses missing from this list include Boeing, Microsoft, Amazon and Starbucks to name a few.

As to how the monies received from the program are going to be distributed, as of the moment one can find only broad generalized categories with aspirations as to how they will be applied subject to future legislative decision making.  For example: “these proceeds will be used to increase climate resiliency, fund alternative-transportation grant programs, and help Washington transition to a low-carbon economy” (my bold).

“Cap-and-Invest Auction Proceeds, consists of these generalized categories with percentages and sub accounts filled with somewhat more specific wish lists of where and how the monies are supposed to be spent. Under “Auction Public Proceeds Report” there is only broad information as to how much money was received.

Nowhere is there documentation of how much CO2 has been or is projected to be reduced by this plan in comparison with past years or how much less warming this plan has resulted in or is projected to result in.

Unfortunately, the problems he described are also present in New York’s implementation of the Climate Leadership & Community Protection Act (Climate Act).  The Public Service Commission just published a summary of the implementation status of the Climate Act and the lack of specificity noted here is present in that report.

Washington Emissions

Paul notes that he is “somewhat new at sorting through government bureaucratic documents”.  He caveats the following as what “might be better viewed as a rough approximation, subject to revision once more detailed and specific information is obtained.”  He does think the following is approximately correct.

According to the Washington State Department of Ecology, the 2019 breakdown of Washington State greenhouse gas emissions is: Residential, Commercial, Industrial heating 25%, Transportation 39%, Electricity 21%, Other 14%. 

Electrical power is 64.6% hydro supplied by eight hydro plants owned and operated by the Federal Government. Natural gas is currently at 14.4%, nuclear at 7.8%, wind 8.7%, coal at 2.9%, biomass at 1.3% and a small contribution of solar.

Washington’s natural gas utilities and electric utilities receive a determined (revisable) amount of their required emissions allowances for free. Washington’s only coal fired plant’s emissions are grandfathered in as it will be fully decommissioned in 2024. 

So, unlike the lower emissions resulting from a coal to natural gas switch as fortuitously happened during the initial years of the east coast RGGI scheme, there is not a lot of low hanging CO2 emissions fruit to begin with to harvest or claim as a success from the electricity sector in Washington. And with the free emissions allowances the emissions reduction pool from this sector is even further diluted. 

When I skimmed through the Washington regulations one of the things that jumped out to me was the following figure.  The 2030 limit is a 45% reduction below 1990 levels.  The chart indicates that 2020 emissions were equal to or slightly more than the 1990 emissions.  A 45% reduction in ten years seems ambitious.  Based on the information from Fundingsland, I cannot imagine this target will be achieved.

In addition, the “tax-and-reallocate scheme” contains all sorts of other emissions exemptions. One classification is termed “EITEs” consisting of over 40 facilities and businesses that qualify as Emissions-Intensive, Trade-Exposed industries even though they qualify for mandated participation in emission allowance auctions. 

There are also ”tax-and-reallocate-offsets” being run thru what is designated as an Offset Project Registry that looks to be a California based company called Climate Action Reserve

That leaves the bulk of the emissions reductions to be garnered from the other three sectors (transportation, residential-industrial-commercial heating, and “other”). At this time, it is difficult to determine how the actual 25% breakdown within the residential-industrial-commercial heating sector works. For instance, residential energy use has been reported as being 60% electric. 

I have long argued that a basic flaw in the New York net-zero transition plan is that there was no feasibility analysis.  Given this information about Washington I think New York is comparatively better off.  Both states need to document how they plan to get where they want to go but the reduction trajectory for New York is lower than Washington.

New York is starting to come to grips with similar sector target issues.  If the cap-and-reallocate scheme is supposed to provide significant funds for implementation but there are a limited number of affected sectors, then the price impacts on those sectors is going to be magnified.  That is exactly what happened in Washington.   It is not price gouging when that happens, it is simply supply and demand.

Assuming the industrial-commercial may be mostly gas, the amount of emissions by individual businesses will be affected by whether they are in the EITEs classification or not, whether they have “offsets” and how many tons of CO2 they emit (250,000 tons being the “trigger” amount for mandatory participation in the tax-and-reallocate emissions auctions). So the number of emissions reduction areas possible in this sector are rather “squishy” and difficult to determine. They most probably will land on the low side of 25%.

The political origins of these rules should not be overlooked.  The Progressive backers of both plans cater to the labor union constituencies so both New York and Washington carve out EITE exemptions.  Because the net-zero transition plans will necessarily increase the cost of energy I expect that the inevitable result is that the increase will make industries in both states uneconomic relative to other locations whatever the intent of these efforts.

The “other” classification of this sector consists of: agriculture (manure, fertilizer, livestock digestion), industrial processes (aluminum, cement), waste management (landfills, waste water treatment), and natural gas distribution. Of these, waste management and natural gas distribution are negligible. 

Agriculture represents a very difficult to find pathway toward lowering emissions without adversely affecting the food supply. That leaves cement and aluminum production which are essential to modern society, are both part of the EITEs exemption legislation and have, as of yet, no known practical, workable, scaleable emission free alternatives.

So the residential-industrial-commercial-heat and “other” sectors also look not to bear much in the way of emissions reductions for various mitigating reasons.

Again, the political calculus affects the treatment of these sectors.  I think the decisions are based more on what they think they can get away with than a pragmatic emission reduction plan.

 At 39%, transportation is the largest emissions sector. It has been reported that in the latest emissions allowances auction held last May, energy and utilities purchased the bulk of the allowances. With utilities (probably the gas plants) garnering a certain amount of unspecified free allowances from the State, that leaves the energy companies supporting transportation to shoulder the bulk of the latest allowance purchases. 

There are five refineries located in our state that serve Washington, Oregon and to a small degree California. Their products include on-road gasoline and diesel,  marine fuel, jet fuel and aviation gasoline, railroad fuel, and natural gas used in transportation. However, there are some big allowance exemptions that cover fuels involving watercraft (shipping, cruise ships, navy etc.), agricultural, aviation and exported fuels.

Personal car and truck fuels in Washington have no exemptions and make up over half of the total fossil fuel emissions in this category. With the energy companies probably buying the bulk of emission auction allowances, and with all the exemptions in the other fuel use areas, it’s not a stretch to see why the costs of the allowances were passed along to the personal car and truck consumers causing the rather massive jump in gas prices at the pump.

Overall, a good guess is the Legislature will be more than satisfied for some time with the amount of monies coming in that can be used to fund the expansion of the State bureaucracy and all their manufactured future wondrous climate mitigating projects to help save the world from future computer modeled bad weather. So they will feel they are basically doing their job. It’s doubtful they will want to cause gas prices to accelerate much more in the near future for fear of garnering the wrath of the electorate.

Often the simplest answer is correct. Fundingsland makes a good argument that this is just the start of the cost impacts to transportation in Washington.  The mix of sector reductions in New York is different but not enough that fuel prices won’t spike when the New York auctions begin.  I agree that the revenue target is entirely a political decision.

If and when a transparent “project report” comes out, it will no doubt tout all the money received (the easy headline grabbing part), be filled with all the virtuous climate change related project accomplishments the monies were or are going to be used for (the hyped glossy political part), with the actual emissions reduction data either completely missing, obscured, massaged, tortured, or glossed over and probably relegated to some vague or indeterminant area of the document with accompanying convoluted language (the important forgotten and reason for the scheme in the first place part).

Based on current Ecology Department documents available and reports from various sources, this already seems to be the case.

New York’s participation in the Regional Greenhouse Gas Initiative (RGGI) portends what will happen in Washington and his description is apt.  I have been evaluating the RGGI reports for years and can confirm that the wording and information provided is designed to claim unqualified success.  Digging into the numbers shows a much different story.

Questions

Fundingsland lists the following bottom-line questions.

*How much did each “qualified” company pay for the allowances? 

*What were the financial consequences to the constituents of these added costs to the companies? 

*Which areas and projects did the monies actually go to and how much did each receive? 

*What was the overall cost per ton of CO2 reductions (total allowance participant proceeds versus total reduction in CO2 tons). 

And the four most important questions: 

*How much reduction in emissions compared to recent years has resulted from this scheme? 

*How much less global warming has been projected to occur by these emission reduction results? 

*How much is this scheme going to cost the residents to completion or are the costs never ending? 

*What metric has been identified that will be used to indicate this program is no longer needed because it has done it’s job?

I agree with his take on responses to the questions:

It will be surprising if any of these kinds of questions are going to be addressed. It is looking more and more like just another never ending, forever growing government bureaucratic convoluted way to extract more funds from their constituents for some worthwhile, some okay, and some questionable projects that may or may not have a quantifiable bearing on reducing CO2 emissions.

Summation

Fundingsland summarizes the likely results of the program:

It’s going to be extremely difficult and may not even be possible for Washington State to be able to claim any meaningful or significant emission reductions based on this tax-and-reallocate scheme given the state’s overall energy use configuration combined with all the various emission allowance exemptions. 

In fact, there is a very high probability there will be next to zero emission reductions and perhaps even an increase.

The easiest and most efficient way for the 54 companies/businesses listed under the auction #2 May 2023 summery report that have been forced to participate (“qualify” in bureaucratic terminology) in the allowance auctions or face a $10,000 per day fine, is for them to just purchase the allowances, add it to their cost of doing business and pass the increase along to their customers. So in effect they won’t be reducing their emissions at all. And all will be adding their additional State forced costs for doing business on to their customers.

This the ultimate flaw in the cap-and-reallocate plan.  The costs to implement emission reductions are greater than the costs of allowances.  Moreover, emission reductions may only be possible by displacing fuels.  The transportation fuel providers have limited means to reduce their emissions so the sector reductions will come primarily from the introduction of electric vehicles.  In the meantime, the fuel providers will simply pass the costs along and if the allowance cap limits the availability of allowances too much then they will stop selling fuel or pass the $10,000 per day fine along to their customers.  

Fundingsland concludes:

At the end of the day, the goal of any meaningful, measurable reduction of CO2 emissions or theoretical effective pathway to stop “climate change” looks to become a glazed over afterthought in this quagmire of a Washington State bureaucratic money-making machine. 

With this scheme, Washington State Government now joins the lucrative profit side of the climate industrial complex at the expense of its constituents while giving a completely different connotation to the term “Net Zero”.

Conclusion

I think New York’s plan for an economy-wide cap-and-invest program will be a similar disaster.  Earlier this year I described the book Making Climate Policy Work.  I focused on their discussion about RGGI and the implications for New York’s cap-and-invest program.  I noted that I agreed with the authors that these programs generate revenues.  However, we also agree that the amount of money needed for decarbonization is likely more than any such market can bear.   I highly recommend this book to anyone interested in potential issues with these programs.

Fundingsland picked up on the affordability issues but did not address the compliance implications.  Advocates for cap-and-invest tout the claim that as the allowance cap declines, compliance with the program targets is assured.  Proponents have not acknowledged or figured out that the emission reduction ambition of the reduction targets is inconsistent with technology reality.  Because GHG emissions are equivalent to energy use, limiting GHG emissions before there are technological solutions that provide zero-emissions energy means that compliance will only be possible by restricting energy use.  I don’t think that New York can meet its emission reduction targets but compared to Washington’s emission inventory and targets New York has a much better chance.  Washington plans to rely primarily on the transportation and building sectors for its reductions and needs to make sharper cuts.  I see no scenario where that will end well.

In conclusion, I believe Fundingsland did a good job describing the issues associated with cap-and-invest in Washington.  New York’s program will have the same issues.  It will be interesting to see how these state programs work out and which one will be the bigger flop.

New York Zero-Emissions Resource Proceeding

The New York State Public Service Commission (PSC) recently initiated an “Order initiating a process regarding the zero-emissions target” that will “identify innovative technologies to ensure reliability of a zero-emissions electric grid”.  Implementation of the Climate Leadership & Community Protection Act (Climate Act) started soon after the law was passed at the end of 2019.  It was recognized early that “as renewable resources and storage facilities are added to the State’s energy supply, additional clean-energy resources capable of responding to fluctuating conditions might be needed to maintain the reliability of the electric grid” but here we are three and half years later finally getting around to address this critical requirement.  This post summarizes the proceeding, gives an overview of the questions raised by the PSC, and describes the comments I submitted.

I have been following the Climate Act since it was first proposed. I submitted comments on the Climate Act implementation plan and have written over 300 articles about New York’s net-zero transition.  I have extensive experience with meteorological aspects of electric generation because I have worked in the sector as a meteorologist for over four decades.  I have devoted a lot of time to the Climate Act and the issues raised in this proceeding because I believe the ambitions for a zero-emissions economy embodied in the Climate Act outstrip available renewable technology such that the net-zero transition will do more harm than good.  I represent the Environmental Energy Alliance of New York on the New York State Reliability Council Extreme Weather Working Group.  The opinions expressed in this article do not reflect the position of the Alliance, the Reliability Council, the Extreme Weather Working Group, any of my previous employers or any other company I have been associated with, these comments are mine alone.

Climate Act Background

The Climate Act established a New York “Net Zero” target (85% reduction and 15% offset of emissions) by 2050 and an interim 2030 target of a 40% reduction by 2030. The Climate Action Council is responsible for preparing the Scoping Plan that outlines how to “achieve the State’s bold clean energy and climate agenda.”  In brief, that plan is to electrify everything possible and power the electric grid with zero-emissions generating resources by 2040.  The Integration Analysis prepared by the New York State Energy Research and Development Authority (NYSERDA) and its consultants quantifies the impact of the electrification strategies.  That material was used to write a Draft Scoping Plan.  After a year-long review the Scoping Plan recommendations were finalized at the end of 2022.  In 2023 the Scoping Plan recommendations are supposed to be implemented through regulation and legislation.  The zero emissions analysis is part of that effort.

Overview of Process

The press release describes the process to “identify innovative technologies to ensure reliability of a zero-emissions electric grid”:

The New York State Public Service Commission (Commission) has initiated a process to examine the need for resources to ensure the reliability of the 2040 zero-emissions electric grid mandated by the Climate Leadership and Community Protection Act, or Climate Act.

“The Commission’s action reaffirms efforts to ensure New York has the needed clean-energy resources to replace existing fossil fuel-fired power plants,” said Commission Chair Rory M. Christian. “I am proud that New York continues to lead by advancing important clean energy initiatives, such as the one commenced today.”

The Climate Act, passed by the State Legislature in 2019, directs the Commission to establish, among other things, a program to ensure that by 2030, at least 70 percent of electric load is served by renewable energy, and that by 2040, there are zero emissions associated with electrical demand in the State. The initiative will help deliver on the Climate Act zero-emissions electric grid mandate and will enable the necessary types of clean energy to reach all New Yorkers. The Commission’s decision follows a substantial climate package announced by Governor Kathy Hochul in the FY24 enacted State Budget that will advance sustainable buildings, clean energy, and an affordable Cap-and-Invest program.

Today’s action recognizes that as renewable resources and storage facilities are added to the State’s energy supply, additional clean-energy resources capable of responding to fluctuating conditions might be needed to maintain the reliability of the electric grid. The Commission’s work to meet the Climate Act targets must include exploration of technologies that can support reliability once fossil generation has been removed from the system. The order initiates a process to identify technologies that can close the anticipated gap between the capabilities of existing renewable energy technologies and future system reliability needs. Within the order, the Commission asks stakeholders a series of important questions, including how to define ‘zero-emissions’ for purposes of the zero emissions by 2040 target, and whether that definition should include cutting edge technologies such as advanced nuclear, long duration energy storage, green hydrogen, and demand response. The order further elicits feedback from stakeholders on how to best design a zero-emissions by 2040 program, consistent with the Climate Act’s requirement of delivering substantial benefits to disadvantaged communities and New York State’s electric grid reliability rules, while also leveraging other state and federal efforts to research, develop, and deploy zero-emission resources.

After a 60-day public comment period, Commission staff will convene at least one technical conference to examine a series of issues and questions raised in this important proceeding. The Commission may take additional actions on zero-emission resources based on the information obtained through those processes.

Questions Asked

I have included the questions asked with some brief commentary.  I chose to only address one question related to my expertise and one short-coming in the Proceeding.  The Commission wants answers to “assist the Commission in determining what, if any, subsequent actions should be taken, which may include refinements to existing policies or establishing new policies.”

Question 1: How should the term “zero emissions,” as used under PSL §66-p(2)(b), be defined?

It has taken three and a half years to define what qualifies as “zero emissions” and address the problems associated with this resource.  Given its importance this should have been an immediate and high priority for the Climate Action Council.  The Order notes:

Following enactment of the CLCPA, the Commission issued the Order Adopting Modifications to the Clean Energy Standard, which aligns the existing Clean Energy Standard (CES) with the CLCPA renewable energy targets.

The pathway established by the CES Modification Order focuses on options for procuring sufficient renewable energy resources to meet CLCPA requirements. However, several studies indicate that renewable energy resources may not be capable of meeting the full range of electric system reliability needs that will arise as fossil generation is replaced. These studies suggest that there is a gap between the capabilities of existing renewable energy technology and expected future system reliability requirements. The Independent Power Producers of New York, Inc., New York State Building and Construction Trades Council, and New York State AFL-CIO (Petitioners) also raised this issue in a petition filed in this proceeding on August 18, 2021 (Zero Emissions Petition or Petition).

I did not provide any comments on this question.

Question 2: Should the term “zero emissions” be construed to include some or all of the following types of resources, such as advanced nuclear (Gen III+ or Gen IV), long-duration storage, green hydrogen, renewable natural gas, carbon capture and sequestration, virtual power plants, distributed energy resources, or demand response resources? What other resource types should be included?

If I were to respond to this question, I would simply say the only one of these resources that has a realistic chance of providing the services necessary is advanced nuclear.  That answer is obvious to anyone who has looked at the other options pragmatically.  I do not believe that a state that shut down 2,000 MW of operating nuclear will ever pivot to nuclear so I am not going to dilute my comments by stating the obvious.

Question 3: How should a program to achieve the Zero-Emission by 2040 Target address existing and newly constructed nuclear energy resources. Should the program be limited to specific types of nuclear energy technologies and exclude others?

It is obvious that keeping existing nuclear in operation as long as it is safe should be a priority but this is New York.  Responding to the specific types of nuclear question is beyond my existing knowledge and I do not have time to research a response.

Question 4: Should new measures adopted to pursue compliance with the Zero-Emission by 2040 Target focus exclusively on generation and resource adequacy, or should they also encompass a broader set of technologies that could be integrated into the transmission or distribution system segments, or installed and operated behind-the- meter?

Responding to this is beyond my existing knowledge and I do not have time to research a response.  My impression is that the broader technologies being considered are all magical solutions that are only being included to appease the green energy advocates.  They may play a role but it will be inconsequential.

Question 5: Should any program to achieve the Zero-Emission by 2040 Target specify subcategories of energy resources based on particular characteristics, such as ramp rates, the duration of their operational availability, or their emissions profile with respect to local pollutants?

I am sure that New York’s reliability experts will address the technical aspects of the energy resources needed.  I am not qualified to do so.  My comments do address the duration of the operational availability of this resource.

Question 6: What role does technology innovation need to play to meet the CLCPA’s Zero-Emission by 2040 Target?

Given that the Commission by way of this proceeding, the New York Independent System Operator (NYISO), and the New York State Reliability Council (NYSRC) all agree that there is no commercially available resource available that meets the need identified for dispatchable emissions free generation, I would say that technology innovation is an obvious prerequisite to the 2040 target.  My comments address the reliability and affordability implications of the technological innovations needed.

Question 7: Should life cycle emissions impacts be considered when characterizing energy resources? If so, how?

It would be inappropriate for me to respond to this question because my comments would be unprofessional.  I doubt that something along the lines of the following would be considered: “Why would the State want to start becoming unbiased in its consideration of energy resources now?  All of the possible life cycle impacts of fossil sources are included and none of the life cycle impacts of wind and solar are considered.  When there was no obvious characterization methodology for fossil fuel impacts available, they just made something up – so do the same.”

Question 8: Given that the feedstocks and other resources required to produce renewable natural gas are limited and will be in demand in other sectors of New York’s economy, how should this fuel be considered in the context of this proceeding?

This question answers itself.  There will never be enough renewable natural gas available to provide a meaningful contribution.  On the other hand, there are instances where emission reductions will be required and the capture and use of renewable natural gas makes sense.

Question 9: In what ways might a program to meet the Zero-Emission by 2040 Target require reexamination and possibly revision of different tiers of the Clean Energy Standard? Should one or more of the policy approaches that have been used to implement the CES be considered to meet the Zero-Emission by 2040 Target?

Responding to this is beyond my existing knowledge and I do not have time to research a response. 

Question 10: What is necessary to align a program to meet the Zero- Emission by 2040 Target with the priority of just transition embedded within the CLCPA?

The Just Transition rubric is a political construct.  I pride myself on pragmatic comments that balance impacts, costs, and benefits.  Those are not considerations that will be included in the just transition priorities so I did not submit a response to this question.

Question 11: How might the benefits of a program to meet the Zero- Emission by 2040 Target be measured for the purpose of ensuring that, consistent with PSL §66-p(7), it delivers “substantial benefits” to Disadvantaged Communities?

The substantial benefits to Disadvantaged Community rubric is another political construct.  It is disappointing that the State has so far ignored the benefits of a reliable and affordable electric grid relative to the alleged benefits and significant affordability and reliability risks to Disadvantaged Communities.

Question 12: NYISO has adopted an effective load carrying capacity (ELCC) rubric and treatment of Zones J and K as load pockets with special resource adequacy requirements. How should these constructs and other NYISO market rules inform design of a program meant to support the development and deployment of resources capable of achieving a zero emissions grid?

Responding to this is beyond my existing knowledge and I do not have time to research a response. 

Question 13: What additional studies, if any, should the Commission undertake with respect to the development and deployment of resources capable of achieving a zero emissions grid?

In the following section I describe my response to this comment.

Question 14: Given that New York is not the only jurisdiction investigating options and opportunities for the research, development, and deployment of new technologies capable of achieving a zero emissions grid, how should the State seek to coordinate with and otherwise draw upon efforts that are underway elsewhere?

This is another question that answers itself.  Given the challenges we need all the help we can get.  How to do that is beyond my pay grade.

My Comments

My comments addressed two concerns: duration of the operational availability of the zero-emissions resources and the need to address the feasibility and affordability conditions in  New York Public Service Law  § 66-p (4). “Establishment of a renewable energy program”.

In order to determine whether any of the innovative technologies to “ensure reliability of a zero-emissions electric grid” are adequate it is necessary to determine how much energy they can provide relative to the amount needed in the worst case.  I have been whining about the ultimate problem in the Integration Analysis for nearly three years.  On September 16, 2020 In their presentation to the Power Generation Advisory Panel E3 included a slide titled Electricity Supply – Firm Capacity.  Their presentation states: “As the share of intermittent resources like wind and solar grows substantially, some studies suggest that complementing with firm, zero emission resources, such as bioenergy, synthesized fuels such as hydrogen, hydropower, carbon capture and sequestration, and nuclear generation could provide a number of benefits.”  Those are the zero-emissions resources addressed by the Proceeding.  Of particular interest is the graph of electric load and renewable generation because it shows that this problem may extend over multiple days.

My comments explained that in New York the winter solar resource is poor because the days are short, the irradiance is low because the sun is low in the sky, and clouds and snow-covered panels contribute to low solar resource availability.  If there is a period of low winds, then the zero-emissions resource is needed to provide an economically viable resource solution.  Note that the magnitude of the zero emissions resource needed to address this issue will be a  significant percentage of system peak load and that the technology (green hydrogen, long-term battery, etc.) does not presently exist for utility scale application.

I also pointed out that the reliability concern is exacerbated for several reasons.  The future peak load will be in winter because the primary decarbonization strategy is electrification.   During extreme cold weather periods, natural gas used at power plants is diverted to other users and power plants must switch to oil.  There are fewer plants that have dual-fuel capability and over an extended event or a series of events the oil in storage could be depleted.  Finally, the coldest periods are also associated with wind lull periods because extreme cold is associated with large high-pressure systems that suppress wind resources.

If there are insufficient generating resources available to serve peak loads, then a disastrous blackout will result.  In February 2021, the Texas grid was unable to provide support load and resulted in as many as seven hundred deaths and billions in damages.  I stated that this proceeding must ensure that this situation does not happen in New York.

I described the NYISO resource adequacy planning process in my comments.  It has developed over many years and provides reliability planning projections based on the current mix of electric generating resources.  One of the important characteristics of the current system is that there is insignificant correlation between the unavailability of generating resources.  I believe that one of the significant findings of the New York State Reliability Council (NYSRC) Extreme Weather Working Group (EWWG) will be the observed correlation of the frequency and duration of low-wind episodes across the entire state, including the offshore wind development areas.  I emphasized that this finding must be considered in future planning. 

I have no doubt that these issues will eventually be addressed in the resource adequacy planning process and the reliability standards for the electric system.  However, in order to determine how to do this it is necessary to understand the worst case. In order to determine how large the DEFR capacity needs to be, the State must know how much energy was available for low renewable resource episodes of different lengths.  The EWWG is addressing this issue.  However, because of its importance I believe a more extensive analysis and possibly independent analysis by different organizations would be appropriate.  It is too important to rely on a single analysis of the expected worst-case availability.  Therefore, I recommend this study be addressed as part of this Proceeding.

My comments on this topic recommended what should be included in a worst-case analysis.  The most important aspect of any such analysis is to use as long an analysis period as possible.  Fortunately, meteorological reanalysis data generated by modern weather forecast models but using original observations since 1950 are available for this application.  The analysis should identify potential periods of low wind and solar availability and their frequency and duration.  Once worst case periods are identified, modeling that projects the specific resource availability during the worst periods should be performed.  That information can be used for future resource planning.

My second comment addresses the feasibility and affordability conditions in  New York Public Service Law  § 66 “Establishment of a renewable energy program”.  The Hochul Administration has not acknowledged that there is a “safety valve” if the implementation does not work out as imagined in the Scoping Plan.

Specifically, New York Public Service Law  § 66-p (4) states: “The commission may temporarily suspend or modify the obligations under such program provided that the commission, after conducting a hearing as provided in section twenty of this chapter, makes a finding that the program impedes the provision of safe and adequate electric service; the program is likely to impair existing obligations and agreements; and/or that there is a significant increase in arrears or service disconnections that the commission determines is related to the program”.  The plain reading of that is that if implementation cannot feasibly maintain reliability standards or adversely affects affordability can “temporarily suspend or modify the obligations” of the Climate Act.

In my opinion, if the Climate Action Council had spent time looking at overarching issues rather than getting bogged down in arguments about wording and the pet concerns of its members then this would have been addressed.  In this instance, they should have defined the reliability obligations, and affordability conditions for the commission.  They could have specified the metrics to be used and the limits at which it would be appropriate to pause implementation.  Because the Climate Action Council failed to provide recommendations, I commented that the Commission must establish those criteria.

Once the criteria are established then they can be used as a test for the acceptability of the proposed zero emissions resources.  As part of the process a feasibility analysis for each resource to determine the technological risks for the resource and potential costs must be prepared.  If the analysis projects that the § 66-p (4) criteria will be exceeded then the resource should not be considered.

Finally, I noted that my primary problem with the Climate Act is the mandate to go to zero without consideration of tradeoffs.  In this instance that mandate precludes an obvious solution.  New York’s oil-fired steam-electric generating stations could be used to provide the dispatchable generation needed for the worst-case extremes.  The facilities have on-site storage, significant capacity availability, and experience operating units that run rarely.  The units could be kept on-line, used for testing, training, and to be available for use in these extreme events.  The extreme events are easily forecasted days in advance so the units can be brought on-line to be available as needed.  I suspect that the cost to maintain those facilities will be far less than the cost of any zero-emission resource.  Overall, the emissions and air quality impacts will be far less of an issue than the ramifications of a blackout.  I recommended that this option be considered as part of this Proceeding.

Conclusion

This proceeding puts to rest the myth that the technology necessary for the electric system transition is available today.  In order to meet the 2040 “zero emissions” electric generating resource requirement, this zero emissions resource is needed. 

My comments were confined to two overarching issues that must be resolved in order to evaluate New York’s “zero-emissions” resources.  The energy that the resource needs to provide to replace wind and solar resources during low availability periods must be known in order to determine how much will be needed.  I recommended that an analysis that uses as long a period as possible be included as part of the Proceeding.  My other concern is that the acceptability of zero-emissions resources should be based on well-defined standards of reliability feasibility and affordability.  I recommended that the Proceeding define these criteria.

This is a necessary component of the net-zero transition.  Unfortunately the need for this Proceeding has been known since the implementation began and it should have been part of the discussions of the Climate Action Council in 2020. 

New York State Advanced Clean Cars

I believe that the majority of New Yorkers are unaware of the ramifications of regulations implementing control programs for the Climate Leadership & Community Protection Act (Climate Act) emission reduction mandates.  This post describes one regulation that will affect most New Yorkers but has not received as much attention as I would have thought.  The New York State Department of Environmental Conservation (DEC) recently adopted amendments to 6 NYCRR Section 200.9 and 6 NYCRR Part 218 will incorporate California’s Advanced Clean Cars II (ACC II) regulation that require increasing annual zero emission vehicle (ZEV) sales requirements starting at 35% in model year 2026 and increasing to 100% by model year 2035.

I have been following the Climate Act since it was first proposed, submitted comments on the Climate Act implementation plan, and have written over 300 articles about New York’s net-zero transition.  I have devoted a lot of time to the Climate Act because I believe the ambitions for a zero-emissions economy embodied in the Climate Act outstrip available renewable technology such that the net-zero transition will do more harm than good.  The opinions expressed in this post do not reflect the position of any of my previous employers or any other company I have been associated with, these comments are mine alone.

Climate Act Background

The Climate Act established a New York “Net Zero” target (85% reduction and 15% offset of emissions) by 2050 and an interim 2030 reduction target of a 40% reduction by 2030. The Climate Action Council is responsible for preparing the Scoping Plan that outlines how to “achieve the State’s bold clean energy and climate agenda.”  In brief, that plan is to electrify everything possible and power the electric grid with zero-emissions generating resources.  The Integration Analysis prepared by the New York State Energy Research and Development Authority (NYSERDA) and its consultants quantifies the impact of the electrification strategies.  That material was used to write a Draft Scoping Plan.  After a year-long review the Scoping Plan recommendations were finalized at the end of 2022.  In 2023 the Scoping Plan recommendations are supposed to be implemented through regulation and legislation.  This regulation is an example: “The amendments are also consistent with the requirements of the Climate Leadership and Community Protection Act, Chapter 106 of the Laws of 2019, as well as legislative requirement for all new, light-duty vehicle sales to 100% ZEV by 2035, Chapter 423 of the Laws of 2021, to further reduce greenhouse emissions in New York State.”

Advanced Clean Cars Regulation

One problem for the public as regulations and legislation are proposed and enacted is that the regulatory action language is dense and unclear.  The  DEC description of this rulemaking is a good example:

Part 218 Advanced Clean Cars II (ACC II) (PDF) – Effective July 6, 2023

This notice is continuation of the Proposed/Emergency Rulemaking of the same title that was adopted and effective on December 13, 2022 and published in the State Register on December 28, 2022. Emergency Rulemaking – Parts 200, General Provisions, and 218, Emissions Standards for Motor Vehicles and Motor Vehicle Engines. The emergency rulemaking will incorporate the State of California’s Advanced Clean Cars II (ACC II) regulation. The proposed amendments establish new zero emission vehicle (ZEV) and low emission vehicle (LEV IV) standards intended to reduce GHG (greenhouse gas) and NMOG + NOx (non-methane organic gas + oxides of nitrogen) emissions from light- and medium-duty on-road vehicles.

The ZEV amendments include an annual ZEV sales requirement for original equipment manufacturers (OEMs), minimum technical requirements, ZEV assurance measures, regulatory flexibilities, and simplified credit accounting. The proposed ZEV amendments will apply to 2026 and subsequent model year light-duty passenger cars (PC), light-duty trucks (LDT), and medium-duty passenger vehicles (MDPV). Starting with model year 2026, OEMs, will be required to deliver an increasing annual percentage of their sales that are ZEVs or PHEVs. This percentage requirement will start at 35% in model year 2026 and increase to 100% of sales for 2035 and subsequent model years. The proposed LEV IV amendments will apply to 2026 and subsequent model year PC, LDT, and medium-duty vehicles (MDV).

The Notice of Emergency Rulemaking is effective as of July 6, 2023, and will be available in the July 26, 2023 issues of the State Register and the Environmental Notice Bulletin.

Advanced Clean Cars for the Public

I think that the biggest unappreciated impact to the public will be the sales percentage mandates for zero-emission vehicles (ZEV) and plug-in hybrid vehicles (PHEV).  Buried in the regulatory documents there is a pretty straigh-forward explanation. On page 4 of the July 26, 2023 State Register (page 14 of the pdf file) the sales mandates are described:

Starting with model year 2026, OEMs, will be required to deliver an increasing annual percentage of their sales that are ZEVs or PHEVs. This percentage requirement will start at 35% in model year 2026 and increase to 100% of sales for 2035 and subsequent model years.

PHEVs may be used to meet up to 20% of the annual ZEV requirement and they must meet minimum technical requirements. The use of PHEVs to meet part of the annual ZEV requirement will sunset following the 2035 model year.

ZEVs and PHEVs will be required to meet minimum technical requirements to earn ZEV values under ACC II. ZEVs must have a minimum all electric range (AER) of at least 150 miles and PHEVs must have a minimum AER of 50 miles and be capable of doing at least 40 miles on an aggressive drive cycle. ZEVs and PHEVs must also meet the ZEV assurance measures to be eligible to earn ZEV values. PHEVs must also be certified to super ultra-low emission vehicle (SULEV) standards and be covered by a 15 year or 150,000 mile warranty

The proposed ACC II ZEV amendments include ZEV assurance measures consisting of durability, warranty, service information/ standardized data parameters, and battery label requirements. The ZEV assurance measures will ensure that ZEVs retain functionality and reliability as internal combustion engine vehicles (ICEVs) are transitioned out of the on-road fleet.

Reactions to Advanced Clean Cars

The Big Green NGOs support this program to mitigate climate change.  The NRDC claims “Transitioning to a zero-emission transportation system, therefore, is one of the most effective ways to mitigate climate change, improve air quality and health almost everywhere, and make the total cost of car ownership lower and more predictable.”  The Sierra Club says “One policy that has pushed EVs to become more affordable and easier to purchase is the Advanced Clean Cars II (ACC2) Rule, also known as the Zero Emission Vehicle (ZEV) Standard.” 

While I am sure that there are people who agree with these organizations, I believe that the majority do not.  According to the NYSERDA Electric Vehicle Registration Map there were 155,988 electric vehicles on the road in New York as of July 2, 2023.  There are on the order of 11.5 million vehicles registered in New York so electric vehicles account for about 1.5% of the vehicles in the state.  The following table lists the number of new EV registrations per year.  EV proponents point to the increasing sales but, given the tremendous marketing effort for EVs I do not these numbers represent an endorsement for electric vehicles where it counts.

The reality is that there are issues with EVs.  I have set up a background page that provides links to articles describing some of those issues.  I am going to describe a couple of recent articles here that list some of my concerns.

Both articles address the obvious issue.  What if people like me don’t want to buy a battery electric vehicle because of range limitations, home infrastructure concerns, and worries about the morality of the supply chain of rare earth metals.  The first article notes that Unsold Electric Cars May Be Signaling A Death Spiral For The Auto Industry.  Ronald Stein lists reasons why people are not purchasing EVs and points out that EV inventories are rising.  He also points out that the used car market is important but that the EV used car market is non-existent.  Anecdotally, a friend of mine in the car business says that used Evs are not selling because of lemon laws and worries about battery replacement.

The other article by Terry Etam, The Potential Looming Auto Industry Fiasco, takes a big picture look at what lies ahead for the auto industry.  He notes that:

In the second quarter of 2023, Ford lost $72,000 on every EV sold. While the latter is ‘sort of’ normal for new car platforms – and Evs are nothing if not new platforms – what isn’t normal is for highly-touted/media-frenzy revolutionary new autos like the Ford Mustang Mach E EV to be selling under 3,000 units per month in the US as it is in 2023, two years after introduction (US sales peaked over 5,000 units per month shortly after introduction). In the second quarter of 2023, Ford sold 14,843 Evs (out of 513,662 vehicles sold by the company overall), a fairly meagre total considering the capital invested and the marketing campaigns. In the minds of most consumers, it seems an EV means a Tesla, and there is scant interest in anything else no matter the marketing hyperbole.

Etam brings up another point that is a concern of mine.  Evs are so expensive that the low- and middle- income residents of disadvantaged communities will have a tough time buying one.  He explains:

In case anyone cares, and it doesn’t seem that they do when energy transitions are discussed, this will all work out the absolute worst for lower income people. Ordinarily, the auto market provides options for lower economic classes with vehicles that are no longer in favour. For example, in periods of high gasoline prices, consumers that can afford to switch up will tend to go for more fuel efficient vehicles, and the market can get flooded with inefficient ones – which has the effect of pushing down prices of these out of favour beasts, putting them within reach of poorer people. The fuel costs may be higher, but at least they can buy wheels.

That likely won’t happen this time around, if we see people buy ICE vehicles and then hoard them for as long as they can. In fact, things are terrible already for lower income people looking to buy older used cars – prices have skyrocketed for those as well. 

Used cars are expensive, new cars are hideously more so, and Evs are, thus far, mostly toys of the wealthy with multi-car garages, or well paid urbanites that can afford to use them where they really shine. Again, we can see where China is twelve steps ahead; many popular Evs in China are tiny, cheap EV runabouts that don’t have massive range, but get the job done. No such option is available here in North America, few in Europe, and if they do show up on these shores, it is a safe bet they will be of Chinese origin, because they’re the only ones that can make money at it.

New York Reality

I took a quick look at the numbers to see if the Advanced Clean Car regulations in New York that require a certain percentage of new vehicle sales that are ZEVs or PHEVs have realistic targets.  The requirements are:

This percentage requirement will start at 35% in model year 2026 and increase to 100% of sales for 2035 and subsequent model years.  PHEVs may be used to meet up to 20% of the annual ZEV requirement and they must meet minimum technical requirements. The use of PHEVs to meet part of the annual ZEV requirement will sunset following the 2035 model year.

Where is the state now relative to these mandates?  At one time it would have been relatively easy to get the necessary data to determine the status.  However, the NY Department of Motor Vehicles no longer provides historical registration and new vehicle registration summary information.  Instead the primary New York registration information through Data.NY.Gov is a data dump of 12.5 million rows of registrations.  Completely worthless without a lot of processing and I don’t think it includes any historical information.  There is Data.NY.Gov source of summary registration by fuel type and county data.

In order to estimate the EV percentage of new car sales I needed the number of vehicles sold in New York.  I could not find that data but did find data for the United States.  I assumed that the percentage of new car sales in New York would be the same as the percentage of the country.  I found a source for United State motor vehicle registrations that included state data.  The following table lists country-wide and New York registrations by vehicle type.  I lumped all the registrations together for this analysis.

For new car sales I found data for the country.  I estimated the New York new car sales as the same percentage of new sales to total registrations for the country.  The following table lists those results.  Because I did not have registration data after 2019, I assumed the New York sales would equal the 5-year average for 2019 and subsequent years (highlighted in yellow).

I previously listed the EV registration data for New York.  The following table includes a projection of sales needed for model year 2026.  These assumptions show that the idea that New York will be able to meet the Advanced Clean Car rule 2026 mandate is preposterous.  In 2023 I estimate that 8.6% of the vehicle sold will be EVs.  Note that PHEVs made up around 50% of the sales in 2022 but that starting in 2026 that percentage needs to be lowered to 20%.  I interpolated where we are in 2023 to 2026 and the increase in sales of EVs is not likely.  To think that in 2025 that EV sales will be larger than the number of EVs currently on the road is nothing but wishful thinking.

The State Register notice describes the public comments:

Most of the more than 4,400 commenters including vehicle manufacturers, environmental groups, and non-governmental organizations supported the Department’s ACC II adoption. The remaining six commenters, including a large manufacturer of diesel engines and a petroleum industry trade group, were opposed to the regulation.

Typically, DEC will point to this overwhelming support in favor of the regulation as “proof” that it is appropriate.  If the comments were representative of general public opinion, then the percentage of EVs on the road in New York and the sales totals would be much higher.  As a result, the argument that the comments supporting the program are representative of general public opinion fails.  The overwhelming numbers do show that the environmental movement is extremely good at playing the game.

Used Vehicles

I believe that the regulation only applies to new cars.  This explanation states: “This law doesn’t affect gas cars already on the road, the sale of used gas cars or new registrations of gas cars.”  I suspect what we will see will be similar to what happened in Cuba.  Etam notes that:

Cuba has not had access to modern automotive technology since the 1960s. As a result, streets still are full of ancient American cars, held together forever.

There is no reason to think that won’t happen in the US, Canada and western Europe when the new-ICE ban comes into effect. Some segments of the population will go with the regulatory-mandated flow, while a great many will hold onto what they know, trust, and love. Short of a miracle battery breakthrough, many will simply not trust EVs in cold weather and/or instances where battery power doesn’t cut it.

As note previously, the lack of used EVs will impact the low income and disadvantage communities the most.  The regulation tries to address this problem but I don’t think the plan is very useful:

The proposed voluntary ACC II EJ flexibility is intended to award extra ZEV values to OEMs that undertake programs to expand ZEV availability to low income and disadvantaged communities. Optional programs include discounted ZEVs and PHEVs placed in community-based clean mobility programs, used ZEVs and PHEVs remaining in New York following the expiration of their lease term, and making low-cost ZEVs available to low income and disadvantaged communities. EJ values will be capped at 5% per year and will sunset following model year 2031.

Conclusion

From a practical standpoint I do not see how the new car sales mandates are going to convince those members of the public that EVs have more problems than benefits to buy one.  I bet that enterprising car salesmen will figure out ways around the regulation for those people who want a new internal combustion engine or even a PHEV for that matter.  If I but one out of state and come in toe DMV to register it are they going to say you cannot do that?  Will there be a market for sales out-of-state to middle men who buy a specific new car then turn around and sell it “used”.  The ultimate fall back is to simply keep the existing cars running as long a possible.

When I tell someone that there is a regulation in place that will eventually force them to buy an electric vehicle, the usual response is to say they cannot do that and I won’t buy one.  Unfortunately, the law is in place and eventually there will not be any other options for new vehicles.  The only alternative is to vote out the pandering politicians who respond to the marketing efforts of the Big Green lobbyists that got us into this mess.  I think that will eventually happen and I can’t wait.

Micron Chip Plant Impact Update

A recent report by the Syracuse Post Standard described the most recent environmental impact assessment for the Micron Technology’s planned semiconductor plant.  Last month I described the keynote address for the Business Council of New York 2023 Renewable Energy Conference Energy by Richard Ellenbogen.   I contacted Ellenbogen to let him know that the original projection of for energy use that would be the same as the state of Vermont has been expanded to the same as Vermont and New Hampshire.  This post describes Ellenbogen’s reaction to that news.

Ellenbogen is President [BIO] of Allied Converters and frequently copies me on emails that address various issues associated with New York’s Climate Leadership and Community Protection Act (CLCPA).  I have published other articles by Ellenbogen because he truly cares about the environment and the environmental performance record of his business shows that he is walking the walk.   When he sent a copy of the presentation I asked if I could it post after the conference.

Why NY State Must Rethink Its Energy Plan

Ellenbogen’s keynote address was titled “Why NY State Must Rethink Its Energy Plan and Ten Suggestions to Help Fix the Problems.”  My post on the presentation  summarized the power point presentation for his keynote address.

One of his suggestions concerned the Micron plant:

Allow Micron Technologies to build a combined cycle plant the size of Cricket Valley Energy Center on their property. The Micron facility will use more energy than the state of Vermont. With generation on-site, the thermal energy could be used at the plant and the 350 GWh of annual line loss will be eliminated. Instead of making them look “green” on paper by buying carbon credits, let them be green in reality with high efficiency generation and have lower energy costs to make them more competitive and able to recoup the $5 billion rebate without faking it. That will eliminate the increase in statewide energy use related to the facility.

Micron Environmental Impact

Glen Coin and Tim Knauss provided an update (subscribers only unfortunately) on the environmental impacts of the facility.  Their article included the following statements:

The new estimates of water and energy use are for entire the complex when finished 20 years from now. The company plans to build the four fabrication plants, or fabs, sequentially: Construction of fab 1 starting in November 2024, and work on the fourth fab completed by 2043.

When the Clay complex is complete in 2043, it would use more water and more electricity than all of the company’s factories and offices in use today. The Clay complex will consume 16 billion kilowatt-hours of electricity per year; according to the 2023 sustainability report, all of the company’s fabs now use a combined 11 billion kilowatt hours

Sixteen billion kilowatt-hours per year is enough for more than 2 million average households.

The Micron fab would use about the same amount of electricity as Vermont and New Hampshire combined, according to data from the U.S. Energy Information Administration.

Ellenbogen Update

Ellenbogen prepared the following update after I sent him the article:

I have been using the Micron facility as an example of how the CLCPA is actually going to increase NY State’s carbon footprint because transmitting all of that energy to the Micron site, as much as is used by the state of Vermont,  over long distances was going to result in an amount of lost energy on the wires that could operate 1-3/4 Cornell Universities.  One of my readers sent me an update of energy use because now it is projected that the Clay complex will consume 16 billion kilowatt-hours of electricity per year, as much as Vermont and New Hampshire combined, or 16,000 Gigawatt Hours annually (16 Tera-watt hours).  That is double the original projections and the idea that this could be supported with renewable generation is laughable.  16,000 GWh is an 11%  increase in NY State electric usage just related to the one facility.  The line loss will also double to consume the output of about  a 100 megawatt fossil fuel plant under continuous operation.

To put the Micron facility’s usage into perspective, in its last full year of operation the 2 Gigawatt Indian Point nuclear plant generated 16.3 Tera-watt hours so the Micron facility will need to be supported by a 2 Gigawatt fossil fuel or nuclear plant on site or  2.1 Gigawatts of generation off site, 5% more.  NY State’s policy makes absolutely no sense.  To run the Micron facility would require using about 4 GW of the projected 9 GW of offshore wind to support the plant or 16 GW of solar arrays covering 128,000 acres (80 acres per 10 MW)  or 200 Square miles.  NY State has 7 million acres of farmland so solar arrays to support the Micron facility  would use almost 2% of the farmland in the state and would also require an enormous amount of battery storage, the cost of which would greatly exceed the cost of a nuclear plant on site.  A combined cycle generating plant on site would be about 75% less than the cost of the nuclear plant.  Both the combined cycle gas plant and the nuclear plant on-site offer the option of recovering the waste heat and using it in the plant to make Micron even more energy efficient.  With regard to the solar and wind, NY State is having major difficulties getting all of their renewable projects finished because of cost issues and interconnection issues, let alone adding this gigantic lead weight to the Camel’s back.

The politicians can say whatever they want about the wonders of the CLCPA but the mathematical analysis of the project says that the CLCPA and the mandate for Micron to buy Carbon credits is going to raise NY State’s carbon footprint substantially while also raising Micron’s costs.  It’s a Lose-Lose proposition for everyone.

That’s what happens when you outsource utility planning to Climate Scientists and environmental activists that have no understanding of what they are doing, which is what NY State has done.

Conclusion

I agree with Ellenbogen’s points.  The obvious approach for the energy needed by Micron would be co-generation.  As much as I would like to say that this should be provided by nuclear, I agree with him that costs and implementation time preclude that option now so a combined cycle natural gas-fired plant is the pragmatic choice.  Either option produces waste heat that can be used at the facility which increases the energy efficiency.  As he says the expectation that renewables can provide the necessary power on top of the existing load needs is laughable.  Importantly, a facility like this must have uninterruptible power and providing that from wind and solar is an extreme challenge. Finally, I want to close with one of Ellenbogen’s points from his presentation: “When fantasies meet reality, reality always wins.”  The Climate Act renewable plans are fantasy and the inevitable clash with reality is going to be interesting to watch.

The Problem with Overbuilding Wind and Solar

The Climate Leadership & Community Protection Act (Climate Act) net-zero transition plan includes a requirement for “zero-emissions” electric generating by 2040.  New York’s irrational energy policies preclude the only proven zero-emissions choice (nuclear energy) to meet that requirement.  Instead, the emphasis is on solar and wind development.  A recent post at Trust, yet verify includes a great graphic that illustrates an inherent flaw with wind and solar that Climate Act implementation must address.

I have been following the Climate Act since it was first proposed. I submitted comments on the Climate Act implementation plan and have written over 300 articles about New York’s net-zero transition. The opinions expressed in this post do not reflect the position of any of my previous employers or any other company I have been associated with, these comments are mine alone.

Climate Act Background

The Climate Act established a New York “Net Zero” target (85% reduction and 15% offset of emissions) by 2050 and an interim 2030 target of a 40% reduction by 2030. The Climate Action Council is responsible for preparing the Scoping Plan that outlines how to “achieve the State’s bold clean energy and climate agenda.”  In brief, that plan is to electrify everything possible and power the electric grid with zero-emissions generating resources by 2040.  The Integration Analysis prepared by the New York State Energy Research and Development Authority (NYSERDA) and its consultants quantifies the impact of the electrification strategies.  That material was used to write a Draft Scoping Plan.  After a year-long review the Scoping Plan recommendations were finalized at the end of 2022.  In 2023 the Scoping Plan recommendations are supposed to be implemented through regulation and legislation. 

Implementation

In order to get a sense of the magnitude of the renewable resource development necessary to implement the Climate Act this section shows the expected changes to load and generating resources. 

The New York Independent System Operator (NYISO) 2023 Load & Capacity Data Report (also known as the “Gold Book”) 2023 Load & Capacity Data Report (Gold Book) lists the 2022 observed load and projections out to 2053.  The following excerpt shows Table I 1-a baseline energy and demand data to 2040.

There are two relevant projections for future generating resources.  The “official” Hochul Administration projections are in the Final Scoping Plan.   The NYISO projections are in the 2021-2040 System & Resource Outlook  I compare the installed capacity for Scoping Plan and the Resource Outlook in the next table.  For this post I am only concerned with the total generation projections.

In 2022 the peak observed load was 31,709 MW and the installed summer capability 37,178 MW. In 2030 the NYISO Gold Book baseline predicted summer peak load is 32,490 MW and 36,930 MW in 2040.  The peak winter load is 28,970 in 2030 and 44,800 in 2040. In the following table, I list the maximum capability and peak load data and calculate the capability to peak load margin. 

The NISO Gold Book Table V-3 lists the historical Installed Reserve Margin (IRM) values for the New York Control Area and the historical minimum Locational Capacity Requirements (LCRs) approved by the NYISO for Zones G-J, Zone J, and Zone K.  The IRM requirements are established each year by the New York State Reliability Council (NYSRC).  The IRM represents the minimum level of capacity, beyond the forecasted peak demand, which utilities and other energy providers must procure to serve consumers.  This post is not going to address the LCRs. 

As shown here New York will require an unprecedented level of new wind and solar development in order to meet the net-zero transition mandates of the Climate Act.  Note that the capability to peak margin calculated in the preceding table is not exactly the same as the IRM but the expectation is that the IRM will increase significantly in the future.  The reason for this IRM shift is that wind and solar are intermittent and overbuilding those resources is necessary to address that intermittency.  While overbuilding is suggested as the solution for the best energy plan the question is how much is enough and whether it is a solution that eliminates the need for any new resources.

One Third on Average

I am convinced that overbuilding is not as viable a solution as its proponents claim.  However, trying to explain the reasons why is complicated so I have been looking for a more-easily understood graphical explanation.  Michel Opdbe wrting at the at Trust, yet verify blog has just such a graphic.

Opdbe lives in Belgium and writes about renewable energy policies in Belgium and adjoining countries.  His recent post addressed a claim that on average of 1/3 of the total electricity demand in the Netherlands is now supplied by sun, wind and water. The post was based on a tweet with this message (translated from Dutch):

An average of 1/3 of the total electricity demand in the Netherlands is now supplied by sun, wind and water. The record is from Sunday 24 April, with a nice 68%.
The low of last winter was on November 30, with only 4%.
#graphoftheday

It was accompanied by a graph showing the daily energy production by solar, wind and water as percent of total demand of the Netherlands:

He explains:

The thick yellow line is the four weeks moving average and, indeed, it ends up at roughly one third of demand at the beginning of 2023. That is however only part of the story, as also hinted by the two values that are mentioned in the text of the tweet.

Although the average ends up around one third of demand, it is derived from a incredibly wide range. According to the tweet, solar and wind together with water produced between 4% and 68% of total demand in 2022 in the Netherlands.

There is also something in this graph that drew my attention, but it is not that clear from that graph. Unfortunately, I don’t have the data from the Netherlands. Luckily, this dynamic is not unique to the Netherlands, it is exactly the same in Belgium and the Belgian data is readily available.

In my opinion this dynamic is universal across all jurisdictions that are moving to a reliance on wind and solar.

This is a recreation of that graph using the Belgian data (only solar and wind, water power in Belgium is negligible):

The Belgian figures are close to that of the Netherlands, albeit a bit lower. The average share of Belgian solar and wind as percent of demand is roughly one fourth (compared to one third of the Netherlands). The range of the Belgian data is also somewhat smaller (between 1 and 58%) compared to the Netherlands (between 4 and 68%). The overall shape is however similar. There is the same funnel shape that is widening the more capacity is added.

The following graphic illustrates the problem well.

Now it is easier to highlight a bit more the wide range that this average is derived from. These are the minimum and maximum values of the share of solar and wind in demand of each year:

It is clear that the lower and upper boundaries don’t increase in the same way The lower boundary is hardly budging, it keeps close to the x-axis over the entire period. In 2022, the lowest daily share supplied by solar and wind was only about 1% of total demand. This didn’t change much over the years: it was roughly between 0.7% and 1.8% of demand between 2014 and 2022. This tells us that a lot of dispatchable capacity will still be needed at specific times of the year (in this case, pretty close to the expected demand and, looking at its shallow slope, that might be the case for quite a while).

The upper boundary behaves different. It shoots up exponentially. In 2022, the highest daily share supplied by solar and wind was 58% of total demand, coming from around 20% in 2014.

Meaning that the difference between the lower and upper boundary will keep increasing over time. Basically, electricity production by solar and wind will at times start to exceed demand, while the need for backup at specific times of the year will stay high.

The key point illustrated in this graph is that over building wind and solar does not help much for those periods when wind and solar resources are low due to the weather.

Some people also seem to recognize this type of dynamic. Already the first comment below the tweet nails it (translated from Dutch):

If we now just install three times as much, then we have more than twice too much at the peak and are almost 90% short at the lowest point.

I couldn’t have said it better.

Discussion

Based on every study of intermittent wind and solar that I have seen, the difference between the lower and upper boundary of wind and solar output will keep increasing over time as these resources are added to any electric system.   New York is not as bad as Belgium and Netherlands but it is the reason that the New York IRM will increase from around 20% to on the order of 150% in 2040.   The reason for this universal truth is that meteorological conditions that cause light winds are geographically large.  When the wind is light at one site in New York it is very likely that winds are light across the state.  Data from Australia shows a similar effect across that entire continent.

There are a couple of ramifications.  First, overbuilding is not a complete solution.  Grid operators must always match load with generation.  Therefore, resource adequacy planning must have a solution even at the minimum wind and solar generation output.  If the overall state-wide wind generation capacity is only 10% you would need to overbuild by a factor of ten to provide power at night.  Aside from the cost I believe that amount of wind development exceeds the expected wind resource availability in New York.  In order to address this a new technology is needed.  The New York State Public Service Commission (PSC) recently initiated an “Order initiating a process regarding the zero-emissions target” that will “identify innovative technologies to ensure reliability of a zero-emissions electric grid” for this reason.

The other part of the problem is that when wind and solar resources are over-built there will be more and more periods when their output exceeds demand. When that happens the electricity market has issues.  Many wind and solar contracts are written such that the operators are paid whether or not the energy produced is needed.  For example, the Ontario Independent Electricity System Operator must get rid of the unneeded power by selling it to neighboring control areas at below market costs.  New York is a big purchaser of this cheap power.  While those purchases drive costs down for ratepayers it also adversely affects the viability of in-state generating facilities.  On the other hand, during the light wind conditions in-state generating facilities are needed so it may reach the point that they have to be subsidized to be available.  Eventually New York will be in a similar position to Ontario.  It turns out that the low- price sales are subsidized by Ontario ratepayers.  When everyone has over-built I also wonder where the excess power will be dumped.

Conclusion

The graph of solar and wind generation resources as a fraction of the total resources shows a characteristic shape that proves that over building wind and solar generation does not help always fulfill load requirements.  Electric grid operators must match the output of generating resources  at all times so this means the problem has to be addressed.  Further compounding the problem is the fact that peak loads are associated with temperature extremes that are linked to high-pressure systems that also create light winds.  In other words the over-building effect is most pronounced when energy demand peaks exacerbating the risks to reliability when electricity is needed most.

At least one commenter understands the problem when he said “If we now just install three times as much, then we have more than twice too much at the peak and are almost 90% short at the lowest point”.  I agree with Opdbe – I couldn’t have said it better.

The unanswered questions are how will the Climate Act implementation address this problem, what will it cost, and will it be able to maintain current standards of reliability.