

Updated after initial plublicatipn to include an Executive Summary and description of the RGGI announcement
In the last month I have published articles describing the impact of last year’s revisions to the Regional Greenhouse Gas Initiative (RGGI) and the impact of Virginia re-joining the program this year. I noted that the cost of permits to emit CO2, aka allowances, increase when there is uncertainty or there is a scarcity of allowances. This post examines the results of the second quarterly auction of 2026 and concludes that the RGGI states must reconsider cost containment provisions and the projected trajectory for the cap on allowances.
Updated – Executive Summary
The second-quarter 2026 RGGI auction confirms that the program has become both an immediate affordability problem for consumers and a growing reliability risk. The allowance clearing price jumped 40% from $24.99 in March to $35.00 in June, and all available cost-containment reserve allowances for 2026 had already been exhausted by the prior auction. Using New York as a case study, the post shows that direct allowance purchases already cost consumers on the order of 700 million dollars per year at 2025 prices, rising to well over 1.1 billion dollars if the new 35‑dollar price persists. Once the wholesale market cost adder is included, the effective consumer burden plausibly reaches into the 1.8–3.2-billion-dollar range, much of which becomes windfall revenue for generators that do not themselves have RGGI obligations and does not come back to customers through any investment program.
The post argues that these rising costs are not matched by commensurate emissions or reliability benefits, and in fact sit on top of an allowance trajectory that is fundamentally incompatible with historical and expected emissions trends. The updated cap path reduces allowances by more than 10 percent of the 2025 budget each year from 2027 through 2033, despite the fact that the region has never sustained reductions of that magnitude and recent years have seen emissions rise with load growth. When banked allowances are accounted for, the analysis indicates that the system could effectively “run out” of allowances as early as the second quarter of 2032, forcing compliant units either to shut down or to operate out of compliance. At the same time, a review of RGGI investment reports suggests that auction proceeds are being deployed inefficiently: the implied cost per ton reduced is far above common social cost of carbon values, and RGGI-funded projects explain only a small fraction of observed reductions. The post concludes that the program now poses unacceptable affordability and reliability risks and needs immediate, fundamental revision—by regulators, system operators, and state lawmakers should reconsider participation —rather than the incremental tinkering contemplated in recent RGGI communications.
Author Background
Dealing with the RGGI regulatory and political landscapes is challenging enough and agency retribution is enough of a threat that affected entities seldom see value in speaking out about fundamental issues associated with the program. I have been involved in the RGGI program process since its inception and have no such restrictions when writing about the about problems with the RGGI program. I have worked on every cap-and-trade program affecting electric generating facilities in New York including RGGI, the Acid Rain Program, and several Nitrogen Oxide programs, since the inception of those programs. I also participated in RGGI Auction 41 successfully winning allowances and holding them for several years. The opinions expressed in this post do not reflect the position of any of my previous employers or any other organization I have been associated with, these comments are mine alone.
RGGI is a market-based program to reduce greenhouse gas emissions from the power sector. It has been a cooperative effort among Connecticut, Delaware, Maine, Maryland, Massachusetts, New Hampshire, New York, Rhode Island, and Vermont since 2008, with New Jersey rejoining in 2020 and Virginia scheduled to rejoin beginning July 1, 2026; Pennsylvania recently decided not to join.
According to the RGGI program description, the states issue permits to emit a ton of CO₂ that are distributed almost entirely through regional auctions, and the proceeds are then reinvested in strategic energy and consumer programs. Those investments include energy efficiency, clean and renewable energy, beneficial electrification, greenhouse gas abatement and climate adaptation, and direct bill assistance, with energy efficiency receiving the largest share.
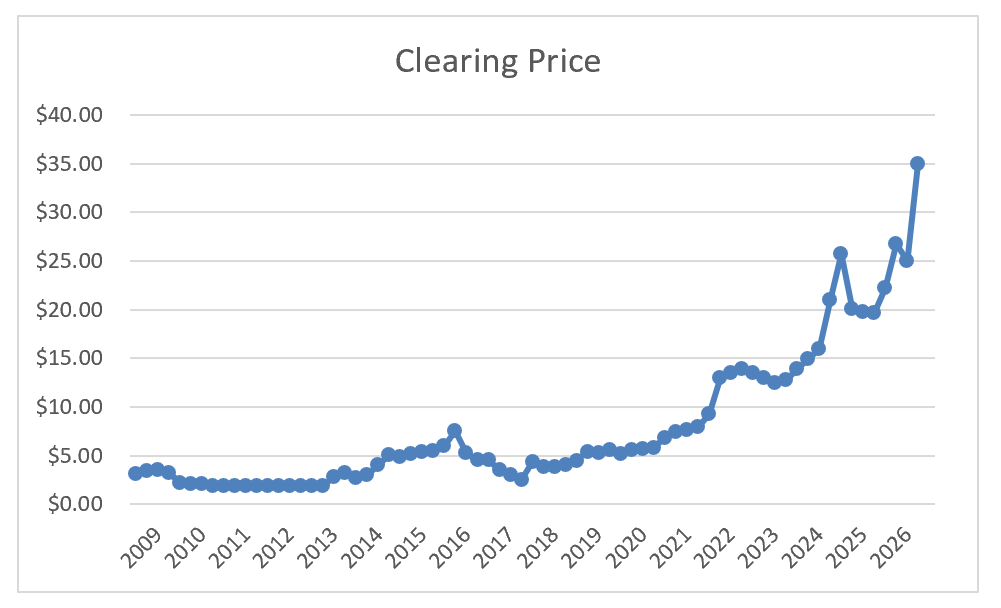
I have long had concerns about the RGGI program, but recent events have exacerbated potential impacts on affordability and reliability. The event that solidified my belief that changes are in order was the fallout from the April 29, 2026 RGGI statement that Virginia was rejoining the program. I explained in the days that followed, the futures market price of RGGI allowances nearly doubled, and the spot market cost also increased significantly. The closing price of the most recent RGGI auction on June 3, 2026, was $35.00 up $10 from the March 11, 2026 auction price of $24.99 (Figure 1). This post describes the my concerns with this volatility.
Figure 1: RGGI Quarterly Auction Clearing Price
RGGI Affordability
RGGI allowance costs are driven by basic economic considerations. When there is scarcity, prices increase; when there is uncertainty about scarcity, costs also go up. The difference is that price increases associated with uncertainty can drop when more information is available, whereas as will be shown in the following, scarcity has been built into RGGI so costs may remain high going forward.
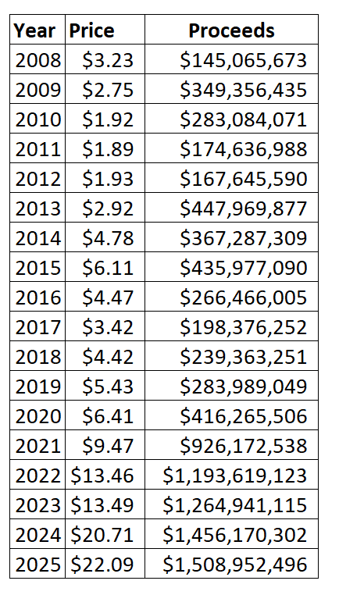
There are two consumer impacts of higher RGGI allowance prices. Table 1 lists the annual proceeds from the RGGI auctions which in the last two years have totaled about $1.5 billion. RGGI advocates claim these proceeds are invested in strategic energy and consumer programs. In my review of the latest annual RGGI Investments of Proceeds report I concluded that RGGI does not make effective investments. Claims that RGGI is a successful program are inconsistent with the following observations. The overall RGGI cost per ton of CO2 reduced is $849.50 which is far above the social cost of carbon. The amount raised falls far short of the funds necessary to reduce RGGI emissions in accordance with Third Program Review requirements. Emission reductions associated with RGGI investments only account for 7.6% of the observed reductions.
In 2025 the direct cost of allowances in New York equals the annual emissions by multiplied by the average auction price: 32,037,339 tons times the annual allowance price or $22.09 per ton. NYS consumers paid about $707.7 million for RGGI allowance costs assuming all allowances used came from the 2025 auctions.
Table 1: Annual Auction Price and Proceeds
In a recent article I described the second consumer impact of RGGI allowance costs. When generating units bid to sell their power in daily electricity market auctions, they include the cost to purchase replacement RGGI allowances. If the clearing price is set by a unit that must comply with RGGI, then the added cost of RGGI allowances is included in their bid. The problem for consumers is that every generating unit gets paid the clearing price. That means facilities with no RGGI compliance obligations still get paid as if they did. As a result, those facilities garner windfall profits at the public’s expense.
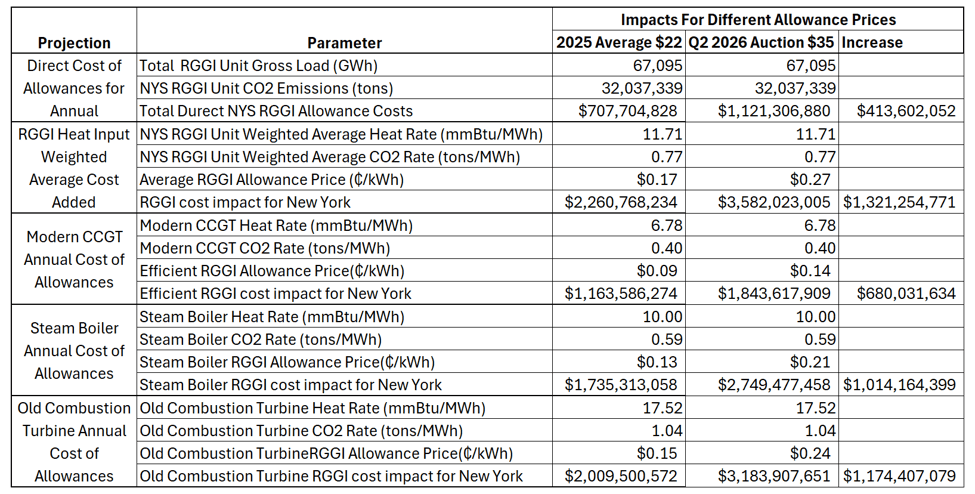
My analysis only looked at the effect of the RGGI electric market cost adder on New York State ratepayers. I used annual values as a proxy for the hourly impacts that would ideally be calculated and summed across the year. In 2025, statewide gross energy from New York RGGI units totaled 67,094.6 GWh, those units emitted 32,037,339 tons of CO2, the average quarterly RGGI auction price was $22.09 per ton, and NYISO Gold Book Table III-2a reports total net New York energy of 132,182 GWh.
Table 2 provides bounding estimates for the electric market effect for last year’s average allowance price and the clearing price of the Quarter 2, 2026 RGGI auction ($35). The first section, “Cost of Allowances for Annual Emissions,” documents the direct allowance-cost numbers. If the future RGGI allowance prices settle at the Quarter 2 2026 auction price, consumers will have to pay an additional $413.6 million for a total of $1.121 billion. The remaining scenarios use observed heat rates and observed CO2 emission rates derived from EPA data to estimate an allowance-cost adder in dollars per MWh, which is then multiplied by total NYISO energy to estimate the statewide annual cost impact for the two allowance prices. This bounds the likely costs to consumers. I believe that RGGI-affected units normally set the clearing price. If the price were set by a modern combined cycle gas turbine every hour at the average generation rate, then the increase from last year’s average price to the last quarterly auction price then consumer costs would increase $680 million to a total of $1.8 billion. I believe this is a lower bound. Using the same assumptions but assuming the auction price is set by an old inefficient simple-cycle combustion turbine, consumer impacts increase $1.17 billion to $3.18 billion.
Table 2: Range of Impacts of RGGI Cost Adder on New York State Ratepayer Annual Costs
Also note that the windfall profits do not accrue just to New York generators. All imported electricity delivered to New York is affected by RGGI costs. Imported electricity from outside New York has the same perverse outcome: embedded RGGI costs paid in the exporting state are included in the prices paid by New York consumers. My analysis does not include these costs, so I am underestimating the impact of RGGI costs. This situation exists for all RGGI states.
RGGI Reliability
There is another RGGI issue that needs to be addressed. RGGI advocates ignore the fundamental risk that RGGI-affected electric generating units will only operate if they possess allowances to comply with their RGGI obligations. The RGGI states recently updated the allowance cap trajectory so it would be consistent with state laws that require emissions to go to zero. As a result, the allowances allotted to the program decline by over 10 percent of the 2025 budget per year from 2027 through 2033. The problem is that the historical emissions have never consistently shown reductions of that magnitude.
RGGI Emission Trends
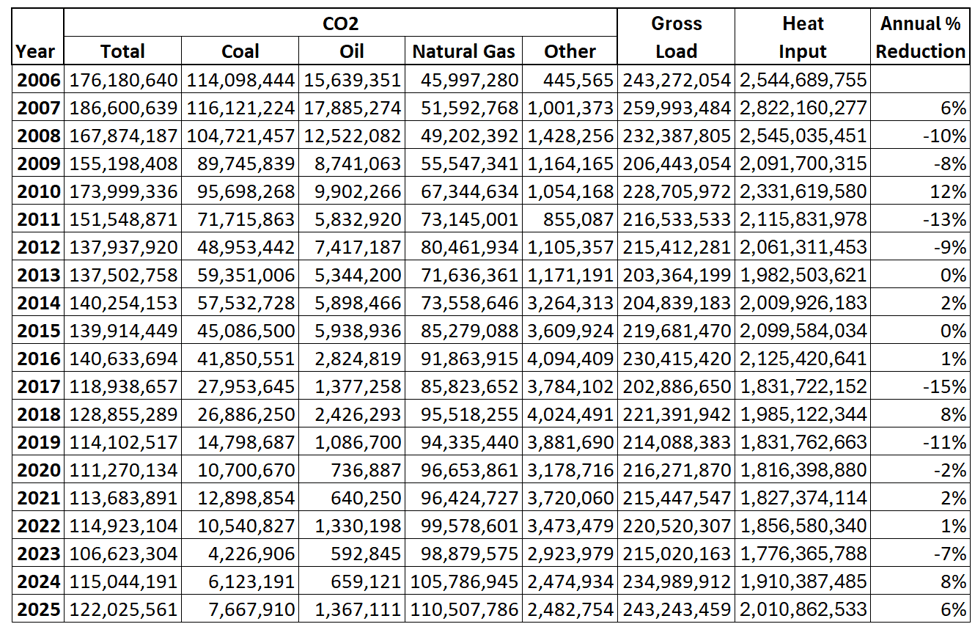
Figure 2 plots CO₂ emissions by fuel type across all eleven states from 2006 to 2025. What you see is fuel switching caused the reductions and that there are only minor opportunities for future fuel switching. When I analyzed the 2023 RGGI investment proceeds report, I found that only about 7.6% of observed emission reductions could be attributed to RGGI‑funded projects despite RGGI auction proceeds of over $7 billion since 2021. Changes to Federal policy, supply chain issues, and inflation coupled with load growth all indicate that reductions from other programs are unlikely as well.
Figure 2: Eleven State RGGI CO₂ Emissions (short tons) for all Programs 2006–2025
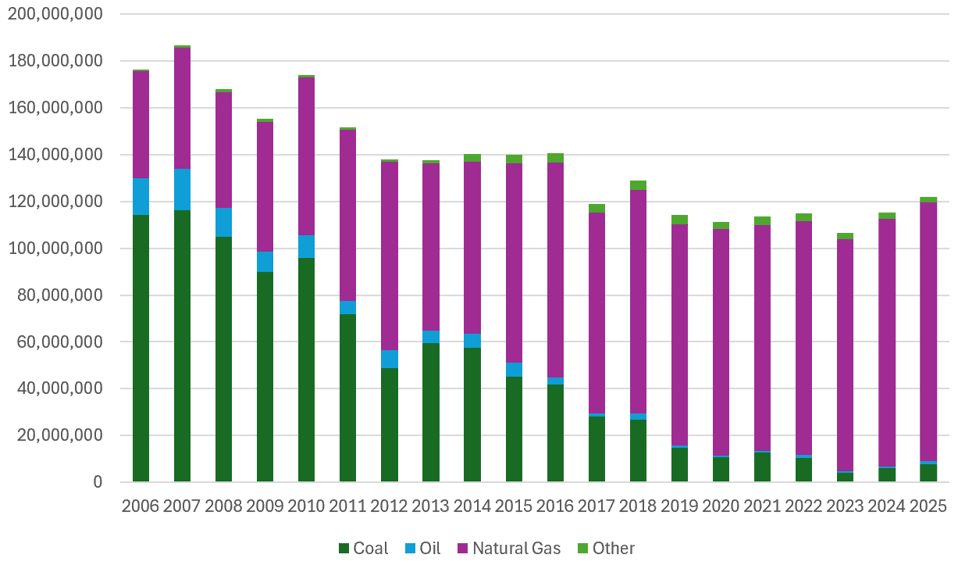
Table 3 demonstrates that the cap trajectory is simply incompatible with reality. There have been four years with double digit percentage emission reductions and one of those occurred before RGGI started. Because CO2 reductions are essentially equivalent to energy use, interannual variation can be caused by weather demand for energy. Sustained emission reductions can occur because of control programs for other pollutants and economic fuel switching to low carbon fuel aka natural gas. I think the 2008 10% reduction was affected by fuel switching and weather variations. The first three years (2009-2011) of RGGI were characterized by increases and decreases that had nothing to do with RGGI. The largest annual reduction since RGGI started in 2009 occurred in 2017 and was due to economic fuel switching. The last double digit percentage reduction occurred in 2019. Most importantly, emissions have increased due to load growth in the last two years.
Table 3: 11-State Clean Air Markets Division Emissions Data for All Regulatory Programs
When Will the Allowances Run Out?
Because the revised RGGI allowance reduction trajectory did not consider the emission trend I made an estimate of future allowance status using the data described above to determine when allowance availability would require units to shut down to comply. Comparing the allowance allocations to the emissions does not consider the allowances already in the system. The “allowance bank” is the aggregate number of allowances in circulation that have been issued but not yet surrendered for compliance (i.e., held in accounts or set‑asides). Historically there has been such a large bank of allowances the RGGI States implemented several adjustments to the allowances allocated to reduce the bank. These adjustments ended in 2025.
RGGI does not provide a report that regularly describes the status of the allowance bank, so I had to develop my own estimate. In my post When will the allowances run out? I documented the procedure I used to estimate quarterly emissions, allowance additions, and the resulting allowance bank status so I will not repeat that material here.
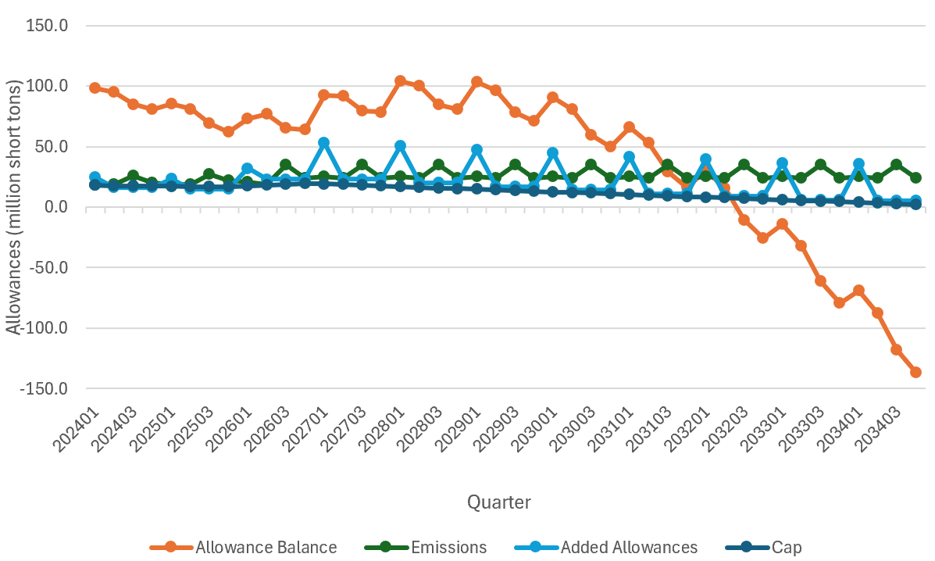
Figure 3 plots the quarterly emissions (green), allowance cap (dark blue), added allowances (light blue) and allowance balance (orange). This analysis assumes that emissions remain constant and shows that as the allowance cap is reduced the bank of allowances eventually is exhausted. When the allowance balance is less than zero there are no longer sufficient permits to emit CO2 and affected units must shut down or end up out of compliance. My analysis projects that this could happen as soon as Quarter 2 2032.
Figure 5: Quarterly RGGI Allowance Balance, Emissions and Allowance Cap
RGGI Revisions are Necessary
In response on May 8, the RGGI states issued a notice that they were monitoring the allowance market in response to a sharp increase in the secondary futures market price. The closing price of the June 3, 2026, quarterly auction shows that their concerns about allowance market prices are legitimate.
The RGGI allowance results announcement also described concerns:
Following this auction, the RGGI states intend to begin a scoping process to consider further targeted measures to continue to achieve reliable, clean electricity supply at affordable prices for consumers. As part of that process, the RGGI states will offer opportunities to engage stakeholders for feedback on the range of topics to be considered and analyses that could be conducted, such as analyses related to ensuring RGGI’s continued benefits to residents, affordability to consumers, and the smooth reintegration of Virginia into the market.
The RGGI third program review process took years. This stakeholder engagement needs to be done quickly and not on a protracted basis like that. Consumers are revolting against utility rate hikes under 10% and this 40% increase will add to those cost increases. RGGI states needs to be accountable.
Unfortunately, the RGGI states have not acknowledged two other cost problems. RGGI states typically equate consumer costs to the auction prices. The cost to consumers includes two other impacts. RGGI-affected sources also purchase allowances on the secondary market and if the cost is higher than the auction purchase price consumers pay that cost and get no investment benefits. There also are no investment benefits in most of the embedded cost of RGGI allowances in the electric market. The RGGI cost adder is applied to all generators resulting in an enormous unacknowledged cost.
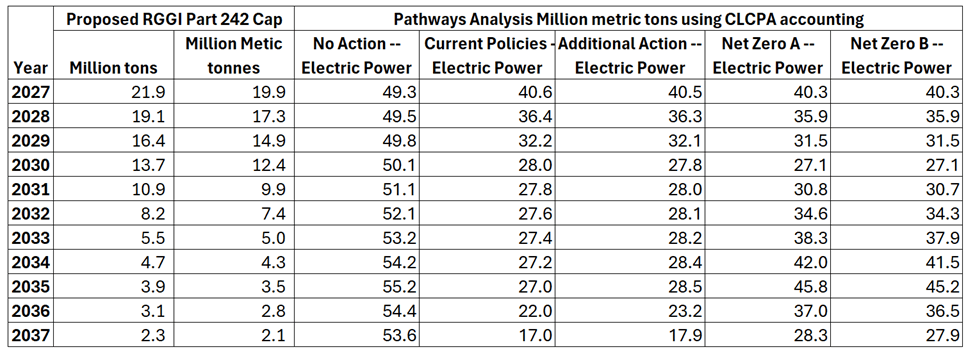
Finally, RGGI must acknowledge that the expectation that the current allowance trajectory is incompatible with the reality of potential emission reductions. I evaluated the emissions associated with the New York State Energy Plan Pathways Analysis scenarios. Table 4 shows that none of the scenarios project emissions consistent with the NYS RGGI allowance cap trajectory. This will inevitably force RGGI-affected sources to shut down to comply with RGGI creating an artificial energy shortage.
Table 4: Comparison of RGGI Proposed Part 242 Cap and State Energy Plan Pathways Analysis Electric Power Scenario Projections
Conclusion
RGGI must be revised. The Quarter 2 auction price increase from the previous auction portends future increased allowance costs. RGGI states have not acknowledged that the costs to consumers are greater than the funds available for investment benefits nor that the alleged benefit claims are weak, so this is affordability pain for no gain. The allowance cap trajectory is simply incompatible with observed and likely generating resource development that can displace existing resources. RGGI is headed to the point where there are insufficient allowances to enable sources to run and remain in compliance. This can no longer be ignored because if left unchecked this will lead to an artificial energy storage,
Three groups must act. Regulators should revise the RGGI regulations. The Regional Transmission Operators that operate in RGGI states must revise their planning estimates to incorporate the allowance cap trajectories. Politicians in RGGI states who are worried about energy affordability should seriously consider dropping out of the program because it is simply unaffordable and risky without major changes.

The post refers to a Table 4, but it is not there.
LikeLiked by 1 person
Corrected – Thank you very much for noting the error
LikeLike