
In my opinion the biggest problem with the Climate Leadership & Community Protection Act (Climate Act or CLCPA) is that implementation will inevitably lead to extraordinary cost increases. In September 2025 I described my first impressions of the Department of Public Service (DPS) Second Informational Report on overall implementation of the Climate Act and concluded that it was more about messaging than providing New Yorkers with unbiased information. DPS staff have now released the Third Informational Report on Overall Implementation of the CLCPA (Third Informational Report), dated November 19, 2026. This post updates my Second Report assessment with the new data. In my view, the Third Report reinforces my affordability concerns instead of resolving them.
I am convinced that implementation of the New York Climate Act net-zero mandates will do more harm than good if the future electric system relies only on wind, solar, and energy storage because of reliability and affordability risks. I have followed the Climate Act since it was first proposed, submitted comments on the Climate Act implementation plan, and have written nearly 700 articles about New York’s net-zero transition. The opinions expressed in this article do not reflect the position of any of my previous employers or any other organization I have been associated with, these comments are mine alone. I acknowledge the use of Perplexity AI to support the development of this post.
Background
In Case 22-M-0149 the Public Service Commission (PSC) directed DPS staff to present an annual informational report on ratepayer costs and benefits of Climate Act investments. The First Report was presented in July 2023. The Second Report did not arrive until September 2025, over a year late, with no explanation for the delay. It covered Commission actions from January 2023 through August 2025 and estimated costs and outcomes from 2023 through 2029.
The Third Report covers Commission actions from September 2025 through October 2026, reports historical bills and cost recoveries for 2025, and forecasts bill impacts through 2030. That is closer to an annual schedule, but the scope has not changed. The Third Report still only addresses programs under PSC oversight and certain Federal Energy Regulatory Commission jurisdictional transmission projects. Programs funded through other sources, including the Regional Greenhouse Gas Initiative, are excluded.
The context has changed since the Second Report. According to a Chambers practice guide, the May 2026 State budget amended the Climate Act to replace the 2030 40% greenhouse gas reduction mandate with a 60% reduction by 2040, “only to the maximum extent feasible and cost-effective,” while leaving the 70% renewable electricity and 2040 zero-emissions electricity targets in place. The Legislature acknowledged that cost matters, but the Third Report still does not tell us what the complete program will cost or define what is “cost-effective”.
What Customers Are Paying
In the Second Report, the Summary of Ratepayer Impact for Electric Utilities table showed that residential Climate Act impacts ranged from 4.6% to 10.3% of 2023 total monthly electric bills. I described those estimates as conservative because of the pressure on agency staff to minimize the costs and because Climate Act spending was only ramping up in 2023.
Table 7 of the Third Report provides the following 2025 estimates for residential customers using 600 kWh per month. The clean energy amounts are the report’s combined “CLCPA/Clean Energy Initiatives” category, so they include programs that predate the 2019 law.
Table 1: CLCPA/Clean Energy Initiatives Share of Electric Bills
| Electric utility | Total monthly bill, 2025 | CLCPA/clean energy charges | Share of total bill |
| Central Hudson | $170.37 | $10.09 | 5.9% |
| Con Edison | $210.80 | $9.90 | 4.7% |
| NYSEG | $147.24 | $10.09 | 6.9% |
| National Grid | $126.57 | $12.58 | 9.9% |
| Orange & Rockland | $155.61 | $11.29 | 7.3% |
| RG&E | $138.93 | $10.59 | 7.6% |
| LIPA | $153.32 | $13.12 | 8.6% |
Source: Table 7 of the Third Informational Report on Overall Implementation of the CLCPA
The updated residential range is 4.7% to 9.9%, essentially unchanged from the Second Report’s 4.6% to 10.3%. Some will argue that costs have stabilized. I disagree. These are different years, and the report explains that billing and collection timing can significantly affect individual utility results. National Grid’s 2025 collections, for example, reflected the timing of NYSERDA billings, and a subsequent credit is scheduled to reach customers through its Clean Energy Standard statement effective April 1, 2027.
Residential percentages are also not the whole story. Table 7 attributes 12.7% of National Grid’s typical commercial bill, 15.0% of its industrial bill, and 16.5% of its high-load-factor industrial bill to these programs. Calling those charges a “small portion” of bills understates their significance for employers.
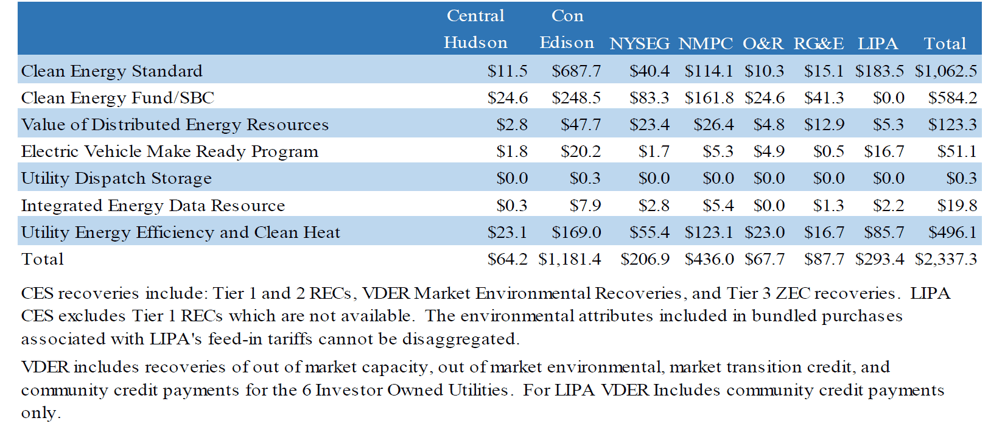
In aggregate, Tables 4 and 5 report approximately $2.34 billion in electric program recoveries and $152.6 million in gas energy efficiency recoveries during 2025. These are annual recoveries, not a complete accounting of transition obligations.
Table 2: Third Informational Report Table 7: 2025 Typical Monthly Electric Bills with CLCPA Related Costs Disaggregated
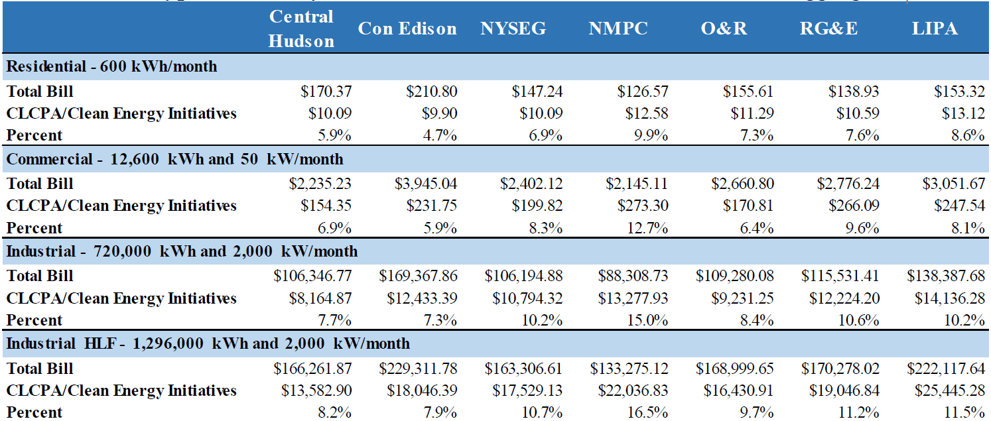
Table 3: Third Informational Report Table 4: 2025 Gas CLCPA Recoveries
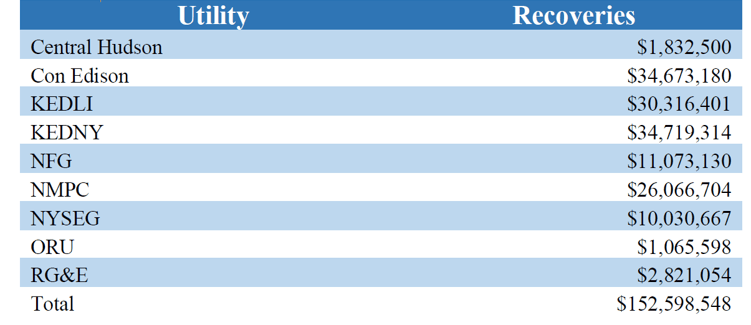
Table 4: Third Informational Report Table 5: 2025 Electric CLCPA Recoveries (in millions)
The Forecast Shows More Costs Coming
In the Second Report assessment I said the projections for the future were frankly unbelievable. Kris Martin from NY Solar Divide made the key point that the forecasts only included existing and already contracted capacity, not the additional capacity still needed for the 2030 renewable mandate. In my Stop Energy Sprawl presentation I estimated that, at roughly similar renewable energy credit pricing, growth in wind and solar generation from about 6.5 million MWh in 2024 to more than 63 million MWh in 2030 would raise those costs from about $220.9 million to above $2.1 billion.
The Third Report uses the same approach. Appendix D bases Tier 1 renewable energy credit forecasts on contracted projects, expected commercial operation dates, and assumed attrition. Offshore wind forecasts include Sunrise Wind and Empire Wind 1, assumed to enter commercial operation in mid-2027. Base delivery charges generally increase by an assumed 5% annually after current rate plans expire.
For a Central Hudson residential customer using 600 kWh per month, Appendix C projects the total bill increasing from $170.37 in 2025 to $219.07 in 2030, and the clean energy share of the bill rising from about 5.9% to 9.4%. For Con Edison, the total bill rises from $210.80 to $251.23, and the clean energy share increases from about 4.7% to 8.4%. Not all that increase is attributable to the Climate Act, but today’s charges clearly do not describe tomorrow’s burden. More importantly, the procurements still needed to approach the 70% target are not in these numbers.
Attribution Still Lacks a Baseline
In the Second Report, DPS acknowledged that some programs predate the Climate Act and that this makes it “challenging to split out the portion of existing initiatives that are exclusively linked to the CLCPA.” At the time I applauded DPS staff for not parsing out costs the way NYSERDA does to hide the true cost of the transition. I believe New Yorkers want to know the cost of the Climate Act transition goals and not just the costs attributed to the Climate Act itself.
The Third Report continues to acknowledge that distinguishing expenditures consistent with the law from expenditures initiated or expanded because of it is difficult. It also explicitly states that it does not develop the alternative investment case showing what would have been required without the Climate Act. That missing comparison is fundamental. Replacing an aging transmission line is not necessarily a Climate Act cost, but increasing its capacity to accommodate mandated generation or electrification is. A defensible assessment must distinguish ordinary replacement from incremental policy requirements.
The Second Report’s primary message was that utility rate increases are inevitable because of aging infrastructure, so don’t blame the Climate Act. The Third Report also points to property taxes, reporting that they account for up to 22% of electric delivery bills compared with 8% for peer utilities nationally. That comparison does not show that additional climate program charges are affordable. Other costs do not make an additional mandate affordable.
Benefits Need the Same Scrutiny
The Third Report data clearly list emission reduction benefits. Table 3 reports cumulative avoided emissions of approximately 112.11 million metric tons of carbon dioxide equivalent during 2020 through 2025. Of that total, approximately 82.32 million metric tons, about 73%, are attributed to the nuclear Zero-Emission Credit program. That program was established before the Climate Act. Preserving existing nuclear generation is valuable, but these figures are not evidence that new wind, solar, and storage delivered most of the reductions.
The same table reports zero reductions through 2025 for offshore wind renewable energy credits and Tier 4 New York City renewable energy credits. Appendix B explains that those projects had not reached commercial operation and load-serving entities had not yet been billed for their costs. In other words, the most expensive components of the planned system are not yet on anyone’s bill.
The report also corrects previously reported emissions figures, which is welcome. However, the economic development and public health benefits it discusses remain largely unquantified, just as they were in the Second Report.
I maintain that it is appropriate to calculate the cost effectiveness of the CLCPA investments that are showing up in our bills. Table 3 lists the overall cumulative emission reductions from 2020 to 2025. Table 5 lists the 2025 Electric CLCPA Recoveries but Appendix C that claims to include historic cost recoveries does not include that data. Consequently, I can only estimate the cost effectiveness using the 2025 incremental emission reductions and the 2025. Table 5 finds that if all the programs and associated costs are included that one ton of reduction costs $123. The outsized costs associated with the Clean Energy Standard were noted before but note when considered by itself is it a more effective emission reduction strategy at $67 per ton. Without it, the cost effectiveness is $291 per ton reduced.
Table 5: 2025 Estimated Carbon Reduction Cost Effectiveness of CLCPA Investments

Affordability Still Needs a Standard
DPS describes expanded bill discount eligibility, enrollment efforts, credits, and the redirection of existing program funds. These measures help participating households, but assistance is not the same as demonstrating that the underlying transition is affordable. Expanding eligibility does not tell us how many households actually meet the PSC’s target energy burden of no more than 6% of household income. The Third Report does not provide that number.
Public Service Law §66-p(4) allows the Commission, after a hearing, to temporarily suspend or modify renewable program obligations if it finds that the program impedes safe and adequate service or that there is a significant increase in arrears or service disconnections related to the program. As I described in my January affordability post, the Independent Intervenors and the Coalition for Safe and Reliable Energy have petitioned for that hearing, and more than 1.3 million households were 60 or more days behind on their energy bills, owing over $1.8 billion. The Third Report should not be mistaken for a determination that resolves those petitions.
I believe future informational reports should provide:
- A transparent comparison with a reliable system without the additional mandates.
- Annual and cumulative customer costs, including commitments not yet collected.
- Forecasts that include the procurements needed to meet the targets, not just contracted projects.
- Household energy burdens and arrears trends, not simply program enrollment.
- Defined thresholds for corrective action.
Conclusion
The Third Informational Report improves on the Second Report: it arrived closer to schedule, discloses data corrections, and is candid about its attribution limits. However, it does not establish the total cost of implementing the Climate Act, it does not demonstrate that the complete transition is affordable, and it does not resolve the need for enforceable affordability standards.
The most telling admission is one that carries over from the Second Report. DPS acknowledges that the Legislature established the Climate Act’s objectives without allocating money or identifying a funding stream to achieve them, leaving utility rates as the principal funding mechanism available to the Commission. In my opinion, that gets to the heart of the problem. Ratepayers are funding the transition, the largest costs are not yet on their bills, and no one has defined how much is too much. Before New York commits customers to additional obligations, the State should establish what the complete program will cost, define what customers should reasonably afford, and what happens when those limits are exceeded. Calling current charges a small portion of the bill does not answer any of those questions.


