
In May, I posted articles describing the status of the Regional Greenhouse Gas Initiative (RGGI) and estimated the allowance bank could run out as early as 2032 because the cap trajectory cuts allowances by more than 10 percent of the 2025 budget each year from 2027 through 2033 despite the fact that the region has never sustained that level of emissions reductions. On October 6, 2026 RGGI announced that there would be additional allowance supply in Auction 74. This post updates my projection of when the allowances could run out to account for this additional allowance supply.
Dealing with the RGGI regulatory and political landscapes is challenging enough that affected entities seldom see value in speaking out about fundamental issues associated with the program. I have been involved in the RGGI program process since its inception and have no such restrictions when writing about the details of the RGGI program. I have worked on every cap-and-trade program affecting electric generating facilities in New York including RGGI, the Acid Rain Program, and several Nitrogen Oxide programs, since the inception of those programs. I also participated in RGGI Auction 41 successfully winning allowances and holding them for several years. The opinions expressed in this post do not reflect the position of any of my previous employers or any other organization I have been associated with. These comments are mine alone.
RGGI is a market-based program to reduce greenhouse gas emissions from the power sector. It has been a cooperative effort among Connecticut, Delaware, Maine, Maryland, Massachusetts, New Hampshire, New York, Rhode Island, and Vermont since 2008. New Jersey rejoined in 2020, and Virginia rejoined effective July 1, 2026.
According to the RGGI program description, the states issue permits to emit a ton of CO₂ or allowances that are distributed almost entirely through regional auctions, and the proceeds are then reinvested in strategic energy and consumer programs. Those investments include energy efficiency, clean and renewable energy, beneficial electrification, greenhouse gas abatement and climate adaptation, and direct bill assistance, with energy efficiency receiving the largest share.
RGGI Allowance Price Trend
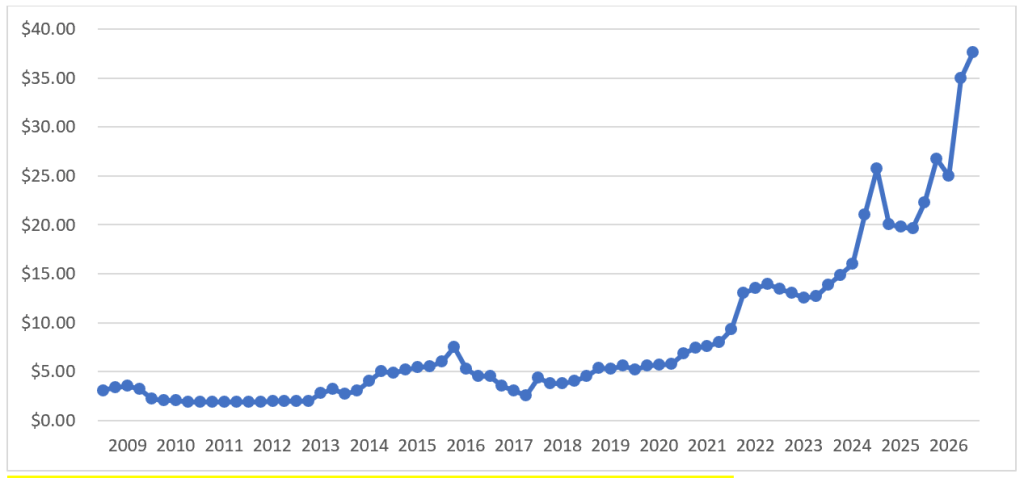
Figure 1 shows the clearing price of all RGGI auctions. In September 2021, the auction cleared at $9.30. Auction 73 in September 2026 cleared at $37.65, and all Cost Containment Reserve allowances were sold, so none will be available for Auction 74.
RGGI allowance costs are driven by basic economic considerations. When there is scarcity, prices increase; when there is uncertainty about scarcity, costs also go up. The difference is that price increases associated with uncertainty can drop when more information is available, whereas if the RGGI plans for reducing the emission cap are unrealistic that bakes in scarcity so prices will increase structurally. When RGGI announced that Virginia was going to rejoin the program there was a market price spike based on a lack of information.
Figure 1: RGGI Quarterly Allowance Auction Prices
RGGI Cap Trajectory
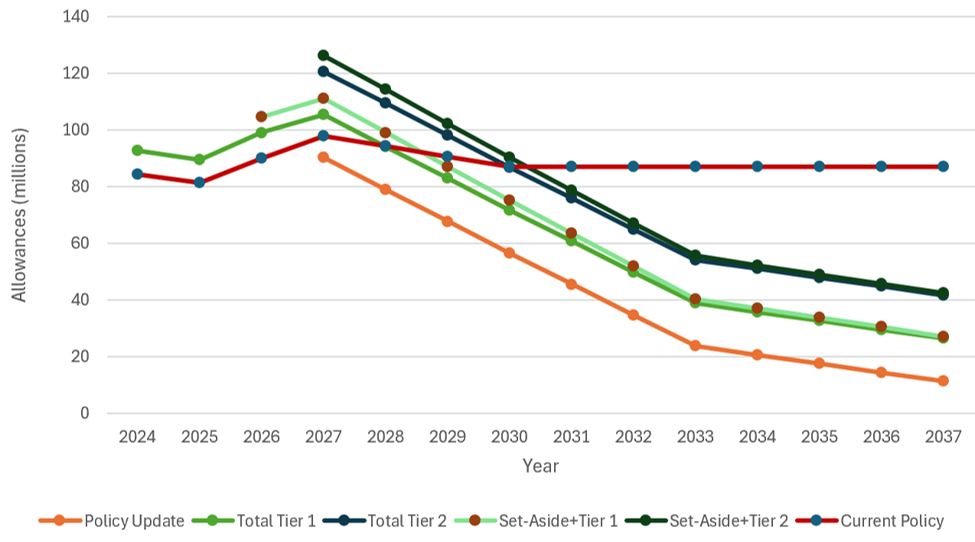
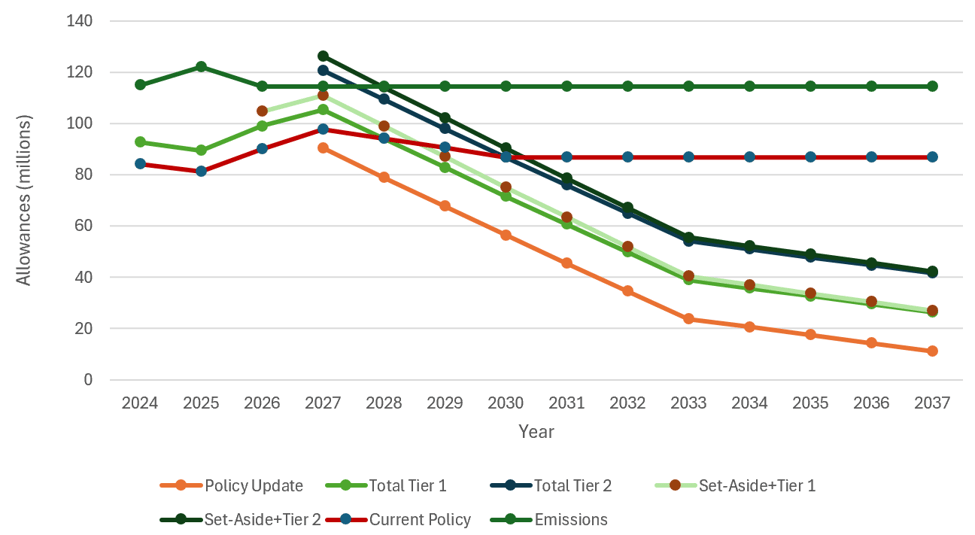
Figure 2 shows the allowance trajectories with two provisions intended to lower allowance costs. It displays the current allowance allocation policy (dark red) and last summer’s changes to the cap trajectory (orange). Note that this graph adds Virginia’s allowance allocation so allowances increase in 2026. There are two pairs of lines that display the total updated regional cap if all allowances are released from the updated first (green) and second (blue) Cost Containment Reserve (CCR) tiers, respectively. For RGGI Auction 74 it was announced that there would be additional allowance supply from some state set-aside accounts. Participating states identified approximately 3.5 million supplemental set-aside allowances for Auction 73 and another 2.2 million for Auction 74. The higher green and blue lines add those allowances. There is very little documentation for this addition of allowances so consider these numbers to be preliminary. The market monitor projects that approximately 4–6 million allowances will remain in state set-aside accounts after the March 1, 2027 compliance deadline. That remaining inventory could provide future supply, but the published regional information does not establish how much is legally available for immediate additional auctions, identify the contributing states and accounts, or describe how much might be available starting in 2027.
Figure 2: RGGI Allowance Auction Allocations
The RGGI emission cap trajectory was designed to be consistent with state net-zero targets. However, I believe that trajectory is unrealistic. Moreover, the addition of set-aside account allowances provides only limited relief from the projected supply shortfall.
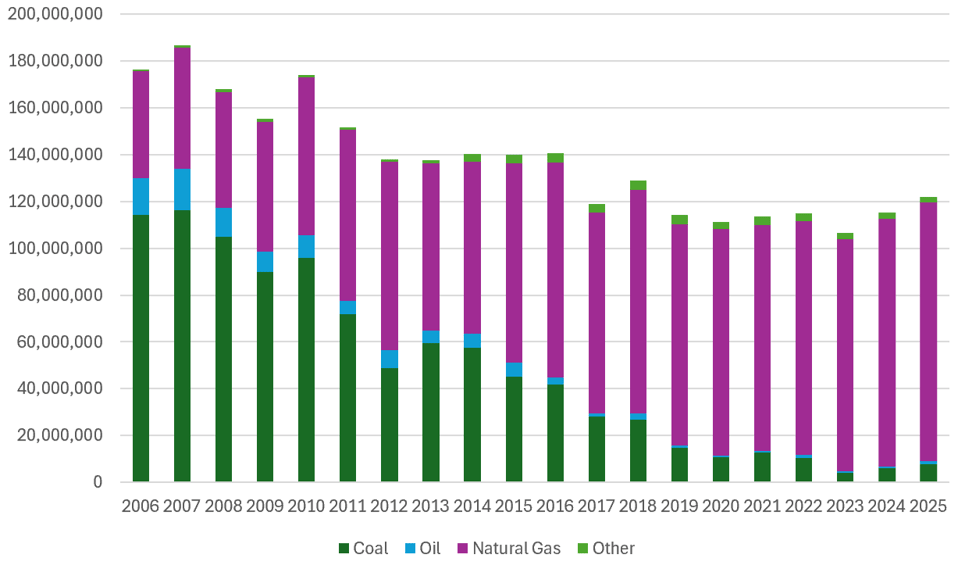
Figure 3 plots CO₂ emissions by fuel type across all eleven states from 2006 to 2025. The figure shows that fuel switching drove much of the reduction and that there are only minor opportunities for future fuel switching. When I analyzed the 2024 RGGI investment proceeds report, I estimated that only about 8.7% of observed emission reductions could be attributed to RGGI‑funded projects despite RGGI auction proceeds of over $4 billion since 2015. Changes to Federal policy, supply chain issues, and inflation coupled with load growth all indicate that reductions from other programs are unlikely as well. The cap trajectory is simply incompatible with reality.
Figure 3: Eleven State RGGI CO₂ Emissions (short tons) for all Programs 2006–2025
To determine when the allowances will run out it is necessary to consider emissions and the allowance trajectory. For this analysis I assume that future emissions equal the average of the last three years. I use constant emissions as a planning scenario because I do not see evidence that fuel switching, RGGI-funded investments, and the expected deployment of replacement resources will deliver reductions at the rate required by the revised cap. In Figure 4, I plot the updated cap trajectory (orange), total updated regional cap if all allowances are released from CCR Tier 1 (purple), CCR Tier 2 (green), and set-aside allowances are released, and emissions in grey stay the same. I assume that allowance prices will exceed the trigger for the CCR allowance release every year. Note that all the allowance trajectories are less than constant emissions.
Figure 4: RGGI Emissions and Cap Trajectories for RGGI States
Allowance Bank
Comparing the allowance allocations to the emissions does not consider the allowances already in the system. The “allowance bank” is the aggregate number of allowances in circulation that have been issued but not yet surrendered for compliance (i.e., held in accounts or set‑asides). The original distribution of RGGI allowances was before the fracking revolution made natural gas a cost-effective substitute for replacing oil and coal generating units. When power plants switched to lower-emitting natural gas, much larger reductions in emissions than expected occurred and the allowance bank grew so large that the RGGI States implemented several adjustments to the allowances allocated to reduce the bank. These adjustments ended in 2025.
To refine when emissions could exceed the allowances available it is necessary to account for the allowance bank. RGGI does not routinely provide a report that describes the status of the allowance bank, so I have been keeping track on my own. In August 2026 Potomac Economics, the market monitoring contractor, published Report on the Supply and Demand For RGGI CO2 Allowances: Second Quarter 2026 that updates the supply and demand status for RGGI allowances in the sixth control period, which runs from 2024 to 2026. The report documents the shrinking near-term allowance cushion that underlies my concerns, although it does not evaluate my longer-term exhaustion projection. The following sections detail the status of the allowance bank and project when the bank could run out.
Quarterly Allowance Status
The allowance bank is simply the difference between allowances being added and emissions that subtract allowances. Allowance transactions occur on a quarterly basis. Allowances are added at each auction and are surrendered during the annual true-up when allowances to account for emissions occurs.
Emissions reduce the allowance bank. Historical quarterly emissions are available on the RGGI COATS platform. Table 1 lists historical and projected CO2 emissions by state starting in quarter 4 2021 and ending in 2029. Historical emissions are not highlighted. Starting in the fourth quarter of 2026 I assumed that emissions would equal the average of the three years when Virginia was part of RGGI. This is supported by Figure 3 that shows emissions have been relatively level since 2019 for the eleven states now in RGGI. The annual emissions are simply the sum of the four quarters.
Table 1: RGGI Quarterly CO2 Mass Emissions (short tons)
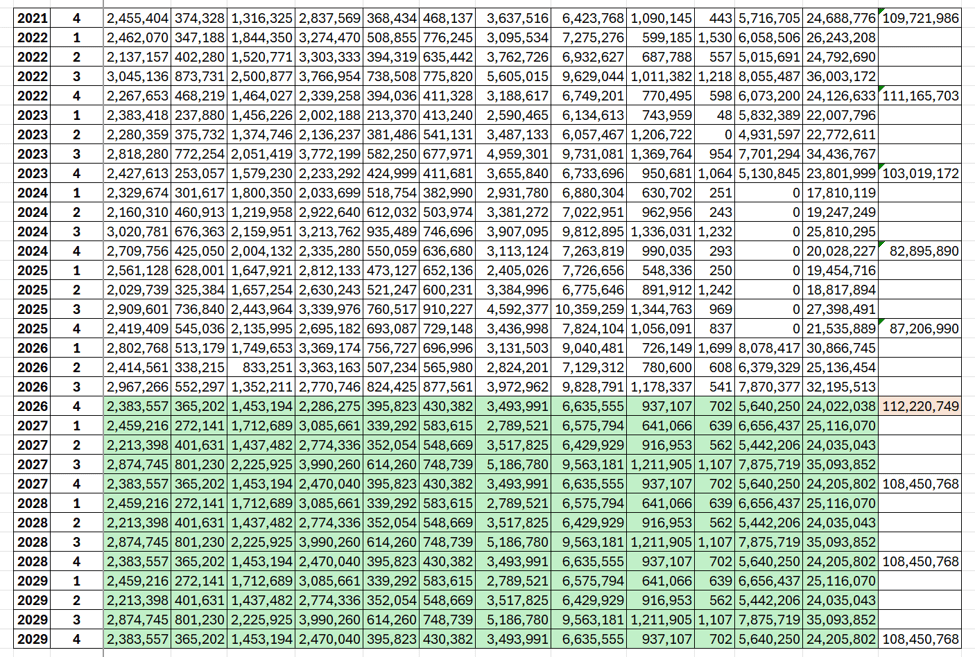
Figure 3 showed that all the allowance trajectories are less than expected future emissions so compliance entities must rely on the allowance bank for compliance. The purpose of this analysis is to determine when the allowances in circulation are less than the emissions. Figure 5plots the quarterly emissions (green), allowance cap (dark blue), added allowances (light blue) and allowance balance (orange). This analysis assumes that emissions remain constant and shows that as the allowance cap is reduced the bank of allowances eventually is exhausted. A negative modeled balance means that cumulative emissions exceed the allowance supply assumed in this analysis. It identifies a potential compliance shortfall, not a precise date on which all affected generators would stop operating. Individual facilities could face allowance procurement problems earlier.
Figure 5: Quarterly RGGI Allowance Balance, Emissions and Allowance Cap
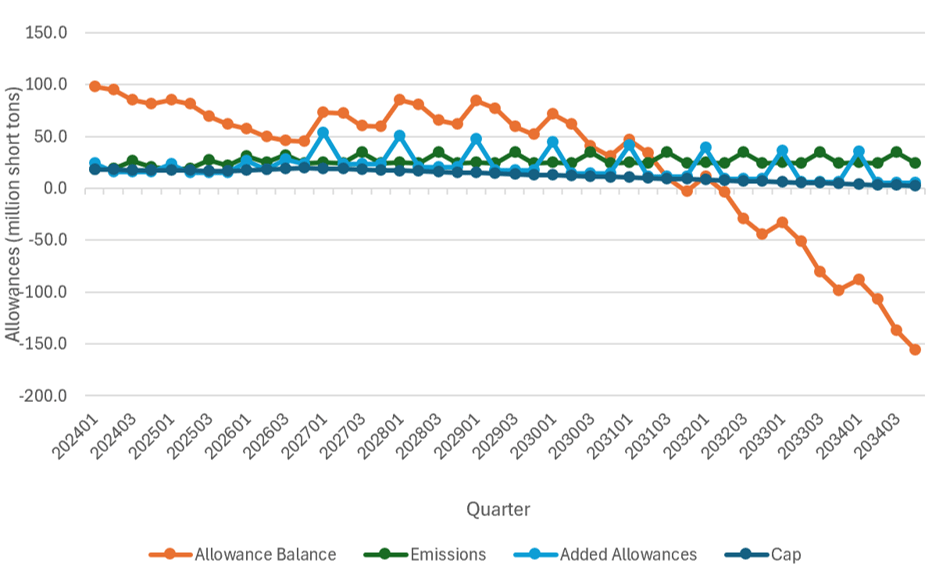
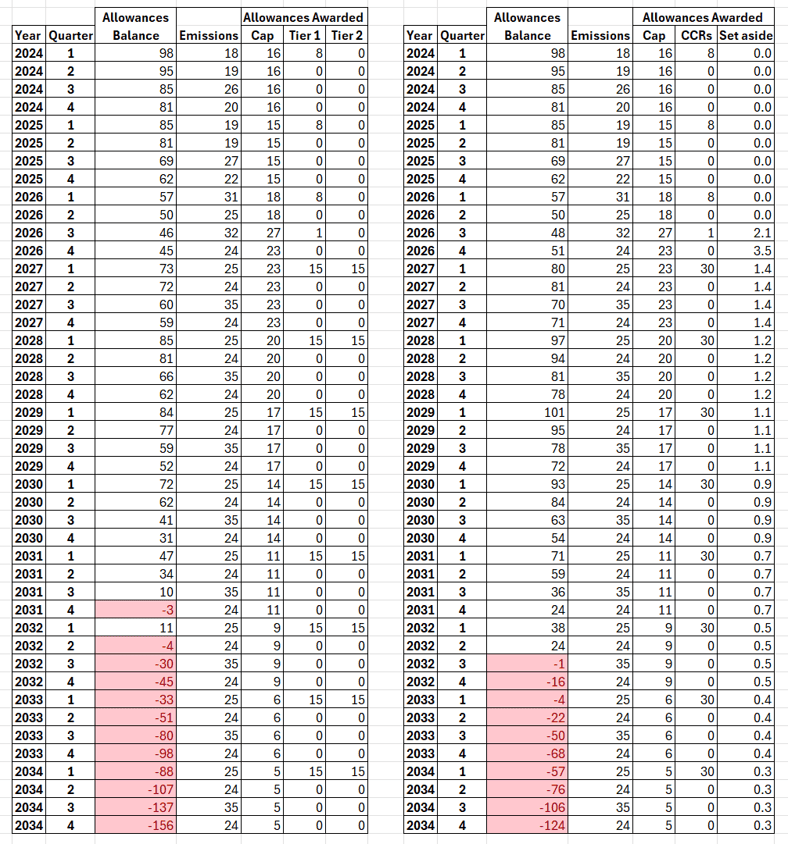
Table 2 lists the balance analysis tracks allowance supply and emissions quarterly with and without the use of set-aside allowances. Auctions add allowances to the modeled balance, and emissions are deducted in the quarter in which they occur. This is an analytical accounting convention, not a reconstruction of the timing of actual allowance surrender. Beginning in the fourth quarter of 2026, the projected emissions for each quarter equal the average emissions for the corresponding quarter in previous years.
Under the constant-emissions assumptions used here, the modeled allowance balance becomes negative in the fourth quarter of 2032 without additional set-aside releases. Including the set-aside releases assumed in this analysis delays that point until the third quarter of 2033. Note that RGGI has not documented future set-aside allocations. I distinguish between announced set-aside releases and a hypothetical release of additional state-held allowances. The latter is a sensitivity case, not a commitment by the participating states. The opening balance used in the set-aside sensitivity in Table 2 here includes]state-held set-aside allowances. Consequently, releases from those accounts are added as new supply to the modeled balance.
Table 2: Quarterly RGGI Allowance Balance, Added Allowances and Emissions Without Set-Aside Allowances and With Actual Q3 and Q4 2026 Set-Aside and Future Projected Set-Aside Allowances
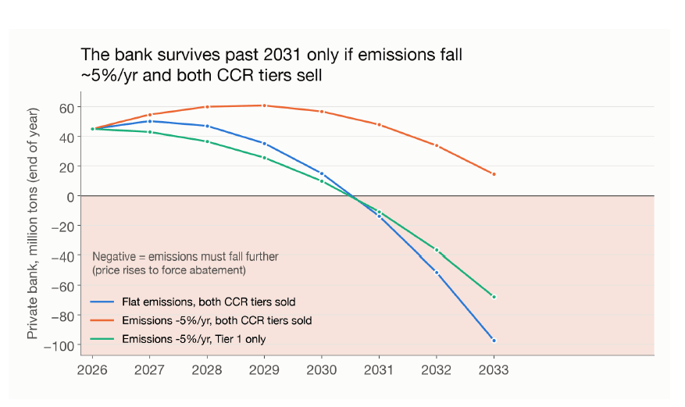
To sum up, RGGI allowances necessary for facilities to operate will run out unless something is done. I estimate it could occur in the third quarter of 2033 if emissions remain constant. In a presentation titled “Explaining the RGGI price path 2008–2026”, Dr. William Shobe found that the bank would run out earlier (Figure 6).
Figure 6: Excerpt from Slide July 2025: Virginia Rejoin and Program Review in Explaining the RGGI price path 2008–2026
Conclusion
The additional set-aside allowances provide temporary relief, but they do not resolve the mismatch between the revised cap trajectory and the emissions scenario evaluated here. Under my constant-emissions assumptions, the allowance bank is eventually exhausted even with the additional supply included in this analysis.
I use that scenario because the major historical opportunity for fuel switching has largely been realized, RGGI-funded investments have accounted for only a small share of observed emissions reductions in my analyses, and load growth adds to the challenge. The question is not whether emissions can decline at all, but whether they can decline quickly enough to match the allowance supply.
A binding cap does not create replacement generating resources or guarantee that they will be available when needed. If the required reductions do not materialize, affected generators face increasing allowance costs and, ultimately, a conflict between continued operation and compliance. Consumers can experience those costs well before the regional allowance balance is exhausted.
The participating states should reassess the cap trajectory and compliance provisions now, rather than rely on a shrinking allowance bank and limited set-aside releases to postpone the problem. The program’s requirements need to reflect the pace at which dependable replacement resources and verifiable emissions reductions can actually be delivered.


