Balancing the risks and benefits of environmental initiatives
Author: rogercaiazza
I am a meteorologist (BS and MS degrees), was certified as a consulting meteorologist and have worked in the air quality industry for over 40 years. I author two blogs. Environmental staff in any industry have to be pragmatic balancing risks and benefits and (https://pragmaticenvironmentalistofnewyork.blog/) reflects that outlook. The second blog addresses the New York State Reforming the Energy Vision initiative (https://reformingtheenergyvisioninconvenienttruths.wordpress.com). Any of my comments on the web or posts on my blogs are my opinion only. In no way do they reflect the position of any of my past employers or any company I was associated with.
I recently stumbled upon an old New York State Energy Research and Development Authority report describing the first New York industrial wind facility. This post compares the projections for the facility with the observed performance.
I have followed the Climate Leadership & Community Protection Act (Climate Act)since it was first proposed, submitted comments on the Climate Act implementation plan, and have written over 400 articles about New York’s net-zero transition. The opinions expressed in this article do not reflect the position of any of my previous employers or any other company I have been associated with, these comments are mine alone.
Overview
The Climate Act established a New York “Net Zero” target (85% reduction in GHG emissions and 15% offset of emissions) by 2050. It includes an interim 2030 reduction target of a 40% reduction by 2030 and a requirement that all electricity generated be “zero-emissions” by 2040. The Climate Action Council (CAC) was responsible for preparing the Scoping Plan that outlined how to “achieve the State’s bold clean energy and climate agenda.” In brief, that plan is to electrify everything possible using zero-emissions electricity. The Integration Analysis prepared by the New York State Energy Research and Development Authority (NYSERDA) and its consultants quantifies the impact of the electrification strategies. That material was used to develop the Draft Scoping Plan outline of strategies. After a year-long review, the Scoping Plan was finalized at the end of 2022. Since then State agencies and the legislature have been attempting to implement the plans.
The Madison Wind Farm is a power generation plant located in the town of Madison, New York. Constructed in 1999-2000, it was the first wind farm completed in New York state and the first merchant wind farm in the country. The power plant consists of seven Vestas V66-1.65 MW wind turbines,[1] generating enough energy to power up to 10,000 homes. The Vestas V66-1.65 MW wind turbines have a hub height of 67m and a 66m rotor diameter totally 100m to the top of the rotor
This report covers the development and operation of the Madison Windpower Project in Madison County, New York developed by PG&E Generating. The project began commercial operation in October 2000 and consists of seven Vestas V66-1.65 MW OptiSlip® wind turbines for a total capacity of 11.55 MW. Long term wind resource estimates predicted an annual hub-height average wind speed of 7.3 m/s. The net annual plant energy production was predicted to be 23,621 MWh, which would produce a capacity factor of 23.3%. The wind turbines were dispatched and controlled from the PG&E Pittsfield operations center, which was also responsible for substation maintenance. Vestas took charge of inspection, adjustment, and repair of the turbines (both scheduled and unscheduled) and established an operations and maintenance facility in the Madison area. The wind plant produced a total of 61,379 MWh of electricity for three years for an annual average of 20,460 MWh and an overall capacity factor of 21%. The capacity factor is lower than the expected value of 23.3% primarily due to lower than predicted wind speeds and turbine and grid outages.
Observed Operations
The New York Independent System Operator (NYISO) prepares a report describing load and capacity data for all New York generating units that participate in the electric market. Universally known s the “Gold Book” it is the best reference for New York electric generation data. The 2024 Load & Capacity Data Report presents load and capacity data for 2024 and future years. To prepare this summary of Madison Wind Farm operations I relied on a compilation of observed data from Gold Book reports dating back to 2006.
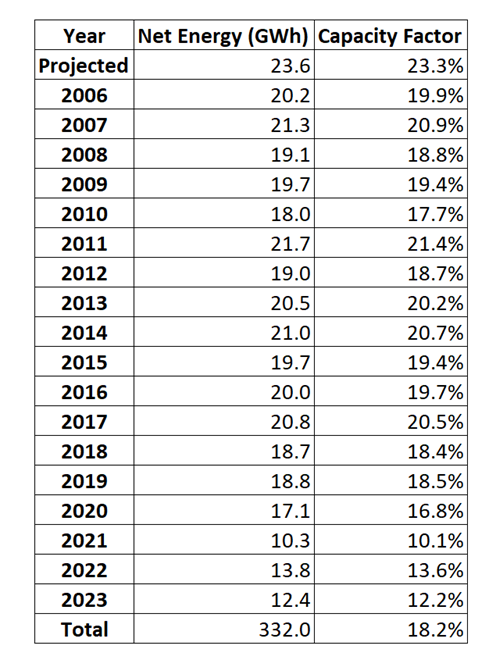
The following table lists the observed net energy (GWh) and capacity factors from 2006 to 2023 and the projections made in 2003 by AWS. In that analysis the observed capacity factor was 21% in the first three years. Since then, only one year achieved that level and the last three years the capacity factor was less than 14%. AWS projected that 425 GWh would be produced since 2006 but the energy produced by this facility was only 332 GWh, 22% less.
Table 1: Madison Wind Farm Performance Based on NYISO “Gold Book” Load & Capacity Data Report Table III-1 Including AWS 2003 Projections
The Conclusion of the AWS report summarizes the key findings:
The experience at Madison shows that the energy production from a wind facility is primarily dependent on the actual wind experienced and the performance and reliability of the turbines. The Vestas V66 turbines performed well when they were online because they produced the expected amount of energy for a given windspeed. However, the actual wind speeds experienced during the period and the reliability of the turbines were both lower than expected.
The wind speeds were lower than expected due to the incomplete meteorological record used to predict the wind resource, the lower-than-average wind speeds in this region of the state during plant operation, and the difference in elevation of the project met towers. This experience demonstrates the need to have sufficient long-term meteorological data in order to predict a wind plant’s energy production accurately. Continued evaluation of the projected wind speeds during plant operation can clarify trends and enhance understanding of the site’s wind resource. As such, it is expected that the overall wind resource at Madison will be more favorable during the lifetime of the plant.
The reliability of the machines was lower than expected due to the gearbox failures and other component difficulties discussed earlier in the report. These failures highlight the need for robust turbine reliability warrantees to protect turbine owners against loss of revenue in the case of such unexpected turbine component failures. On the positive side, excellent lightning protection in the V66 resulted in fewer outages due to static discharge than have been observed at other sites.
Discussion
As the first industrial wind facility Madison Wind Farm performance was evaluated in the AWS project. The report claims that it was a successful demonstration of large-scale wind development. I agree that it provides power and the information learned from it has been used to integrate other projects. However, I have concerns about the poor availability and decreasing capacity factors.
It was obvious at the time of the analysis that the projected capacity factor was lower than projected. The report argues that this was due to inadequate meteorological monitoring but optimistically notes the wind resource will be “more favorable during the lifetime of the plant”. That did not happen. The actual production since 2006 is 22% lower than they anticipated.
I think over-optimism is a characteristic of NYSERDA. The NYSERDA Integration Analysis projected a state-wide wind capacity factor of 29% in 2020 increasing to 34% in 2030. The Gold Book statewide capacity factor in 2020 was 23.9%. The Integration Analysis projected New York land-based wind in 2030 would generate 5,043 GWh but the actual production was only 4,162 GWh, 18% lower than they projected. In addition, the Integration Analysis did not acknowledge that as wind systems age their performance drops.
NYSERDA’s Integration Analysis quantified the generating resources that will be needed to meet the Climate Act mandates. However, comparison of observed and projected energy production shows that they have overestimated energy production which means that more wind capacity will have to be developed and that the costs will necessarily be higher than they projected. Unfortunately, there has not been any reconciliation between Integration Analysis projections and observations to refine their projections. This is in keeping with their complete lack of response to technical issues raised in comments on the Scoping Plan.
Conclusion
The performance of the first wind farm in New York is considerably less than projected. This is consistent with the observed and projected Integration Analysis 2020 statewide wind generation. These results should be used to refine the Scoping Plan but there is no indication that NYSERDA is considering such an effort. This is just one more example of the flaws hidden behind a veneer of political slogans that claim all is well with the Climate Act. Eventually it will become obvious that the Hochul Administration electric system “plan” is incompatible with reality. Unfortunately failing to address these issues promptly will increase costs and reliability risks
I have followed the Climate Leadership & Community Protection Act (Climate Act)since it was first proposed, submitted comments on the Climate Act implementation plan, and have written over 400 articles about New York’s net-zero transition. The opinions expressed in this article do not reflect the position of any of my previous employers or any other company I have been associated with, these comments are mine alone.
Power Trends
The New York Independent System Operator (NYISO) recently issued its Power Trends 2024
report which is billed as their “annual analysis of factors influencing New York State’s power grid and wholesale electricity Markets”. In the WUWT post I focused on the NYISO Summer 2024 Reliability Outlook chapter. I highlighted the particular concern for heat waves in the following:
For summer 2024, the NYISO expects 34,913 MW of resources available to meet 31,541 MW of forecasted demand under normal conditions. Under extreme summer weather conditions, however, forecasted reliability margins could potentially be deficient without reliance on emergency operating procedures. For example, if the state experiences a heatwave with an average daily temperature of 95 degrees lasting three or more days, demand is forecasted to rise to 33,301 MW, while predicted supply levels are reduced to 34,502 MW. When accounting for the required 2,620 MW of operating reserves that must be maintained, this scenario results in a forecasted reliability margin of -1,419 MW. That reliability margin declines further to -3,093 MW under an extreme heatwave with an average daily temperature of 98 degrees. Under these more extreme summer weather conditions, the NYISO forecasts an available supply of 34,317 MW to meet the required 2,620 MW of operating reserve requirements, plus a forecasted demand of 34,790 MW.
The intent of the article was to alert readers that the extreme summer weather conditions highlighted by NYISO could occur with the heat wave.
Observations
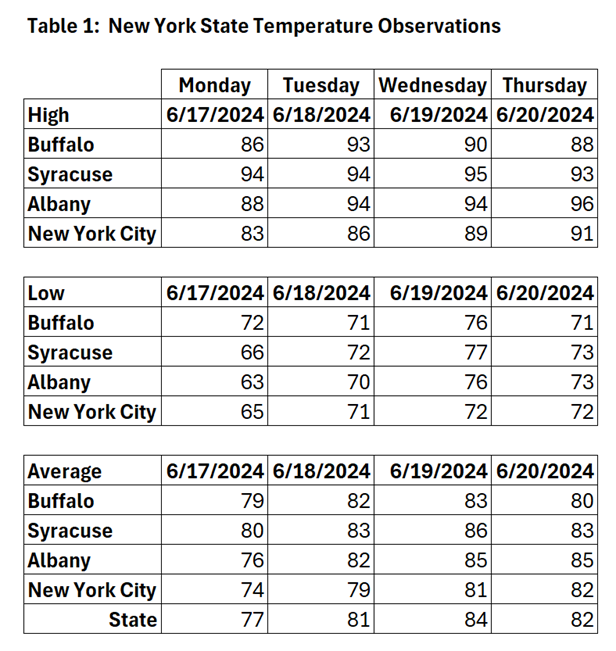
In brief, the June 2024 heatwave came nowhere near the potential deficit criteria. Table 1 shows that the average daily temperature did not exceed 84o F over the last four days. This was not a real stress test for the New York State electric grid.
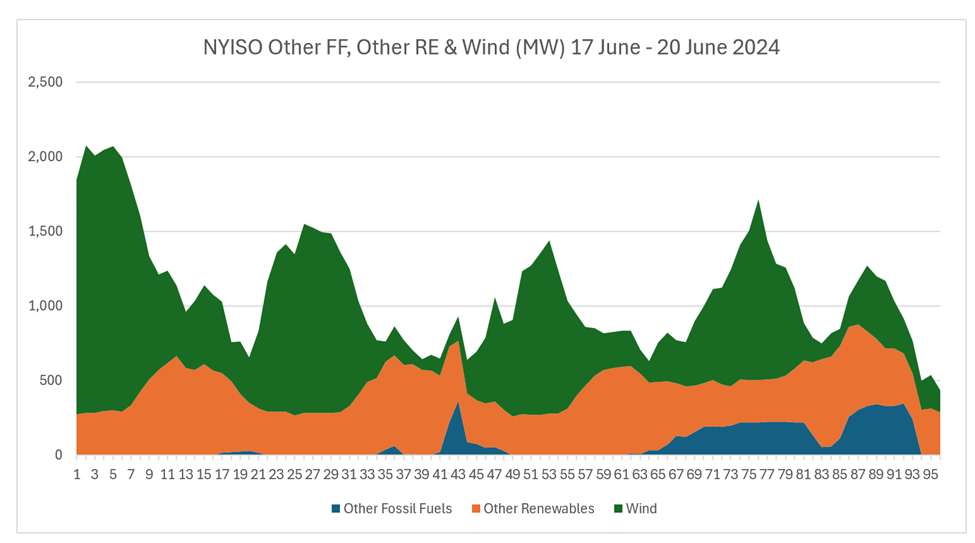
NYISO Fuel Mix
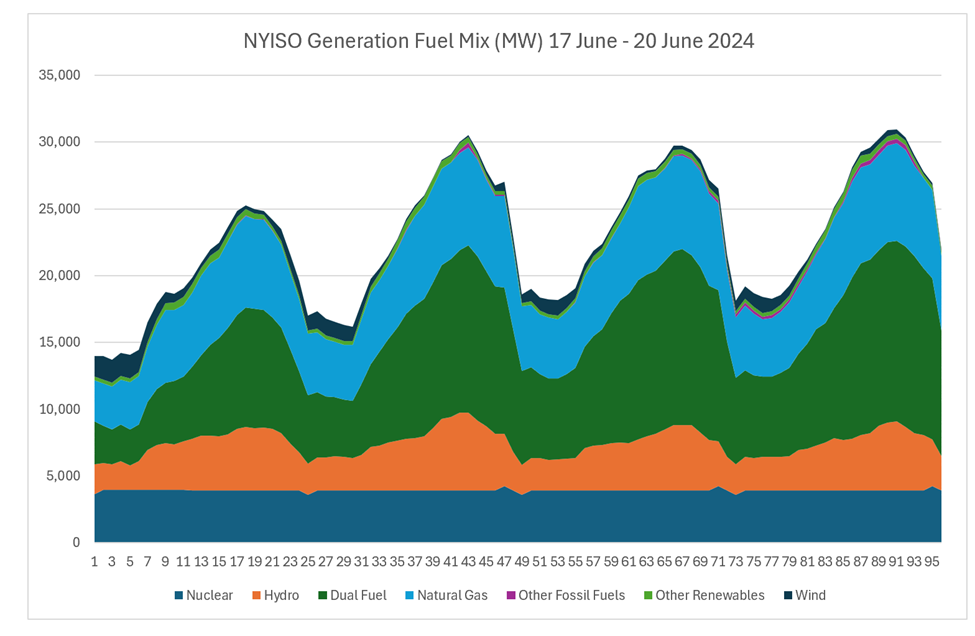
Even though the heat wave did not push the New York grid the fuel-mix load data from the NYISO Real-Time Dashboard provides some interesting information. I have compiled the data for 17-21 June here. The following graph shows the hourly fuel type generation throughout the period. The generator types include “Hydro” that includes pumped storage hydro; “Wind”, land-based wind; “Other Renewables” that covers solar energy, energy storage resources, methane, refuse, or wood; “Other Fossil Fuels” is oil; “Nuclear”; “Natural Gas”; and “Dual Fuel” which are units that burn both natural gas and oil.
The NYISO Summer 2024 Reliability Outlook expects 34,913 MW of resources available to meet 31,541 MW of forecasted demand under normal conditions. During this period, the maximum hourly generation was 30,525 MW at hour 18 on June 18. There are important considerations relative to the fuel mix at that time.
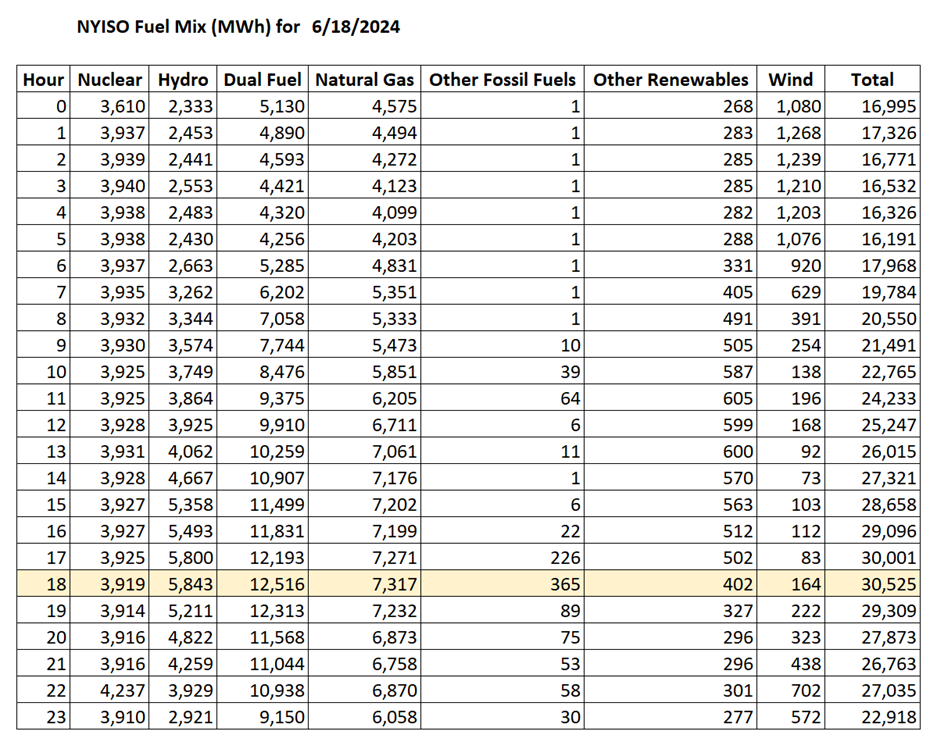
The following table lists the fuel mix for generating facilities in New York for June 18. NYISO does not track behind-the-meter solar that reduces the load that NYISO must provide. Note that nuclear is constant throughout the day and hydro, dual-fuel, and natural gas increases to match the load peak.
The remaining three categories are of particular interest. The following graph only includes these three categories because they are small relative to the other fuel types.
In the “Other Renewables” categories the Gold Book lists the following capabilities at the end of 2023: utility-scale solar energy 254 MW, energy storage resources 20 MW, methane 104 MW, refuse 239 MW, and wood 56 MW for a total of 653 MW. The graph suggests that solar was providing its peak load during each day. The methane, refuse, and wood generators are dispatched so that they reduce load at night to a little under 300 MW.
One of the notable features during this period was that the wind resource consistently was lowest during the daily peak load. Despite this result New York is continuing to double down on renewable development. On June 20 the New York State Energy Research & Development Authority announced:
Governor Hochul today announced a new NYSERDA large-scale renewable energy solicitation to deliver clean electricity to New Yorkers. Building on New York’s 10-Point Action Plan , this solicitation seeks proposals for the development of new large-scale land-based renewable energy projects which are expected to spur billions in clean energy investments and create thousands of family-sustaining jobs in the State’s green economy.
Given that when needed most during the peak load observed here that all the New York land-based wind went to very low levels this solicitation will not solve this problem. Higher wind capacity with zero wind resource yields zero electricity.
There is another notable feature of the observed wind resources. The peak winds occurred in the early morning hours which are the lowest load periods. I believe this is a feature of the nocturnal wind pattern. Low-level winds affecting wind turbines increase with height as the effect of surface roughness and atmospheric mixing are reduced. At night the solar surface heating stops and the level of reduced wind speed contracts. This causes the wind speeds to increase and wind energy resources to improve. It also is another load balancing issue that must be addressed for an electric grid that depends on wind power generation.
The last of these three categories illustrates another related issue. The category “Other Fossil Fuels” provides generation for units that are exclusively oil-firing. In New York there are two types of these units – residual oil-fired steam boilers and simple-cycle peaking turbines. All the oil-fired boilers must remain at minimum loads higher than the lowest hourly values listed above to be able to ramp up for the diurnal peak. Therefore, the generation came from simple-cycle peaking turbines. As I have previously explained, New York City peaking turbines are vilified as “the most egregious energy-related example of what environmental injustice means today.” However, the presumption of egregious harm is based on selective choice of metrics, poor understanding of air quality health impacts, and ignorance of air quality trends. I wish I could say that there is no chance that these units will not be shutdown sooner than necessary to mollify Environmental Justice activists who demand it, but I am unconvinced.
Discussion
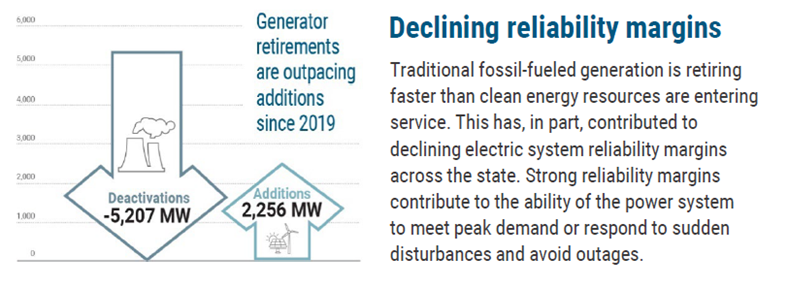
I am not optimistic that New York State energy policy will be up to the task addressing the future system resources challenge for a zero-emissions electric grid. One of the issues highlighted by the NYISO Power Trends report is illustrated in the following figure from the Power Trends Fact Sheet.
Overall, the capacity reduction from generator retirements relative to additions is 57%. However, if you compare the energy capability of the deactivated generators, especially the 2,000 MW of nuclear power retired, with the addition of primarily solar and wind capacity the energy available to the system is even less.
One other recent development is relevant. The owners of the Danskammer power plant north of New York City have had an application to repower and replace the existing Danskammer generating station with the Danskammer Energy Center, a new state-of-the art, efficient natural gas-fired combined cycle generating unit. Unfortunately, like a couple of other proposals to replace old fossil generating units with much cleaner and modern units, the New York State Department of Environmental Conservation has denied the permits to construct basically because there are Climate Leadership & Community Protection Act mandates coming. The fact that there is no feasibility analysis that proves that those mandates can be achieved was ignored. After years of court battles the developers gave up and withdrew their application this week. As a result, the electric system will continue to rely on aging and dirtier fossil generation for however long it takes for the State to figure out that existing technology is incapable of replacing fossil fired peaking power plants needed to keep the lights on.
Conclusion
The latest heat wave in New York State did not exceed the criteria determined by the NYISO for potential problems. Nonetheless, the facts that wind resources were a fraction of potential capacity during the peak hours and the grid relied on peaking power plants that environmental activists demand be shut down as soon as possible suggest that the potential problem is not going to go away anytime soon. Stay tuned.
Yesterday, I published an article that summarizes comments I submitted to the New York Department of Environmental Conservation (DEC) in response to a request for feedback. After I published the article, I received an answer to a question I asked EPA about the calculation methodology used by DEC and that inspired me to reiterate my contention that New York’s application of the societal benefits of greenhouse gas emission reductions results in misinformation.
I have followed the Climate Leadership & Community Protection Act (Climate Act)since it was first proposed, submitted comments on the Climate Act implementation plan, and have written over 400 articles about New York’s net-zero transitionThe opinions expressed in this article do not reflect the position of any of my previous employers or any other company I have been associated with, these comments are mine alone.
Overview
The Climate Act established a New York “Net Zero” target (85% reduction in GHG emissions and 15% offset of emissions) by 2050. It includes an interim 2030 reduction target of a 40% reduction by 2030 and a requirement that all electricity generated be “zero-emissions” by 2040. The Climate Action Council (CAC) was responsible for preparing the Scoping Plan that outlined how to “achieve the State’s bold clean energy and climate agenda.” In brief, that plan is to electrify everything possible using zero-emissions electricity. The Integration Analysis prepared by the New York State Energy Research and Development Authority (NYSERDA) and its consultants quantifies the impact of the electrification strategies. That material was used to develop the Draft Scoping Plan outline of strategies. After a year-long review, the Scoping Plan was finalized at the end of 2022. Since then, there have been regulatory and legislative initiatives to implement the recommendations, but progress has been slow.
Yesterday’s post included extensive documentation for the New York Value of Carbon so I will not repeat it here. For this article the key point is that the DEC Climate Change Guidance Documents webpage notes that it was established for use by State entities to “aid decision-making and for the State to demonstrate the global societal value of actions to reduce greenhouse gas emissions in line with the requirements of the Climate Leadership and Community Protection Act.”
Methodology Comment
Yesterday’s article described my submitted comment on the Value of Carbon methodology. In short, I am convinced that the State calculation methodology is incorrect. I believe that the guidance methodology is wrong because it applies the social cost multiple times for each ton reduced.
Last weekend I reviewed the EPA webpage description of the ““Report on the Social Cost of Greenhouse Gases: Estimates Incorporating Recent Scientific Advances”. That page includes links to the following information:
I reviewed the Final Report and thought that their description of the proper benefit calculation methodology supported my arguments. That webpage also includes a “Contact Us” form for questions. To confirm my interpretation I submitted the following to EPA.
I have a question about the first two sentences in the first paragraph in Section 4.2 of the Final Report.
The sentences say: “The Social Cost of Greenhouse Gases (SC-GHG) reflects the future stream of damages associated with an additional ton of emissions discounted back to the year of the emissions. Several steps are necessary when using the SC-GHG estimates in an analysis that includes GHG emissions changes in multiple future years in addition to other benefits and costs.”
I interpret that to mean that the SC-GHG benefit value is applied for an additional ton of emission reductions once. If you are looking at changes over multiple years, the first-year reductions are not applied cumulatively in multiple future years.
Is that the correct interpretation?
I received the following response from Elizabeth Kopits, PhD, Economist, National Center for Environmental Economics, Office of Policy, U.S. EPA:
Thank you for reaching out to our office with your question regarding EPA’s SC-GHG estimates.
The sentences you refer to are just intending to say that if you are analyzing a policy that is expected to result in emission reductions (or increases) in multiple years, then there are several steps to estimating the present value of the full stream of climate benefits (or disbenefits) that are expected from the emissions changes.
If I’m understanding your question correctly then I think the answer is yes.
For example, suppose it has been estimated that a policy will reduce CO2 emissions by 100 tons in 2025, 105 tons in 2026, and 110 tons in 2027, and the analyst is interested in calculating the total climate benefits from these emission reductions and comparing it to the estimated costs and other benefits of the policy. First, one would calculate the climate benefits in each year.
That is, the climate benefits in 2025 from the emission reductions expected in 2025 = 100 tons multiplied by the SC-CO2 for 2025 ($/t). (Recall this SC-CO2 value reflects the present value of the future stream of avoided damages from a one-ton reduction in 2025, so there is nothing more to calculate in 2026 and later related to the emission reductions that occurred in 2025.) Similarly, the climate benefits in 2026 from the emission reductions expected in 2026 = 105 x SC-CO2 in 2026, and the climate benefits in 2027 from the emission reductions expected in 2027 = 110 x SC-CO2 in 2027.
Finally, one can calculate the present value of the benefits resulting from the full stream of emission changes from the perspective of the base year of analysis (e.g., 2024) by discounting the 3 numbers back to 2024 and summing.
I hope this helps to clarify a bit. The SC-GHG workbook available on our webpage (https://www.epa.gov/environmental-economics/scghg) contains detailed instructions and example tabs that may be more helpful than my simple example above. If you continue to have questions, please feel free to reach out any time.
I believe that the key is the “SC-CO2 value reflects the present value of the future stream of avoided damages from a one-ton reduction in 2025, so there is nothing more to calculate in 2026 and later related to the emission reductions that occurred in 2025”. If the intent is to determine “the present value of the full stream of climate benefits (or disbenefits) that are expected from the emissions changes, then lifetime calculations are inappropriate. I want to know the value of the climate benefits for New York to reach an 85% reduction of GHG emissions by 2050.
Discussion
The New York Value of Carbon regulatory policy enables the State to “demonstrate the global societal value of actions to reduce greenhouse gas emissions”. New York’s climate policy making is nearly all political theater. To justify the costs of the Climate Act, the political slogan is “the costs of inaction are more than the costs of action”. To make that claim NYSERDA twisted the interpretation of the analyses to minimize the overall costs, biased costs low and benefits high, and, I have no doubt, influenced the Value of Carbon methodology to maximize benefits.
Yesterday’s post also included related correspondence with DEC staff responding to my interpretation. It stated that “We ultimately decided to stay with the recommendation of applying the Value of Carbon as described in the guidance as that is consistent with how it is applied in benefit-cost analyses at the state and federal level.” Dr Kopits response letter flatly contradicts the claim relative to the Federal level. To give the benefit of doubt to DEC staff I will concede that the interpretation of what is appropriate for this benefit-cost analysis may be different. However, I think that New Yorkers deserve clarification and ultimately get the total costs for the Climate Act mandated reductions.
The DEC response went on to say that “When applying the Value of Carbon, we are not looking at the lifetime benefits rather, we are looking at it in the context of the time frame for a proposed policy in comparison to a baseline.” Finally, it noted that “The integration analysis will apply the Value of Carbon in a similar manner as it compares the policies under consideration in comparison with a baseline of no-action.” This is where the interpretation of the policies under consideration were twisted. In brief, the Hochul narrative that the costs of inaction are more than the costs of action only applies to Climate Act policies and not the total costs to achieve the Climate Act mandates. The baseline of “no-action” described in the Scoping Plan as “Business as usual plus implemented policies” includes the following programs:
Growth in housing units, population, commercial square footage, and GDP
Federal appliance standards
Economic fuel switching
New York State bioheat mandate
Estimate of New Efficiency, New York Energy Efficiency achieved by funded programs: HCR+NYPA, DPS (IOUs), LIPA, NYSERDA CEF (assumes market transformation maintains level of efficiency and electrification post-2025)
Funded building electrification (4% HP stock share by 2030)
Corporate Average Fuel Economy (CAFE) standards
Zero-emission vehicle mandate (8% LDV ZEV stock share by 2030)
Clean Energy Standard (70×30), including technology carveouts: (6 GW of behind-the-meter solar by 2025, 3 GW of battery storage by 2030, 9 GW of offshore wind by 2035, 1.25 GW of Tier 4 renewables by 2030)
That means that the costs of all these programs that are required to meet the Climate Act mandate of an 85% reduction in emissions by 2050 are not included in the evaluation. Due to the lack of transparent cost and benefit estimates I cannot determine if the NYSERDA Integration Analysis excluded the benefits associated with those programs. However, it would be another way to achieve the goal of a sound bite justification of benefits and costs.
Conclusion
New York’s climate policy making is nearly all political theater. The shenanigans that the Scoping Plan authors used to make sure they could claim benefits were greater than costs and hiding their methodology and results is a long, disappointing story. The Value of Carbon methodology is dictated by the desire to prove a point rather than provide any rigor in establishing its definition and level. Given the necessity to maximize benefits to “prove” the costs of inaction are more than the cost of action and the lack of accountability to meaningfully respond to all stakeholders, ignoring my comments is a simply expedient.
I believe the ultimate question is “What are the benefits of New York’s 85% emission reductions mandated by the Climate Act?” To answer that the value of carbon or social cost of carbon benefits should use the EPA methodology. I believe that benefit is what all New Yorkers want to know and the Hochul Administration is deliberately covering up those numbers because it runs contrary to their narrative.
This post summarizes comments I submitted to the New York Department of Environmental Conservation (DEC) in response to a request for feedback on “additional updates to the guidance to align methodologies with recent updates from the U.S. Environmental Protection Agency.”
I have followed the Climate Leadership & Community Protection Act (Climate Act)since it was first proposed, submitted comments on the Climate Act implementation plan, and have written over 400 articles about New York’s net-zero transitionThe opinions expressed in this article do not reflect the position of any of my previous employers or any other company I have been associated with, these comments are mine alone.
Overview
The Climate Act established a New York “Net Zero” target (85% reduction in GHG emissions and 15% offset of emissions) by 2050. It includes an interim 2030 reduction target of a 40% reduction by 2030 and a requirement that all electricity generated be “zero-emissions” by 2040. The Climate Action Council (CAC) was responsible for preparing the Scoping Plan that outlined how to “achieve the State’s bold clean energy and climate agenda.” In brief, that plan is to electrify everything possible using zero-emissions electricity. The Integration Analysis prepared by the New York State Energy Research and Development Authority (NYSERDA) and its consultants quantifies the impact of the electrification strategies. That material was used to develop the Draft Scoping Plan outline of strategies. After a year-long review, the Scoping Plan was finalized at the end of 2022. Since then, there have been regulatory and legislative initiatives to implement the recommendations, but progress has been slow.
The value of carbon requirement was one of the first initiatives. Four years ago, I published an article on section § 75-0113 of the Climate Act. That section explicitly mandates how the value of carbon will be determined:
No later than one year after the effective date of this article, the department, in consultation with the New York state energy research and development authority, shall establish a social cost of carbon for use by state agencies, expressed in terms of dollars per ton of carbon dioxide equivalent.
The social cost of carbon shall serve as a monetary estimate of the value of not emitting a ton of greenhouse gas emissions. As determined by the department, the social cost of carbon may be based on marginal greenhouse gas abatement costs or on the global economic, environmental, and social impacts of emitting a marginal ton of greenhouse gas emissions into the atmosphere, utilizing a range of appropriate discount rates, including a rate of zero.
In developing the social cost of carbon, the department shall consider prior or existing estimates of the social cost of carbon issued or adopted by the federal government, appropriate international bodies, or other appropriate and reputable scientific organizations.
The DEC published the calculation methodology as mandated and has since updated New York’s Value of Carbon Guidance. The DEC Climate Change Guidance Documents webpage notes that it was established for use by State entities to “aid decision-making and for the State to demonstrate the global societal value of actions to reduce greenhouse gas emissions in line with the requirements of the Climate Leadership and Community Protection Act.” It includes an Appendix that provides social cost values for the greenhouse gases incorporated into the Climate Act. Also note that the documents include a report by the New York State Energy Research & Development Authority (NYSERDA) and Resources for the Future that was used to determine the values used.
Comment Process
The bottom line is that the DEC goes through the motions for the comment process. I pretend that someone will listen when I comment, the agencies pretend to appreciate my comments but inevitably go on to do whatever fits the political narrative, and, in most cases, I never hear anything about my comments. There is a requirement that requires DEC to respond to comments for proposed regulations so at least I get some feedback. It is not clear to me whether this request for feedback requires responses to comments received. When the original draft guidance was proposed DEC went through the regulatory process which included a formal comment period and required them to respond to comments. I described my November 2020 comments in a post and followed up with commentary on their response to my in January 2021.
As frustrated as I am with the DEC stakeholder process it is orders of magnitude better than the NYSERDA stakeholder process. Even when responses are not required, DEC staff acknowledges followup questions and sometimes answers them. I believe that they are also subject to intense political pressure to maintain the Administration’s narrative on all things climate-related. NYSERDA’s stakeholder process for the Scoping Plan consisted of a list of comments received and a heavily condensed and biased summary of the comments received. They consistently refuse to answer questions about technical issues or the resolution of comments received. I appreciate DEC staff for being open to discussion and condemn NYSERDA for ignoring stakeholders that do not agree with the political narrative.
Social Cost of Carbon Comment
Given the unlikelihood of any changes based on my comments, I did not spend a lot of time developing comments. Moreover, the request for feedback regarded using new information from EPA. Any attempt to argue that EPA got it wrong after EPA went through a similar process would have no chance of success.
Nonetheless I took the opportunity to argue that the societal value of greenhouse gas emission reductions approach is not in the public consciousness. I stated:
The Request for Feedback notes that “the new approach to discounting addresses public concerns regarding intergenerational equity.” For the record I have two issues with these concerns. I do not believe that the public raised concerns about intergenerational equity. Instead, that concern was raised by climate activists and non-governmental organizations whose monomaniacal focus on the alleged existential threat of climate change disregards any tradeoffs between costs, reliability, and environmental impacts of their favored solutions and the contrived benefits they claim. The second issue is that the public is unaware of these contrived calculations. If they were aware that New York’s Value of Carbon calculations project alleged impacts out to 2300, I am sure that they would wonder about the impacts today relative to those ten generations in the future. They would not look kindly at the hubris involved with claims that we can predict or even imagine what the world would like 275 years in the future. Moreover, Bjorn Lomborg notes in his 2020 book False Alarm – How Climate Change Panic Costs Us Trillions, Hurts the Poor, and Fails to Fix the Planet (Basic Books, New York, NY ISBN 978-1-5416-4746-6, 305pp.) that the costs of global warming will only reach 2.6% of GDP by 2100 but that global GDP will be so much higher at that time that this number is insignificant.
A recent article by Alex Trembath gives another take about why this metric is troubling. In response to his views about the social cost of carbon he did not want to disregard it entirely but said:
fundamentally, impossible. And it’s not just the fat tails of climate risk distribution, the controversies about the discount rate, or the other long-standing hurdles to a more robust SCC consensus. It’s that climate change is a slow-moving and massively complex global threat. We simply have no access to essential information, such as the size of the global economy decades from now and its resilience to climate impacts or even the exact sensitivity of the climate to emissions, that would inform a robust cost-benefit analysis.
Substantive Comment
I only made one substantive comment on the Value of Carbon methodology. I make this comment every chance I get and so far, have not been able to get a change. In short, I am convinced that the State calculation methodology is incorrect.
My comment addresses the “Estimating the emission reduction benefits of a plan or goal” section in the 2023 version of the Value of Carbon Guideline that states:
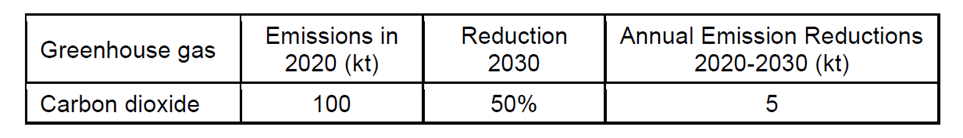
Estimating the emission reduction benefits of a plan or goal. An agency has developed a strategic plan with the goal of reducing carbon dioxide emissions 50% over ten years from current levels, or 50,000 metric tons over 10 years. In order to determine the benefits to society in terms of avoided damages, the agency will need to determine the annual level of emission reductions (or emissions avoided) compared to a no action scenario. If split evenly across all 10 years, the annual reduction is 5,000 metric tons per year (see table).
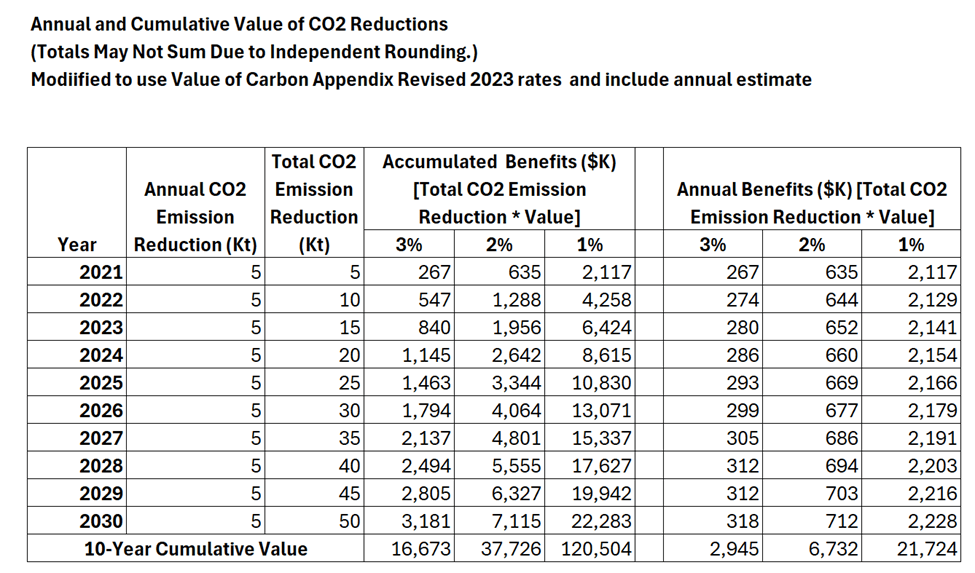
The net present value of the plan is equal to the cumulative benefit of the emission reductions that happened each year (adjusted for the discount rate). In other words, the value of carbon is applied to each year, based on the reduction from the no action case, 100,000 tons in this case. The Appendix provides the value of carbon for each year. For example, the social cost of carbon dioxide in 2021 at a 2% discount rate is $123 per metric ton. The value of the reductions in 2021 are equal to $123 times 5,000 metric tons, or $615,000; in 2022 $124 times 10,000 tons, etc. This calculation would be carried out for each year and for each discount rate of interest. The results for all three recommended discount rates are provided below. [The table below modifies the Guidance document with updated values of carbon and the correct annual benefits.]
My comments noted that the Climate Act mandates an 85% reduction in greenhouse gas emissions from 1990 levels by 2050. I believe that New York’s Value of Carbon should be applied in the context of the reduction of greenhouse gas emissions necessary to meet that goal. In particular, the reduction in annual emissions year to year. In this context, I believe that the guidance approach is wrong because it applies the social cost multiple times for each ton reduced. It is inappropriate to claim the benefits of an annual reduction of a ton of greenhouse gas over any lifetime or to compare it with avoided emissions. As shown above, the Value of Carbon methodology sums project benefits for every year for some unspecified lifetime subsequent to the year the reductions. The value of carbon for an emission reduction is based on all the damages that occur from the year that ton of carbon is reduced out to 2300. Clearly, using cumulative values for this parameter is incorrect because it counts those values over and over. I contact social cost of carbon expert Dr. Richard Tol about my interpretaton of the lifetime savings approach and he confirmed that “The SCC should not be compared to life-time savings or life-time costs (unless the project life is one year)”.
The preceding table calculates the benefits of the example project correctly. Note that if done correctly that the projected benefits are at least 5.5 times less than the in the flawed Value of Carbon methodology.
As mentioned before, although I am frustrated by the DEC stakeholder process, I did manage to get DEC staff to define their position on this topic. As I described in another article, I wrote to DEC and Climate Action Council about this problem in the guidance document. I received the following response:
We did consider your comments and discussed them with NYSERDA and RFF. We ultimately decided to stay with the recommendation of applying the Value of Carbon as described in the guidance as that is consistent with how it is applied in benefit-cost analyses at the state and federal level.
When applying the Value of Carbon, we are not looking at the lifetime benefits rather, we are looking at it in the context of the time frame for a proposed policy in comparison to a baseline. Our guidance provides examples of how this could be applied. For example, the first example application is a project that reduces emissions 5,000 metric tons a year over 10 years. In the second year you would multiply the Value of Carbon times 10,000 metric tons because although 5,000 metric tons were reduced the year before, emissions in year 2 are 10,000 metric tons lower compared to the baseline where no policy was implemented. You follow this same methodology for each year of the program and then take the net present value for each year to get the total net present value for the project. If you were to only use the marginal emissions reduction each year, you would be ignoring the difference from the baseline which is what a benefit-cost analysis is supposed to be comparing the policy to.
The integration analysis will apply the Value of Carbon in a similar manner as it compares the policies under consideration in comparison with a baseline of no-action.
I should have explicitly referenced this in my comments. It does not address my primary concern that the proper cost-benefit analysis is for meeting the Climate Act mandated target of an 85% reduction in GHG since 1990. Moreover, the benefit-cost analysis argument further biases their societal benefit claims when numbers are presented to the public.
Conclusion
To justify implementation of the Climate Act, the Hochul Administration political narrative is “that the costs of inaction are more than the costs of action”. The Scoping Plan basis for the claim included air quality health benefits, active transportation, and energy efficiency interventions in low- and middle-income homes. These benefits were not large enough to prove the case. The largest benefits claimed were based on the value of carbon avoided cost of GHG emissions. Absent the incorrect value of carbon methodology, the costs of action are more than the costs of inaction. I submitted this as a Scoping Plan comment and made the comment in a public hearing but have never received any response.
I do not expect any meaningful response to these comments. Most disappointing however is that despite my documentation of this error and other shenanigans used by the Scoping Plan authors to make sure they could claim benefits were greater than costs there has never been any response to them. Perhaps they hope that ignoring it means that it will just go away. It is not for a lack of trying but trying to shift the political narrative of New York’s climate policy is unlikely to succeed. It does give me something to do in retirement though.
This post summarizes comments that I submitted in response to comments submitted by Sierra Club and Earthjustice in the Proceeding on Motion of the Commission to Implement a Large-Scale Renewable Program and a Clean Energy Standard – Zero Emissions Target Case No. 15-E-0302. This proceeding addresses the need for a dispatchable emissions-free resource (DEFR) to resolve problems associated with a drought of wind and solar resource availability. My comments explain why I believe that the Sierra Club and Earthjustice fail to appreciate the potential magnitude and duration of the wind and solar resources “gap” and its impact on the DEFR requirements.
I have followed the Climate Leadership & Community Protection Act (Climate Act)since it was first proposed, submitted comments on the Climate Act implementation plan, and have written over 400 articles about New York’s net-zero transition. I am a meteorologist with over 40 years’ experience in the electric generating sector. I represent the Environmental Energy Alliance of New York on the New York State Reliability Council Extreme Weather Working Group (EWWG). The opinions expressed in this comment do not reflect the position of the Alliance, the Reliability Council, the Extreme Weather Working Group, or any of my previous employers or any other company I have been associated with, these comments are mine alone.
Overview
The Climate Act established a New York “Net Zero” target (85% reduction in GHG emissions and 15% offset of emissions) by 2050. It includes an interim 2030 reduction target of a 40% reduction by 2030 and a requirement that all electricity generated be “zero-emissions” by 2040. The Climate Action Council (CAC) was responsible for preparing the Scoping Plan that outlined how to “achieve the State’s bold clean energy and climate agenda.” In brief, that plan is to electrify everything possible using zero-emissions electricity. The Integration Analysis prepared by the New York State Energy Research and Development Authority (NYSERDA) and its consultants quantifies the impact of the electrification strategies. That material was used to develop the Draft Scoping Plan outline of strategies. After a year-long review, the Scoping Plan was finalized at the end of 2022. Since then there have been regulatory and legislative initiatives to implement the recommendations but progress has been slow.
In May 2023, the Public Service Commission (PSC) initiated a process to “identify technologies that can close the gap between the capabilities of existing renewable energy technologies and future system reliability needs, and more broadly to identify the actions needed to pursue attainment of the Zero Emission by 2040 Target” for New York electric generating sources intended to address that need. This resulted in the PSC commencing Proceeding 15-E-0302. In a Technical Conference held under the PSC’s auspices on December 11 and 12, 2023 entitled “Zero Emissions by 2040” included a session titled “Gap Characterization.” I addressed this session in an earlier post.
Sierra Club and Earthjustice Comments
The comments submitted by Sierra Club and Earthjustice (“SC&E) covered four topics associated with the December Technical Conference:
The Hydrogen Panel’s claim that there are “no technical issues” with hydrogen transportation and storage is misleading.
The claim that pipelines are the most efficient way of moving energy does not account for the roundtrip efficiency of green hydrogen versus direct transportation of electricity produced by renewable sources
The Panel did not dispel the serious doubts facing the potential use of hydrogen combustion as a “zero emissions” fuel source due to the inevitability of harmful NOx emissions
Significant Modeling Gaps in NYISO’s presentation at the Technical Conference cast doubts on the Operator’s conclusion that New York will have a DEFR need of 30 GW+
Except in passing, I did not address the first three topics. For the record, I agree with underlying premise of the SC&E comments that hydrogen transportation and storage is more of a problem than admitted by the Panel. I do not think that the choice of either hydrogen pipelines or electric transmission of hydrogen produced power matters much because of all the other enormous problems. I disagree that NOx emissions are a deal breaker for hydrogen combustion because NOx emissions from a modern combustion turbine are so low that they will not contravene the National Ambient Air Quality Standards which I maintain is the proper acceptability criterion.
My comments addressed the fourth topic. I believe that the Sierra Club and Earthjustice fail to appreciate the potential magnitude and duration of the wind and solar resources “gap” in their comments
Ultimate Reliability Problem
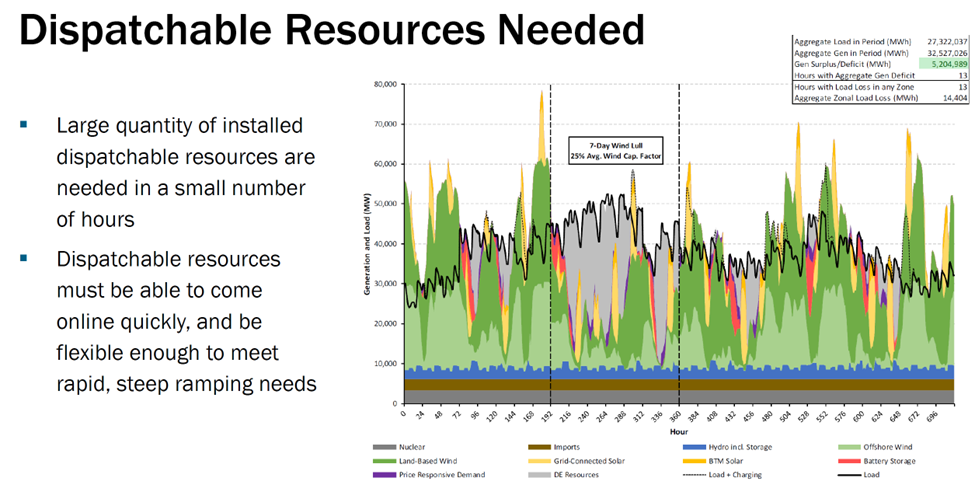
In my January comments I focused on the second attribute in Smith’s presentation about the ten attributes for reliability that must be provided by DEFR. His second attribute explained DEFR must be “non-energy limited and capable of providing energy for multiple hours and days regardless of weather, storage, or fuel constraints”. This is a particular concern of mine. Wind and solar resources correlate in time and space as shown by the NYISO analysis referenced in Smith’s presentation (Figure 1). The seven-day wind lull example in the dispatchable resources needed figure illustrates the problem. If there are insufficient resources during a wind lull, then load cannot be met. The consequences of that situation would be catastrophic.
Figure 1: Dispatchable Resources Needed from Zero Emissions by 2040 Technical Conference Slide Presentation Dispatchable Emission-Free Resources (DEFRs) by Zachary Smith NYISO
Feasibility Concern
My primary concern is the feasibility for the New York Climate Act implementation plan or more appropriately, the lack of a proper feasibility analysis, that addresses the worst-case wind and solar energy resource drought. I explained that a proper analysis for the worst-case drought must use as long a period as possible of historical meteorological data to provide the basis for projections of future load and estimates of electric resource availability based on projected deployment of wind, solar, energy storage, and other technologies needed to supply the expected load.
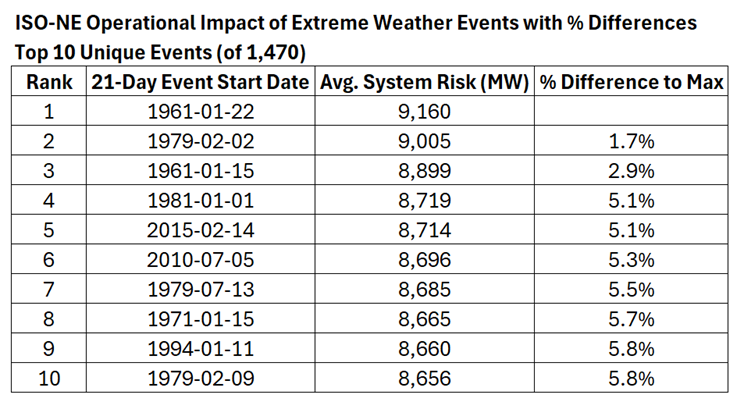
My comments incorporated the information in a recent post Wind and Solar Resource Availability Fatal Flaw. In that post I described various current studies that use the historical data-based approach. All these analyses find there are periods of low renewable resource availability. The Independent System Operator of New England (ISO-NE) Operational Impact of Extreme Weather Events analysis is particularly relevant because it includes a table of projected system risk for weather events over ta72-year data record. In the analysis, system risk was defined as the aggregated unavailable supply plus the exceptional demand during each evaluated time block. The Important point is that the system risk increases as the lookback period increases. If the resource adequacy planning for New England had only looked at the last ten years, then the system risk would be 8,714 MW, but over the whole period the worst system risk was 9,160 MW and that represents a resource increase requirement of 5.1%.
Source: ISO-NE Operational Impact of Extreme Weather Events, available here
SC&E Comment Issues
SC&E raised concerns in Section 4 of their comments: “Significant Modeling Gaps in NYISO’s Presentation at the Technical Conference Cast Doubts on the Operator’s Conclusion that New York Will Have a DEFR Need of 30 GW+.” The NE-ISO report results directly contradict the SC&E concern that “NYISO’s presentation at the December technical conference overstates the need for dispatchable, emissions-free resources (“DEFRs”) and downplays the value of taking steps in the near term to minimize this gap.”
The SC&E comments characterized Zachary Smith’s slideshow at the “Characterizing the potential ‘gap’” Panel presentation during the technical conference as “particularly alarming”. The comments said that the slideshow suggested that New York will require 30 GW of DEFRs, but said that “the analysis shown in slide 3 of Mr. Smith’s presentation has multiple flaws”:
The first flaw relates to the “Wind Lull” analysis. The “Wind Lull” analysis only uses three wind profiles (including just two upstate wind profiles) to determine whether a “Wind Lull” occurs. An analysis of “Wind Lulls” limited to two upstate profiles likely misses the diversity of wind in the NYISO footprint which includes wind in Zones B, C, and E in addition to other wind sites in Zones A and D aside from Niagara and Plattsburgh. Further, despite a maximum winter “Wind Lull” of five days in the historical record evaluated, the analysis determined that the winter “Wind Lull” period should be 7 days because “it is possible that there have been more severe wind lulls than in the time span we analyzed, and that there could be more severe wind lulls going forward, particularly if such outcomes are made more likely by climate change.” While this may be true, this assumption was not substantiated by any climate models or other analysis and should not be used as the basis for determining the length of winter “Wind Lull” periods to be evaluated. The limited number of wind profiles evaluated and unsubstantiated lengthening of the “Winter” wind lull period arbitrarily increase “wind lull” period lengths leading to a conservative assumption on wind availability and an overestimate of the DEFR gap.
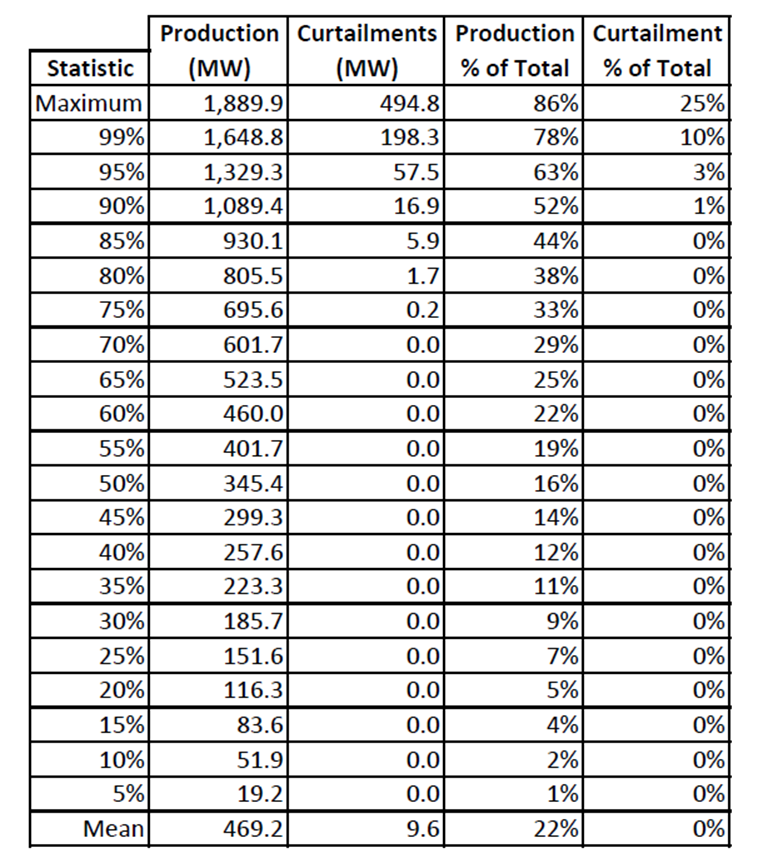
My comments explained why I disagree. In the first place, there is a very high correlation of wind resources in New York. For example, I used a NYISO resource that provides 2021 wind production and 2021 wind curtailment data that list the hourly total wind production and curtailments for the entire New York Control Area (NYCA) as shown in the following table. All of the wind in the state must be highly correlated if 25% of the time only 7% of the state total wind capacity is available. Only using two upstate wind profiles is not the best practice but neither is it particularly bad for the highly correlated New York data. In addition, this concern is addressed in the more recent work by the NYISO that was not available at the time of the Technical Conference.
The concern about assuming a 7-day wind lull when the short period analyzed only found a 5-day wind lull is not an issue. As the period of record increases the length of the gap increases and the NE-ISO found that it was appropriate to evaluate 21-day periods. In addition, SC&E comments overlook the need to consider the state of the energy storage resources going into a shorter poor resource availability period. If moderate weather conditions prevented full energy storage capacity, then that will affect the ability of the system to provide sufficient electric energy when it is needed the most.
As a result, the SC&E comments underestimate the DEFR requirement in their evaluation. They argue that it is premature to “deploy expensive and untested DEFRs risks committing New York to flawed technologies, as it is unclear at the present time which technologies will emerge as commercially scalable and cost effective”. I agree that we should be cautious but all the analyses I have seen in my own attempts to estimate necessary resources indicate that the SC&E proposal to “focus on accelerating the build out of storage, solar, and wind, along with other existing methods to minimize the DEFR gap” is inadequate. Solar, wind, and storage are insufficient in these gaps as shown in the Climate Act Scoping Plan analysis and work done by the NYISO – DEFR is needed.
The SC&E comments go on to claim that the NYISO Table 1 analysis did not reflect correlated wind, solar, and load data. If true, then I agree. However, subsequent analyses by the NYISO and NE-ISO do use correlated hourly meteorological data, estimate wind and solar resource availability, and project loads based on that data. All those results show that the magnitude of this problem is greater than appreciated in the comments. The SC&E conclusion that “If correlated wind, solar, and load shapes (without arbitrary adjustments) were used, it is likely that the DEFR Capacity need would be significantly reduced” is wrong. Correlated data over the period of record show that the DEFR capacity requirement will be greater than shown in the Smith analysis at the Technical Conference.
I also addressed the SC&E comments about alternative DEFR technologies, deployment timing, and requirements for hydrogen storage. If interested, then please check out my comments.
Related Issue
The SC&E comments raised a related critically important electric planning issue that I discussed in the Wind and Solar Resource Availability Fatal Flaw post and incorporated into my comments. Today electric system resource adequacy planners do not have to be concerned that many generating resources may not be available at the same time. All solar goes away at night and wind lulls affect entire regional transmission organization (RTO) areas at the same time. Therefore, when a future electric grid relies on wind and solar those resources will correlate in time and space. This issue is exacerbated by the fact that the wind lull will cover multiple RTO areas at the same time the highest load is expected. This paradigm shift for electric planning must be addressed.
It is an overarching issue. I do not believe we can ever trust a wind, solar, and energy storage grid because if we depend on energy-limited resources that are a function of the weather, then a system designed to meet the worst-case is likely impractical. Consider the ISO-NE events where it was found that the most recent 10-year planning lookback period would plan for a system risk of 8,714 MW. However, if the planning horizon covered the period back to 1961, the worst-case to 1950, an additional 446 MW would be required to meet the system risk. I cannot imagine a business case for the deployment of energy storage or the yet to be identified DEFR that will only be needed once in 63 years. For one thing, the life expectancy of these technologies is much less than 63 years. Even over a shorter horizon such as the last ten years, how will a required facility be able to stay solvent when it runs so rarely without large subsidies and very high payments when they do run.
On the other hand, the alternative to ignore the worst case is unacceptable. In the net-zero future, the electric grid is supposed to rely on wind and solar at the same time heating and transportation are electrified the need for reliable electricity is magnified. If we do not provide resources for the observed worst case, when those conditions inevitably reoccur, there will be a catastrophic blackout. Electricity will not be available when it is needed the most.
Recommendation
I recommend a detailed feasibility analysis that determines the worst-case observed wind and solar resource drought. The meteorological data reanalysis techniques that enable a period of record back to 1950 should be used. It should be a continental-scale analysis with realistic estimates of maximum available buildout of resources. Obviously, this is a major effort but everyone else in the country needs the same information so that we can determine how much energy will be available for import and export. The worst-case resource availability analysis will define the conditions and then resource planners can determine what must be deployed. Using a long period of record will allow planners to analyze return time relative to life expectancy of resources. The Commission should encourage coordination amongst all the RTOs to prepare this analysis.
Given the magnitude of the electric system transition I also recommend proof before proceeding. If it is feasible and economical to have an electrical grid powered predominantly by wind and solar generation, then it should not be difficult to put together a zero-emission demonstration project on a small or intermediate scale to prove how that can be done. Such a project does not exist anywhere in the world, which suggests that this might not be feasible.
My final recommendation is to establish safety valve guard rails for implementation. New York Public Service Law § 66-p (4). “Establishment of a renewable energy program” includes safety valve conditions for affordability and reliability that are directly related to the zero emissions resource. § 66-p (4) states: “The commission may temporarily suspend or modify the obligations under such program provided that the commission, after conducting a hearing as provided in section twenty of this chapter, makes a finding that the program impedes the provision of safe and adequate electric service; the program is likely to impair existing obligations and agreements; and/or that there is a significant increase in arrears or service disconnections that the commission determines is related to the program”.
Because of the enormity of the challenge, the lack of a feasibility study, and a successful model operating elsewhere, I believe that the zero emissions resource could be a primary driver of the reliability and affordability provisions of § 66-p (4) so it is incumbent upon the Commission to address these considerations in this Proceeding. The criteria used to define “safe and adequate electric service” and “significant increase in arrears or service disconnections” should be defined. This is necessary so that there is a clearly defined standard for invoking the § 66-p (4) safety valve.
I concluded that the importance of the resource gap and the DEFR technologies necessary to address it cannot be overstated. Simply put, if no technological and cost-effective DEFR solutions are feasible, then the current strategy to depend on solar and wind generating technologies is impossible.
Frequent readers of this blog know that many of my posts are long because I get bogged down documenting my statements. This is because of my background in industry where it is necessary to prove my arguments to have credibility. One disadvantage of that is that many articles that get my attention are not mentioned here because of a lack of time. I tried to address that with a fortnightly update on those articles but am going to try an experiment where I add a little commentary to articles that are of interest on a more frequent basis.
I have been following the Climate Leadership & Community Protection Act (Climate Act) since it was first proposed and most of the articles described below are related to the net-zero transition. I have devoted a lot of time to the Climate Act because I believe the ambitions for a zero-emissions economy embodied in the Climate Act outstrip available renewable technology such that the net-zero transition will do more harm than good. The opinions expressed in this article do not reflect the position of any of my previous employers or any other company I have been associated with, these comments are mine alone.
Physical Restraints to the Transition
In the Climate Act and elsewhere the strategy is to electrify everything possible. Many practical issues are overlooked by transition proponents such as the enormous requirements for copper necessary for electric infrastructure to replace fossil fuels. Substack Penguin Empire Reports explains that “A renewables grid is far more ‘copper hungry’ than a fossil fuel/ nuclear grid for two reasons: The ‘greener the grid,’ the more generators you’ll probably need to produce the same amount of electricity (on average) …multiplied by…. Each renewable generator needs more copper per unit than fossil fuel generators.”
Irinia Slav addresses the copper shortage situation. Copper prices have gone up because demand is greater than supply. Why aren’t miner rushing to mine more? Slav describes the “monumental wall of reasons for miners to not be looking for copper growth opportunities and that wall is standing right in the way of trillions in transition investments planned, hoped for, and cherished by politicians, activists and Fatih Birol.”
The Climate Act Scoping Plan cost estimates assume that implementation costs will go down in the future but given the scarcity of the raw materials necessary for the transition is that an appropriate assumption?
Prosperity issues can only be sold to people who can afford a heat pump or an ecological package. For most young people, however, it is clear: they will not retire at 70, they will not buy a house, and they may not be able to support a family – and if they do, their children will grow up in problem areas, in rural wasteland or in an environment of left-wing indoctrination.
The New York State Energy Research and Development Authority (NYSERDA) announced that $5 million is now available for demonstration projects that co-locate solar and agriculture within the state. Each project can receive up to $750,000. The state aims to expand the body of knowledge on the technical and financial viability of solar agrivoltaic facilities.
Sounds good because the Hochul Administration has still not mandated that utility-scale solar developers meet the NYS Department of Agriculture & Markets (NYSDAM) prime farmland guideline: “The Department’s goal is for projects to limit the conversion of agricultural areas within the Project Areas, to no more than 10% of soils classified by the Department’s NYS Agricultural Land Classification mineral soil groups 1-4, generally Prime Farmland soils, which represent the State’s most productive farmland.”
Here is what I do not understand:
According to NYSERDA summary documentation, eligible crops, livestock, and livestock products include, but are not limited to:
Field crops, including corn, wheat, oats, rye, barley, hay, potatoes and dry beans.
Fruits, such as apples, peaches, grapes, cherries and berries.
Vegetables, such as tomatoes, snap beans, cabbage, carrots, beets and onions.
Horticultural specialties, including nursery stock, ornamental shrubs, ornamental trees, and flowers.
Livestock and livestock products, including cattle, sheep, hogs, goats, horses, poultry, ratites (such as ostriches, emus, rheas and kiwis), farmed deer, farmed buffalo, fur bearing animals, wool bearing animals (such as alpacas and llamas), milk, eggs, and furs.
Maple sap.
Christmas trees derived from a managed Christmas tree operation whether dug for transplanting or cut from the stump.
Aquaculture products, including fish, fish products, water plants and shellfish.
Woody biomass, which means short rotation woody crops raised for bioenergy, and does not include farm woodland.
Apiary products, including honey, beeswax, royal jelly, bee pollen, propolis, package bees, nucs and queens. “Nucs” are defined as small honeybee colonies created from larger colonies, including the nuc box – a smaller version of a beehive, designed to hold up to five frames from an existing colony.
Actively managed log-grown woodland mushrooms.
Industrial hemp as defined in Section 505.
Eligible crops include apples, peaches, cherries, maple trees, and Christmas trees? Trees will shade solar panels. So, this approach is inconsistent with my understanding that the intent of agrivoltaics was to use the farmland within the solar panels to try to make up for the loss of the productive farmland. The intent of the NYSDAM guideline won’t be addressed either. So what am I missing?
Charles Rotter passed along a link to an article by a solar energy developer in New York that claims disinformation campaigns were hurting New York’s implementation of the Climate Leadership and Community Protection Act (Climate Act). After I looked at the article, I can safely say that it’s another example of my pragmatic environmental principle Observation on Environmental Issue Stakeholders: The more vociferous/louder the criticisms made by a stakeholder the more likely that the stakeholder is guilty of the same thing. This post looks at disinformation claims associated with a solar development project in New York.
I have followed the Climate Act since it was first proposed, submitted comments on the Climate Act implementation plan, and have written over 400 articles about New York’s net-zero transition. The opinions expressed in this post do not reflect the position of any of my previous employers or any other organization I have been associated with, these comments are mine alone.
Overview
The Climate Act established a New York “Net Zero” target (85% reduction in GHG emissions and 15% offset of emissions) by 2050. It includes an interim 2030 reduction target of a 40% reduction by 2030 and a requirement that all electricity generated be “zero-emissions” by 2040. The Climate Action Council (CAC) was responsible for preparing the Scoping Plan that outlined how to “achieve the State’s bold clean energy and climate agenda.” In brief, that plan is to electrify everything possible using zero-emissions electricity. The Integration Analysis prepared by the New York State Energy Research and Development Authority (NYSERDA) and its consultants quantifies the impact of the electrification strategies. That material was used to develop the Draft Scoping Plan outline of strategies. After a year-long review, the Scoping Plan was finalized at the end of 2022.
Correction 6/13/2024: Keith Schue contacted me to say that I had used the wrong numbers in this statement: “The Integration Analysis projects that 5,574 MW by 2030 compared with 21,058 MW in 2023 so solar deployment must double over the next seven years.” Boy did I ever use the wrong numbers. Those are the onshore wind numbers. The utility-scale solar facility capacity that is included in the NYISO market in 2023 was only 254 MW and the Behind the Meter (BTM) distributed solar included in the Integration Analysis estimate was 5,172 MW for a solar total of 5,426. NYISO projects that BTM solar in 2030 will be 10,015 MW and the Integrated Analysis projected 2030 solar capacity is 18,646 MW which means that utility-scale solar capacity will have to increase from 254 MW to 8,631 MW.
Hecate Energy Shepherd’s Run Solar Farm
Hecate Energy’s Shepherd’s Run is a 42 MW utility-scale solar facility located in Copake, NY in the Hudson River Valley southeast of Albany. According to Hecate: “It will be configured as a ground-mounted solar facility with PV panels on galvanized steel tracker racking structures. It will include rows of single-axis trackers, oriented in a north-south direction, that rotate the PV panels from east to west following the sun’s daily path.” They also claim that “The 42-MW solar farm is expected to annually generate approximately 70,000 MWh of energy — enough to meet the average annual consumption of over 9,500 New York households.” That works out to a capacity factor of 19.3%. The permitting documents note that the project area is 880 acres, the project footprint is 267 acres and there will be 138.3 acres “located inside the Project security fencing” which I assume means that is the area to be covered by solar panels.
This area of the Hudson Valley has attracted influential folks with money from New York City because of the beauty and rural character of the region which has led to a couple of things. I think that contributes to the attention this project has received in the national media. Bloomberg Opinion described it as “The Solar farm that almost destroyed Copake, NY”. In a Reveal podcast, The Center for Investigative Reporting also addressed the project in “Sunblocked: Resistance to Solar in Farm Country” with the byline “Across the country, rural communities are pushing back against large-scale solar development”. The other aspect of the moneyed class influence is the desire and the money to fight against anything that detracts from the reasons the “Citidiots” invaded this area.
In 2017 Hecate identified this area for solar development because it offered room for solar development, a nearby electrical substation, and according to the Bloomberg article “Democratic political leadership, and a relatively liberal bent, Copake seemed poised to be a welcoming environment for renewable energy.” I believe Hecate originally submitted a permit application under New York’s original electric utility siting program, but I cannot find any links for that application. However, local opposition sprang up early in that process. The town changed its zoning rules to stymie large solar developments. Hecate changed to a new permitting process implemented to expedite renewable energy development. On November 23, 2021, they submitted a notice of intent to file for an application to the New York State Office of Renewable Energy (ORES) that can overrule any “home rule” regulations by the residents directly affected by a solar or wind facility.
In June 2021 the town of Copake joined 12 other municipalities along with some environmental and conservation advocate organizations in filing a lawsuit in state Supreme Court of Albany County against the state Office of Renewable Energy Siting, an agency created to fast-track the permitting process for new renewable energy projects. The suit alleged that the agency was attempting to circumvent local zoning laws. In May 2023, Justices of the Third Department state Appellate Court upheld a lower court ruling dismissing the lawsuit.
The NPR article went on to explain the remaining parts of the permitting process that included public hearings in January. However in early January the public hearings were called off because the Town of Copake filed a motion to dismiss the application because 60 acres of the project property were sold to someone who did not want anything to do with the project. The ORES permit application website notes under “denied applications” that the application was denied without prejudice.
Disinformation Campaign
After years of effort and cost, Hecate was not happy with the decision. The article “Disinformation Campaigns Are Hurting New York’s Clean Energy Future” was published at RealClearEnergy and authored by Matt Levine who is the “project director for the Shepherd’s Run Solar Farm and senior director of development for Hecate Energy.” He claims that the opposition was the result of disinformation as noted in the excerpts below.
After the obligatory praise for “the ambitious goals set by the landmark climate law passed in 2019” he jumps right into the evils of disinformation campaigns:
Whether or not you support accelerating clean energy projects, we should all be able to agree that disinformation campaigns are a disservice to the public. Honest policy debates demand clear and accurate information. But earlier this year, NPR highlighted the prevalence of disinformation and increasing pressure on local officials, who are often charged with approving renewable energy projects.
Their reporting focused on groups like Citizens for Responsible Solar, who are part of a growing national effort to orchestrate opposition to renewable energy in rural communities across the U.S. The national group has helped smaller local groups fight solar projects in at least 10 states, according to its website.
This NPR article referenced a group called Citizens for Responsible Solar that argues that “Solar belongs on rooftops, near highways, commercial, industrial-zoned land, marginal or contaminated areas, not on rural-agricultural land.” The organization and a group of locals organized opposition to a solar project in Virginia but there is no indication that there is any link between that group and anything at the Shepherd’s Run Solar Farm. Levine goes on:
By blocking projects that could generate economic activity and passive tax revenue in rural areas, these campaigns are hurting the communities they purport to protect, both economically and environmentally. Nevertheless, groups like these are becoming so successful at spreading disinformation that a 2022 report by the Sabin Center at Columbia University found 121 local policies around the country that are aimed at blocking or restricting renewable energy development, a 18% increase from the previous year.
Solar developers are quick to point out that a landowner gets revenue when a solar project is developed and there are tax incentives. However, when land is taken out of production it will reduce farm jobs. While economic activity may be improved during construction once the facility is operational there are very few economic benefits to essential local businesses. Furthermore, taking the land out of production may make other farmers who have been renting that land to make their operations viable will not be able to support investments they have made in facilities, livestock, or equipment. Levine continues:
In New York, an investigation by the Public Accountability Initiative found that since 2016, a multifaceted campaign by the fossil fuel industry has spent more than $15.5 million to undermine efforts to promote clean energy. Unfortunately, much of that work has relied on false and misleading information.
The claim that there is an enormous effort by the fossil fuel industry to provide false and misleading information ignores the funding and level of effort by non-governmental organizations who espouse the climate industry’s narrative and the source of their funding. The Natural Resources Defense Council had a total income of $193,144,386 and paid $125,417,997 in salaries in 2023. Their experts web page notes a position for the Utility Regulatory Director, New York, Climate & Energy and that 69 other experts have done analyses in New York. That is just one organization. There are dozens more organizations in New York that support the climate industry and their work is rife with false and misleading information.
The playbook is usually the same. Groups with innocuous sounding names — New Yorkers for Affordable Energy, for example – claim the mantle of grassroots support while actually doing the bidding of the natural gas industry. They lean heavily on misleading industry talking points that falsely claim the transition to renewable energy would “damage New York’s families and businesses.
I can find nothing to disagree with his characterization that New Yorkers for Affordable Energy is funded by the natural gas industry. However, the docket for the project does not include anything from the organization or the one individual mentioned on their web page in the 627 filed documents or the 1,000 public comments in the docket for the permit. He simply names an industry supported organization and suggests that their very existence is unacceptable.
Eventually Levine gets to Shepherd’s run and blames misinformation as the reason that there was so much vociferous opposition.
As a renewable energy developer working in several states in the Eastern U.S., I see the impact of these efforts on the ground. Take the town of Copake in Upstate New York, where Hecate Energy plans to build the 42 GW Shepherd’s Run Solar Farm.
This is exactly the type of project New York must accelerate if the state has any chance of meeting the state’s renewable energy goals. Yet, opponents have implemented tactics that have delayed the project for years, running the now-standard playbook.
See if this sounds familiar: a group with an innocuous sounding name – in this case Sensible Solar for Rural New York – bills itself as a grassroots organization and claims to support clean energy. Media reports and state disclosure forms show them hiring the same lobbying firms and marketing teams employed by the fossil fuel industry and its allies to oppose clean energy projects.
They echo the same talking points used by national opposition groups, relying on false or misleading claims about farmland being permanently destroyed, adverse impacts to nearby watersheds, and reduction in property values.
I recommend the Reveal Podcast “Sunblocked: Resistance to Solar in Farm Country” because it describes the nuances of the Shepherd’s Run support and opposition. Interviews with one family that sold leases to Hecate, Hecate spokesmen, another farmer who was using the land that will no longer be available, Town Board members, an expert on support and opposition to similar projects, and organizers of Sensible Solar for Rural New York provide a good cross section of those involved. While some of the opponents were against the project simply because it is in their backyards many argued that they would accept the project if it were done sensibly.
I was involved in many development projects in my career, so I sympathize with the Hecate project developers. There is no way that you can make everyone happy, and some individuals will never be satisfied. In my opinion, the solution is to be upfront with the facts and be sure to meet or exceed all the regulatory guidance.
Prime Farmland
I am not a big fan of solar development in New York and have published a page that describes my concerns. My biggest concern is that the Hochul Administration has not required solar developers to adhere to all the NYS Department of Agriculture and Markets (NYSDAM) guidelines that have been described in prepared testimony that I believe represent best practices and should be mandatory going forward. In particular, “The Department’s goal is for projects to limit the conversion of agricultural areas within the Project Areas, to no more than 10% of soils classified by the Department’s NYS Agricultural Land Classification mineral soil groups 1-4, generally Prime Farmland soils, which represent the State’s most productive farmland.” I think this is a reasonable guideline and one that should be a mandatory requirement for all future projects.
The initial application for the project Agricultural Appendix 15 February 2022 stated that: “Relative to agricultural soils, the Project Area includes approximately 12.41% (218.00 acres) of land classified as Prime Farmland, 5.33% (93.70 acres) as Prime Farmland if Drained, 10.27% (180.42 acres) as Farmland of Statewide Importance, and 21.99% (386.44 acres) as Not Prime Farmland.” Note that they admit that they exceed the NYSDAM guidelines.
In a revised version of the Agricultural Appendix submitted on January 2023 this discussion is revised:
The total Project Footprint will include approximately 265 acres and includes the limits of all temporary and permanent impacts associated with the construction and operation of the Project. There are 197.69 acres of active agricultural land in the Project Footprint. The Project is designed within a fenced and contained area, and no active agricultural practices will occur within the fenced area containing the solar arrays during the operation of the Project. Therefore, the applicable NYSDAM Guidelines will be followed during construction with respect to temporary features (such as construction laydown yards). If applicable NYSDAM Guidelines cannot be implemented, the Applicant will consult with NYSDAM to discuss acceptable and appropriate alternatives. The Applicant will follow the NYSDAM Guidelines during Project decommissioning and site restoration.
Two comments on this. The prime farmland numbers are missing and the NYSDAM Guidelines they refer to are the construction guidelines and not the guidelines for the protection of prime farmland that NYSDAM staff references in their prepared testimony for every application.
Hecate Energy Columbia County 1 LLC (the Applicant) has developed this Agricultural Plan in accordance with 19 NYCRR § 900-2.16 in order to avoid, minimize, and mitigate agricultural impacts to active agricultural lands within NYS Agricultural Land Classified Mineral Soil Groups (MSG) 1 through 4 to the maximum extent practicable, consistent with the New York State Department of Agriculture and Markets (NYSDAM) Guidelines for Solar Energy Projects (“NYSDAM Guidelines” or “Guidelines”).
Two comments on this section. The reference to prime farmland has switched to the technical description of soil types and the references to Guidelines are again for the construction impacts. The phrase that they tried to avoid, minimize, and mitigate agricultural impacts is not exactly true because they picked only the NYSDAM guidance that that they were required to follow. Furthermore, in response to a notice of incomplete application they were asked to provide the acreages for each soil classification. Their response in the final revision states:
There are approximately 200 acres of active agricultural land in the Project Footprint. As described in Exhibit 15 Section 15(b) of the Application, of the 199.98 acres of active agricultural land in the Project Footprint, 143.86 acres are classified as MSG 1-4. The Project is designed within a fenced and contained area, and no active agricultural practices will occur within the fenced area containing the solar arrays during the operation of the Project. Of the 162.8 acres of MSG 1-4 in the Project Footprint, and 143.86 acres are identified as active agricultural land. Therefore, the applicable NYSDAM Guidelines will be followed during construction with respect to temporary features (such as construction laydown yards) and permanent features (such as permanent access roads) within the 143.86 acres of active agricultural lands, as defined by 19 NYCRR § 900-2.16(c), within New York State Agricultural Land MSGs 1-4. If applicable NYSDAM Guidelines cannot be implemented, the Applicant will consult with NYSDAM to discuss acceptable and appropriate alternatives. The Applicant will follow the NYSDAM Guidelines during Project decommissioning and site restoration.
Note that the incriminating percentages were not included. Obfuscation is the name of the game for the acreages. Elsewhere the project footprint is listed as 267 acres but here they describe the active agricultural land (200 acres). They do admit that 143.86 acres are prime farmland and that works out to 16% of the project area of 880 acres (also not provide in this paragraph) far exceeding the NYSDAM protection of prime farmland protection guidance of no more that 10%.
Maps of the locations of prime farmland and the location of the solar panels show that the developers chose the expedient and cheapest development option. If the land is flat and has no trees then installing solar panels is simplified. The example map below shows why the residents are so exercised by the development.
Figure 15-11. Map 3 of 5 ORES and Local Zoning Requirements with MSG 1-4 Soils-Active June 2023
Discussion
The Hochul Administration has not mandated that utility-scale solar development must comply with all Department of Agriculture and Markets guidelines. Solar developers routinely ignore that guideline. My latest scorecard of this parameter shows that only seven of the 20 projects included as updated in March 2024 met the prime farmland guidance and that overall solar projects have destroyed 8,801 acres of prime farmland and totaling 20% of the project areas. However, it does show that meeting the guideline can be done.
This is not the fault of the solar developers. In the absence of any requirement to meet that guidance the cost-effective solution for the out-of-state developers is to ignore the guidance. The fact that the Hochul Administration has instituted that requirement for smaller distributed solar projects is infuriating to me and has the distinct whiff of cronyism and lobbyist influence. That is not the only missing protection. There are no requirements for agrivoltaics that at least try to support farming or requirements for tilting axis solar panels consistent with the implementation plans. To their credit, Hecate was planning to use the tilting axis panels and their projected a capacity factor of 19.3% is better than last year’s statewide average. Using fixed panels means that more panels must be installed.
I do not have any sympathy for Hecate project manager Matt Levine’s claims that a pervasive cult of fossil-fuel funded disinformation was the primary driver for the opposition to the project. Clearly, they took the expedient approach to develop the prime farmland in the project area knowing full well that it exceeded New York guidelines for farmland protection. Moreover, the language in the article and application cover up that decision. If the application is not above board in every respect, then the locals sense they are being taken for a ride. Unfortunately, the only reason that the project was rejected was because of a last-minute change in ownership that nullified the application. If it not for that reason, then the application would have been approved despite the well-founded local opposition.
Conclusion
I do not think that solar energy that will not provide adequate support to the electric grid when it is needed the most (winter peak loads) is a sustainable electric grid resource so I oppose its use for utility-scale applications. But if that is state policy to develop solar then at least deployment should minimize impacts. That is not the case in New York. The real disinformation in this instance is the insistence that there are no legitimate problems with solar deployment as suggested by the author of “Disinformation Campaigns Are Hurting New York’s Clean Energy Future”.
put together an article about every relevant topic I have discovered. This is a summary of articles that I think would be of interest to my readers.
I have been following the Climate Leadership & Community Protection Act (Climate Act) since it was first proposed and most of the articles described below are related to the net-zero transition. I have devoted a lot of time to the Climate Act because I believe the ambitions for a zero-emissions economy embodied in the Climate Act outstrip available renewable technology such that the net-zero transition will do more harm than good. The opinions expressed in this article do not reflect the position of any of my previous employers or any other company I have been associated with, these comments are mine alone.
New York City Panel Discussion on Net-Zero Economy
Francis Menton invites folks to a panel discussion on the costs and consequences of pursuing a “net zero” economy. Experts Benny Peiser and Francis Menton will share their outlook for Europe’s present and America’s future.
Net-zero by 2050 is simply not happening. Paul Homewood writes:
professor emeritus at the University of Manitoba and a best-selling author of 47 books. Whenever Smil publishes something new, people in the energy space pay attention. That’s certainly the case with his latest publication, a 48-page report titled “Halfway Between Kyoto and 2050: Net Zero Carbon Is a Highly Unlikely Outcome.” In the report, Smil details efforts to date by global governments to reduce greenhouse gas emissions and finds them wholly inadequate to achieve the goal of net-zero by 2050.
Energy Storage Issue
The LS Power Gateway Energy Storage project is located in San Diego County California. As far as I can tell it has a 250 MW capacity and can provide 250 MWh oF energy. The fact that it caught fire and kept re-igniting was a news story that did not get much coverage. There have been evacuation orders because of “harmful” gases. Here is another story.
Inverter-Based Resources
Meredith Angwin gives a great overview of wind and solar inverter-based resources and why it matters. Spoiler – it is another complication that has already led to blackouts. She quotes the scary bit in the NERC Odessa report that addresses an incident in Texas:
“In many cases, industry is not proactively identifying abnormal performance of inverter-based resources…the recommendations outlined in NERC reliability guidelines are not being adequately adopted….Plants stated that no mitigating actions are being done (or planned) to improve the performance of the resources involved in the event.”
Continent Sized Wind Lull
Australia example of the extent of a wind lull. “Australia has built 11.5 GW of theoretical total wind power capacity on the National Energy Market (NEM) spread across 80 locations on the Eastern Seaboard, and at one point today only 4.1% of it was working. Another gigawatt of generation on the Western side is only generating at 3 – 5% capacity.”
Solar Panel Trash
Harvard Business Review notes that solar panels are going into landfills. Of course they don’t suggest that “this should raise serious doubts about the future or necessity of renewables”. They claim “Compared with all we stand to gain or lose, the four decades or so it will likely take for the economics of solar to stabilize to the point that consumers won’t feel compelled to cut short the life cycle of their panels seems decidedly small.” Yet another example of build as much as you can as fast as you can and hope that it all works out.
Environmental Issues are Not Simple
Lucy Biggers describes her epiphany at the Free Press – Finally, I’m admitting it out loud. “In my heart of hearts, I always knew environmental issues were more complicated than the way I sold them to my true-believer followers.”
It really wasn’t until 2021, by which time I was 31 and had left NowThis, that I was finally willing to confront the complications I’d avoided during all those years as a sustainability influencer. I began reading books and news sources that strayed from the progressive party line, titles like Unsettled by Steve Koonin, Apocalypse Never by Michael Shellenberger, and Fossil Future by Alex Epstein. I realized that the environmental causes I had so breathlessly championed were much more complicated than good versus evil.
Do fossil fuels cause our planet to warm? Yes. They also make modern life possible, freeing women from hours of labor and empowering us in a million different ways. They’re singularly cost-effective and versatile as an energy source. This is something that the “keep it in the ground” climate activists never acknowledge. Nor do they admit that the promised panacea of renewable energy, like solar and wind, are nowhere near close to replacing fossil fuels and in fact, have their own dark environmental footprint.
Bjorn Lomborg
His Newsletter cites a new op-ed for The Wall Street Journal (also accessible here) that the West should make economic growth a priority again and stop hemorrhaging their resources on climate policies that mostly enrich China.
Climate hysteria is, at its most basic level, a luxury belief that can be afforded by neurotic, well-to-do westerners. For many of those who are loudest about the green agenda, these beliefs are actually a status symbol.
Robert Bradley points out that solar has had 15 subsidy exemptions. “But nothing is so permanent as a temporary government program.” (Milton and Rose Friedman, Tyranny of the Status Quo, 1983, p. 115)
Marie French is a correspondent for Politico New York and notes that at the close of the New York legislative session: “Lawmakers departed Albany – 5 years after CLCPA – without any significant action this year to reduce emissions or support achievement of the state’s climate law”.
Congestion Pricing
New York City’s congestion pricing program was supposed to take effect at the end of June. Energy Mix quoted Governor Hochul: “After careful consideration I have come to the difficult decision that implementing the planned congestion pricing system risks too many unintended consequences,” Hochul said June 5. “I have directed the MTA [Metropolitan Transportation Authority] to indefinitely pause the program.” It is all part of the political calculus and Hochul backed off due to the costs. “I can’t do anything right at this time that would also suck the vitality out of this city when we’re still fighting for our comeback,” she told reporters at a news conference.
This raises a question. The congestion pricing plan was expected to generate $1 billion a year. At the Energy Access and Equity Research webinar sponsored by the NYU Institute for Policy Integrity on May 13, 2024 Jonathan Binder stated that the New York Cap and Invest Program would generate proceeds of “between $6 and $12 billion per year” by 2030. At what level will the cap and invest program suck the vitality out of New York State?
Syracuse Post Standard reporter Tim Knauss recently wrote two articles that expose the disconnect between the executives in the electric industry and their customers. The Climate Leadership & Community Protection Act (Climate Act) will cost enormous amounts of money at the same time it increases reliability risks. The politicians supporting it and the leadership of the utility companies all have not admitted just how much it will cost ratepayers. This post uses National Grid’s “Net-Zero Overhaul” as an example.
I have followed the Climate Act since it was first proposed, submitted comments on the Climate Act implementation plan, and have written over 400 articles about New York’s net-zero transition. The opinions expressed in this post do not reflect the position of any of my previous employers or any other organization I have been associated with, these comments are mine alone.
Overview
The Climate Act established a New York “Net Zero” target (85% reduction in GHG emissions and 15% offset of emissions) by 2050. It includes an interim 2030 reduction target of a 40% reduction by 2030 and a requirement that all electricity generated be “zero-emissions” by 2040. The Climate Action Council (CAC) was responsible for preparing the Scoping Plan that outlined how to “achieve the State’s bold clean energy and climate agenda.” In brief, that plan is to electrify everything possible using zero-emissions electricity. The Integration Analysis prepared by the New York State Energy Research and Development Authority (NYSERDA) and its consultants quantifies the impact of the electrification strategies. That material was used to develop the Draft Scoping Plan outline of strategies. After a year-long review, the Scoping Plan was finalized at the end of 2022. In 2023 the Scoping Plan recommendations were supposed to be implemented through regulation, PSC orders, and legislation. That process is falling behind as the enormity of the challenge becomes clearer.
National Grid Net Zero Overhaul
I live in Upstate New York and National Grid is my electric utility. National Grid is the electricity system operator for Great Britain. In 2000 National Grid started purchasing utilities in the United States and now is “an electricity, natural gas, and clean energy delivery company serving more than 20 million people through our networks in New York and Massachusetts.” They tout plans for National Grid for “a smarter, stronger, cleaner energy future — transforming our networks with more reliable and resilient energy solutions to meet state climate goals and reduce greenhouse gas emissions.”
Someday I may return to this topic and focus on the “more reliable and resilient solutions” claim. For the time being I will content myself with just saying this is codswallop. I don’t think it will ever be possible for New York to meet its state climate goals as presently outlined without a catastrophic blackout because the energy storage and dispatchable emissions free resources necessary to meet the worst-case low wind and solar resource drought are impractical. Utility executives know that this is an issue but play along with the plans for their own self-interest not the interests of their customers.
This article will address the proposed plan for the “cleaner energy future”. In particular, Nation Grid recently announced plans for a £60bn Net Zero overhaul of National Grid. That total is for all the National Grid companies. The US National Grid press release included the following quote:
Group CEO of National Grid John Pettigrew said: “Today’s announcement is a clear illustration that National Grid is committed to playing our part in achieving the ambitious decarbonization targets that New York and Massachusetts governments have set. The increased investment we’re announcing today follows positive engagement with our regulators in these states, reflecting a willingness to upgrade electricity networks to provide long term affordable energy to all, and reduce emissions across our gas networks.”
The $16 billion plan represents a 60% increase over what National Grid has spent during the past five years. It includes a $4 billion project under way to improve 1,000 miles of transmission lines, which National Grid calls the “Upstate Upgrade.” Other projects have not yet been identified.
Knauss also quoted spokesperson Jared Paventi: ““Will there be an impact for the customer? Yes, but I believe that it’s going to be negligible based on the time period that we’ll be recovering those costs,” Paventi said.” While the quote suggests that this is his personal opinion, I have no doubts that is the story he was charged to say.
Rate Case Proposal
The press release for the upcoming New York rate case gives the highlights:
Critical investments to ensure the reliability and safe operation of the company’s energy delivery system that serves 2.3 million upstate New York residential and business customers.
Enhanced system resiliency and reliability measures to manage and reduce the impact of frequent and severe weather and enable continued strong storm response.
Integrated energy planning to consider interactions between gas, electric and customer energy systems to achieve long-term climate goals in a safe and affordable way.
Infrastructure investments to support economic development, connect clean energy, and enhance security.
Targeted programs and dedicated teams to better serve residential, commercial and industrial customers.
Enhanced energy affordability programs and services, and programs to enable clean energy and energy efficiency benefits for disadvantaged communities.
In 2020 National Grid asked for a $142 million increase in annual electric and gas delivery revenues. This year, the utility is asking for $673 million. If the Public Service Commission goes along, that would raise National Grid’s electric delivery revenues by 20% and its gas revenues by 28%. A typical household would pay $440 a year more for electricity and gas.
National Grid describes the reasons for the increase as a catchup from the last rate case when “the company and regulators put a top priority on holding down an increase” and “Inflation and supply-chain constraints have raised the cost of transformers, poles, cables and other equipment” Knauss writes that they also admit that: “the power grid requires significant new investments to make way for more electric vehicles, electric-heat buildings, and other elements of New York’s planned transition away from fossil fuels.” I doubt that the attribution of costs to these reasons will be readily available.
Discussion
The impetus for this article was spokesperson Jared Paventi’s claim that the costs for the investments will be “negligible”. Knauss provides the data that suggests otherwise. He points out that “In an order issued last year to approve $4.4 billion in new transmission lines planned by several utilities, the state Public Service Commission estimated the work could increase residential bills by about $3.50 a month, decreasing over time.” The New York Net Zero Overhaul estimate is $16 billion. That will cause residential bills to increase an additional $12.73 per month. I don’t call that negligible and that is only a small portion of the total increases proposed in the rate case.
The other thing that caught my eye was the comment by Group CEO of National Grid John Pettigrew that the New Zero Overhaul announcement “follows positive engagement with our regulators in these states”. Cynic that I am, this sounds like the executives got an audience with the Hochul Administration and promised to follow their script for Climate Act implementation right before the rate case was released. Maybe it is just a coincidence, but it smells like a backroom deal to me that has corporate and political interests at its heart with the welfare of the ratepayers ignored. Hochul recently nominated three environmental ideologues to the Public Service Commission. I have no doubts where their biases lie and believe that any costs for the great net-zero transition will be approved by those three.
Conclusion
I do not think that there is any question that electric utilities have determined that implementation of net-zero transition plans will be risky and costly for their customers. However, I believe they have also determined that implementation is in their financial best interest. Similarly, the regulatory agencies certainly have technical experts who understand the risks but the political appointees in charge ignore their counsel because their handlers are catering to a specific constituency. This does not portend well for everybody else.
There is a glimmer of hope. It is only a matter of time until the cost blowback begins on these rate cases. On June 5, 2024 Hochul indefinitely paused implementation of the New York City congestion pricing plan. The rate cases will cause the costs of energy to increase for more people and the Climate Act is a big part of the increase. Hochul said, “it’s not the right time” for congestion pricing as “New Yorkers face a cost-of-living crisis”. Hopefully this will be draft language for a walk back on the aspirational Climate Act implementation plan when the true costs become clear.
I have been following issues associated with wind and solar resource availability for many years. My thinking has evolved to the point where I now believe that in a rational world it would be recognized that any electric grid relying on wind and solar is doomed to failure. This post explains why.
I am a retired electric utility meteorologist and have taken every opportunity I have had to raise my concerns about wind and solar resource availability in New York regulatory proceedings. I have followed the Climate Act since it was first proposed, submitted comments on the Climate Act implementation plan, and have written over 400 articles about New York’s net-zero transition. The opinions expressed in this post do not reflect the position of any of my previous employers or any other organization I have been associated with, these comments are mine alone.
Overview
The Climate Act established a New York “Net Zero” target (85% reduction in GHG emissions and 15% offset of emissions) by 2050. It includes an interim 2030 reduction target of a 40% reduction by 2030 and a requirement that all electricity generated be “zero-emissions” by 2040. The Climate Action Council (CAC) was responsible for preparing the Scoping Plan that outlined how to “achieve the State’s bold clean energy and climate agenda.” In brief, that plan is to electrify everything possible using zero-emissions electricity. The Integration Analysis prepared by the New York State Energy Research and Development Authority (NYSERDA) and its consultants quantifies the impact of the electrification strategies. That material was used to develop the Draft Scoping Plan outline of strategies. After a year-long review, the Scoping Plan was finalized at the end of 2022. In 2023 the Scoping Plan recommendations were supposed to be implemented through regulation, PSC orders, and legislation. That process is falling behind as the enormity of the challenge becomes clearer.
Background
The North American Electric Reliability Corporation (NERC) recently convened a webinar for the Cold Weather Preparedness Small Group Advisory Sessions (SGAS) to “provide an educational opportunity for registered entities to meet with NERC and Regional Entity representatives to discuss the cold weather preparedness Standards and possible compliance approaches in an open and non-audit environment.” The impetus for this initiative was the February 2021 Texas event described in the following slide. The regulatory fallout for this event is not finished but the need to discuss how best to address these events is so acute that SGAS was established in “an open and non-audit environment”.
The takeaway point is that there are already electric grid resource adequacy issues in the existing system during extreme weather events. I am most concerned about the future grid that relies on weather impacted resources. Even though Texas has substantial wind and solar resources their presence did not contribute meaningfully to this Texas blackout. Instead, it was the failure of many components of the traditional generating and transmission systems to be sufficiently hardened to extreme cold. In the future the weather dependent grid will cause similar problems more frequently and, as I will show, may not be able to prevent a catastrophic blackout.
My primary concern is the feasibility for the New York Climate Act implementation plan. or more appropriately the lack of a proper feasibility analysis, that addresses the worst-case wind and solar energy resource drought. In September 2021, I described the reliability challenges for the Climate Act described by the organizations responsible for electric system reliability. All the credible analyses done for future grid reliability point out the expected worst-case scenario – When New York electrifies heating and transportation the peak load will be in the winter when temperatures are coldest. The Integration Analysis identified a multi-day period winter wind lull. The New York Independent System Operator has done similar analyses and showed that winter wind lulls that coincide with low solar availability and high loads will be the ultimate problem. The New York Department of Public Service also has identified the Renewable Energy Gap as a major issue. In my opinion, however, no analysis done to date has identified the worst-case scenario because they have all used relatively short periods of historical data.
All credible renewable resource projection analyses use historical meteorological data, projections of future load during those periods, and estimates of electric resource availability based on assumed deployment of wind, solar, energy storage, and other technologies needed to supply the expected load. Hourly profiles of weather variables produced via the weather forecast modeling techniques are used to develop hourly demand forecasts and energy output profiles for wind and solar resources for the periods being studied. The credible analyses only differ in their assumptions for the characteristics of the buildouts and the sophistication of potential availability based on climatological and geographical constraints. Once the analysis is complete the resulting data can be used to identify the worst case.
The New York Independent System Operator (NYISO) is working with its consultant DNV to develop New York onshore wind, offshore wind, and solar resource availability. Their analysis uses a 23-year historical meteorological database for the New York State renewable resource areas. Similar analyses are underway in other regional transmission operator regions. It has also been recognized that larger areas need to be treated similarly. The Electric Power Research Institute has a Low-Carbon Resources Initiative that has been looking at the North American continent. Researchers outside of the industry have also done analyses of wind and solar power droughts using the ERA5 reanalysis data from 1950 to the present. The reanalysis data analysis uses current weather forecast models and historical observations to provide hourly meteorological fields. These data can be further refined to finer scales to project the wind and solar resource availability.
The magnitude, duration, and widespread geographic impacts identified by this preliminary analysis are quite significant and will be compounded by load growth from electrification. This highlights the importance of reliability considerations associated with offshore wind and wind lulls be accounted for in upcoming reliability assessments, retirement studies, and system adequacy reviews to ensure sufficiency of system design to handle the large offshore wind volume expected to become operational in the next five to ten years.
The NYISO/DNV analysis used a 21-year database. In a similar type of analysis, the Independent System Operator of New England (ISO-NE) Operational Impact of Extreme Weather Events, the ERA5 data were used to prepare a database covering 1950 to 2021. The analysis evaluated 1, 5, and 21-day extreme cold and hot events.
One of the important results presented in the ISO-NE analysis was a table of projected system risk for weather events over the 72-year data record. In the analysis, system risk was defined as the aggregated unavailable supply plus the exceptional demand during the 21-day event. Note that the analysis considered sliding windows for the 21-day events by shifting the 21-day window every seven days. The unsurprising point I want to highlight is that the system risk increases as the lookback period increases. If the resource adequacy planning for New England only looked at the last ten years, then the system risk would be 8,714 MW, but over the whole period the worst system risk was 9,160 and that represents an resource increase of 5.1%.
Source: ISO-NE Operational Impact of Extreme Weather Events, available here
Note that there was an EWWG analysis of Historical Weather and Climate Extremes for New York performed by Judith Curry and myself that identified the January 1961 event as the probable worst-case scenario. We found that there was a 15-day period from January 20 until February 3, 1961 that will likely turn out to be the worst-case cold wave. This was a period when high-pressure systems dominated the weather in the Northeast and those conditions mean light wind speeds.
Discussion
I do not think we can ever have an electric grid that will provide reliable power when it is needed the most. Today electric system resource adequacy planners don’t have to worry that many generating resources might not be available at the same time. In a future electric grid that relies on wind and solar the fact that those resources correlate in time and space is what I think is the insurmountable planning problem. All solar goes away at night and wind lulls affect entire regional transmission organization (RTO) areas at the same time. This issue is exacerbated by the fact that the wind lull will cover multiple RTO areas at the same time the highest load is expected.
The reason we can never trust a wind, solar, and energy storage grid is because if we depend on energy-limited resources that are a function of the weather, then a system designed to meet the worst-case is likely impractical. Consider the ISO-NE events where it was found that the most recent 10-year planning lookback period would plan for a system risk of 8,714 MW. However, if the planning horizon covered the period back to 1961, the worst-case to 1950, an additional 446 MW would be required to meet the system risk. I cannot imagine a business case for the deployment of energy storage or the magical dispatchable emissions free resource that will only be needed once in 63 years. For one thing, the life expectancy of these technologies is much less than 63 years. Even over a shorter horizon such as the last ten years, how will a required facility be able to stay solvent when it runs so rarely without subsidies and very high payments when they do run.
As I described in an earlier article, the New York Department of Public Service (DPS) Proceeding 15-E-0302technical conference Zero Emissions by 2040 highlighted concerns about this Gap resource gap and how it could be addressed. Besides the fact that the preferred candidate technologies have not been commercially proven, they all will be extraordinarily expensive. I believe that makes worst-case solutions impractical.
On the other hand, the alternative to ignore the worst case is unacceptable. In the net-zero fantasy world that is supposed to rely on wind and solar when heating and transportation is supposed to be electrified the need for reliable electricity is magnified. If we don’t provide resources for the observed worst case, when those conditions inevitably reoccur then there will be a blackout when electricity is needed the most to keep people from freezing to death in the dark because they are unable to flee.
The tradeoff between practicality and necessity is not going to be resolved by the resource adequacy planning groups doing the analyses described. I don’t think organizations like the New York State Reliability Council or NERC will make the decisions either. This is something that will have to be decided by politicians at the highest levels. Hopefully the problem will be considered in an open and transparent manner, but political lobbying pressures will be immense because the viability of the politically correct current plan to depend on wind and solar in New York and elsewhere is threatened.
Conclusion
I have long argued that New York should perform a feasibility study to determine if the net-zero outline to comply with the Climate Act in the Scoping Plan could possibly work. Francis Menton has convinced me that it would be better to do a demonstration project in some smaller jurisdiction to prove that it can work. The described tradeoff between the practicality of deploying resources for the observed worst-case resource deficit and the necessity to do so to prevent a catastrophic blackout should be a key consideration in either workability evaluation.
In my opinion any electric system that depends on wind and solar is impractical. Obviously, if the goal is a zero-emissions electric system then nuclear must be the cornerstone. If affordability is a concern, then the pragmatic acceptance of a large reduction in emissions rather than a zero target would allow the use of some natural gas as proposed by Russell Schussler and myself last year. Given the entrenched crony capitalists and special interests supporting wind and solar any shift in direction, even if necessary to protect health and safety, will be a tremendous lift.