A slightly different version of this post appeared at Watts Up With That. If this topic interests you I suggest that you check out the comments there too.
I recently posted an article describing how the Breakthrough Journal article by Jennifer Hernandez and Lauren Teixeira entitled Time to reset California’s climate leadership was relevant to New York State Climate Leadership & Community Protection Act (Climate Act) implementation. I agree with the authors that both states need to reevaluate their climate policies until the states can cut “emissions while assuring that home ownership, an affordable cost of living, and good jobs are available to all.” This post highlights a remarkable description of what is needed to reduce transportation sector emissions on the way to climate nirvana.
I am convinced that implementation of the New York Climate Act net-zero mandates will do more harm than good if the future electric system relies only on wind, solar, and energy storage because of reliability and affordability risks. I have followed the Climate Act since it was first proposed, submitted comments on the Climate Act implementation plan, and have written over 490 articles about New York’s net-zero transition. The opinions expressed in this article do not reflect the position of any of my previous employers or any other organization I have been associated with, these comments are mine alone.
Overview
The Climate Leadership & Community Protection Act (Climate Act) established a New York “Net Zero” target (85% reduction in GHG emissions and 15% offset of emissions) by 2050. It includes an interim 2030 reduction target of a 40% GHG reduction by 2030. Two targets address the electric sector: 70% of the electricity must come from renewable energy by 2030 and all electricity must be generated by “zero-emissions” resources by 2040. Since the completion of the Scoping Plan at the end of 2022 New York has been trying to implement the Scoping Plan recommendations through regulations, proceedings, and legislation.
California Climate Leadership
California was the first in the nation legislate a “solution” to climate change with its AB32 Global Warming Solutions Act of 2006. After fourteen years the inevitable effects of reality are getting the attention of the politicians that supported the law. Hernandez and Teixeira’s introductory paragraph explains that:
Faced with the election of Donald Trump to a second term, soaring inequality, and a decline in support from the state’s non-white majority, California’s Democratic leaders have begun asking hard questions about the state’s vaunted climate policies. California’s Democratic Assembly leader Richard Rivas opened the new Legislative session signalling a strong focus on meeting voter concerns about housing and the state’s extraordinarily high cost of living, specifically calling out the state’s climate policies: “California has always led the way on climate. And we will continue to lead on climate,” he told his Assembly colleagues. “But not on the backs of poor and working people, not with taxes or fees for programs that don’t work, and not by blocking housing and critical infrastructure projects. It’s why we must be outcome driven. We can’t blindly defend the institutions contributing to these issues.”
Hernandez and Teixeira compared several metrics for California, Florida, Texas, and the United States to determine how successful California’s claim to lead the way on climate has been. They explained that:
California’s claims to eco-superiority long predate the passage of AB32, the 2006 law that committed the state to ambitious climate targets and established a cap-and-trade system by which to achieve them. Even before this landmark bill, the state’s per capita carbon emissions were far lower than the national average.
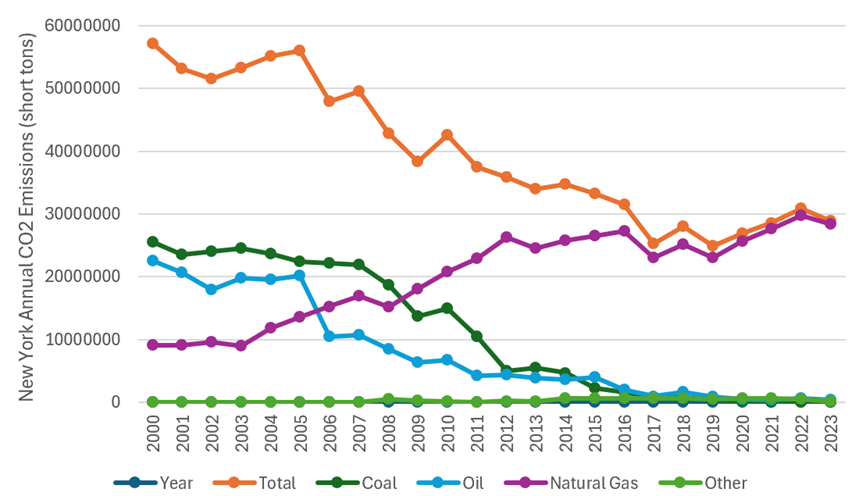
The authors show that a primary reason for California’s low per capita emissions was because their electric sector emissions were low to start. Texas and Florida reduced their electric sector emissions without climate policies because generating units “transitioned from coal to natural gas for largely economic reasons”. California’s climate policies limit future generation technologies to solar, wind, and battery storage. The unanticipated costs associated with deploying those technologies has made California electricity prices second only to Hawaii.
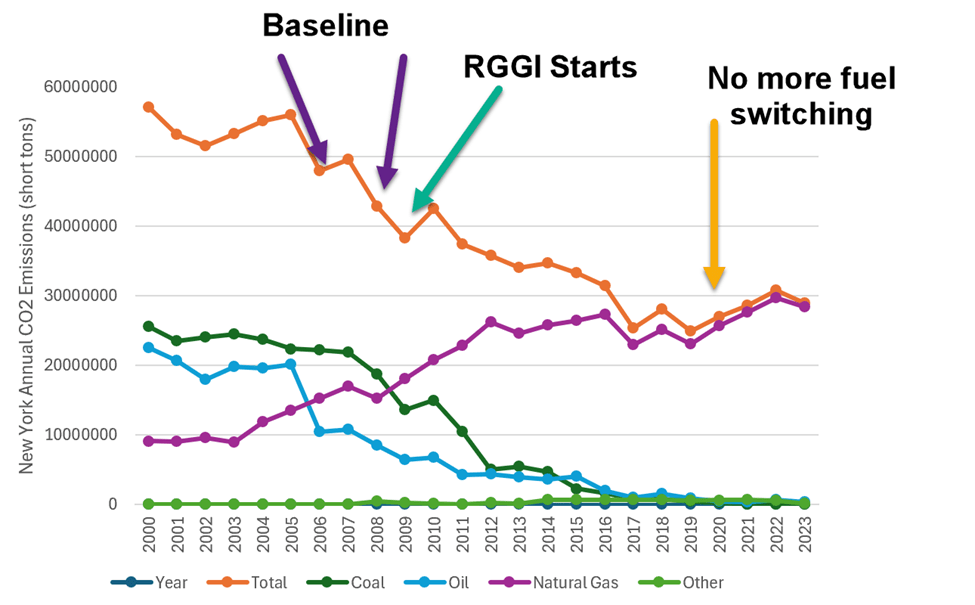
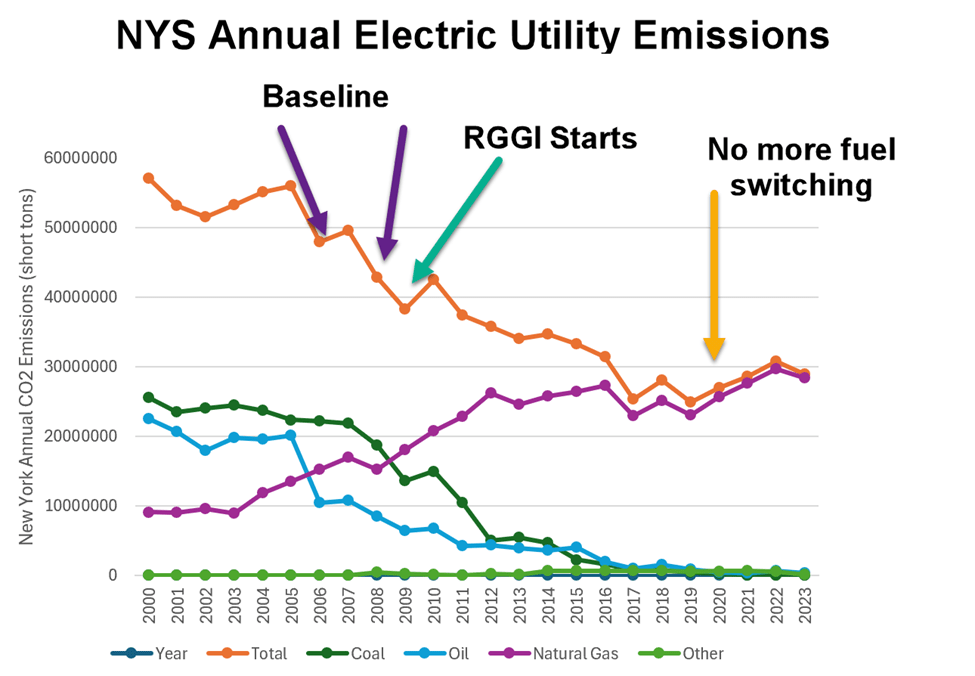
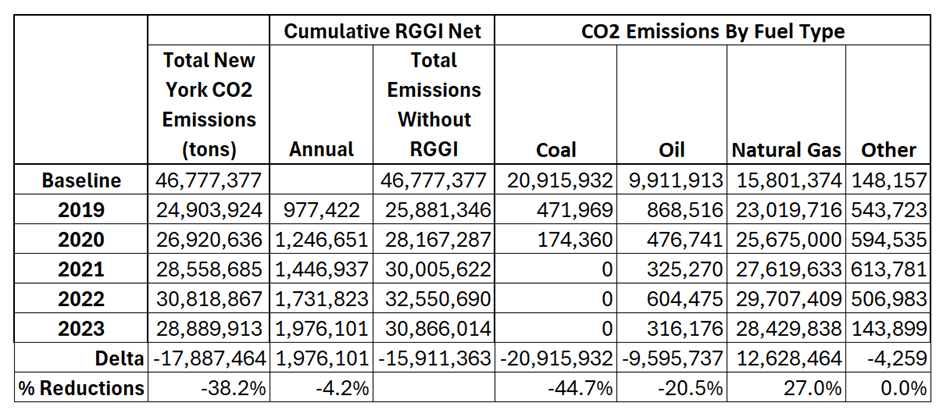
In my previous article I compared California to New York. New York observed emission reductions also occurred because of natural gas fuel switching. The deployment costs for wind, solar, and energy storage are starting to become obvious and will force rates up to compete with California and Hawaii as the most expensive. Another similarity is that both California and New York are going to have to find emission reductions from other sectors going forward. The sector with the most emissions in California is transportation and, because of the climate difference, the building sector has the highest emissions in New York. Transportation emissions are only slightly lower. This article highlights the description by Hernandez and Teixeira of what emissions reduction strategies are planned for the California transportation sector to meet their climate goals.
Transportation Sector Strategies
Hernandez and Teixeira raised an issue that has been acknowledged by New York agencies but very few understand the implications. Future emission reductions won’t come from the electric sector because the incremental benefits are small:
The rooftop solar and other signature California climate policy choices, despite their rising cost, increasingly brought diminishing returns, as much of the easy emissions reductions had already been realized, thanks to lower baseline electricity consumption and early adoption of natural gas. Carbon emission reductions from expensive new renewable energy additions were never going to be large. The state therefore increasingly prioritized aggressively reducing emissions from the transportation sector—the state’s largest source of emissions.
In New York the building sector is the largest source of emissions because of our climate. Nonetheless the Climate Act targets are so extreme that New York and any other jurisdiction that wants to go to net zero must eventually pursue the same aggressive transportation sector reduction strategies espoused by California:
Compared to places like Texas and Florida, California’s emissions reductions since 2006 have come disproportionately from the transportation sector, not the electricity sector. Low carbon fuel requirements, new regulations on refineries, and electric vehicle mandates, have collectively increased the cost of driving substantially. California routinely now has the second highest gas costs in the country second only to Hawaii, which must import all of its gasoline by ship. The state has mandated the phase-out of internal combustion engines in vehicles by 2035 and its gasoline prices now seems poised to surpass even Hawaii: a few days after the election, the California Air Resources Board (CARB) voted to further tighten the Low Carbon Fuel Standard, a measure that is expected to further increase gas prices by up to 85 cents per gallon.
I find it hard to believe that Californians are going to passively accept those massive increases in gasoline costs. But that is not all.
Even more ambitiously, California’s climate regulators have demanded that even after California converts to electric vehicles, local governments and regional planning agencies should reduce automobile use by 30%—a reduction in “vehicle miles travelled” that would be 2.5 times greater than the decline in miles driven during the depths of the Covid pandemic lockdown. To achieve this objective, CARB recommends and provides funding for local governments to eliminate traffic lanes through so-called “road diets,” intended to increase drive times and traffic congestion and incentivize use of public transit, even as massive investments in public transit have failed to reverse ridership declines that began pre-COVID and have caused massive transit system operating deficits.
Discussion
The mother of all reality slaps is coming to the regulators that think that road diets will be accepted by citizens. Public transit is fine in concept, but the reality is that our society is now dependent upon personal transportation for most of the country. One hundred years ago there was an extensive network of trolley and interurban railroads in every city and the cities were compact enough that this transit option was viable. By viable I mean that people could get from where they lived to where they worked using transit in a reasonable amount of time. However, one hundred years ago those trolley systems started to go out of business because relying on public transit is inconvenient. Most of those systems are gone now. Even when replaced by bus systems, the fact is that public transit takes more time and using it forces you into a schedule. Over the last 100 years development has spread out and the ability for public transit to get many people from where they live to where they work is limited to major cities. This makes personal transportation demand inelastic. Only fools think that road diets are going to incentivize the use of public transit. This affects the emission reduction goals because the reductions in transportation sector emissions envisioned are never going to happen.
Conclusion
I hope that frequent visitors to my blog are aware of the difficulties associated with the net-zero transition plans imposed by reality. When you are aware of the physical challenges the inevitable impacts on personal choice and quality of life of the transition policies become evident. Unfortunately, most people are unaware of what is coming at them.
The public is faced with incessant propaganda that there is an existential climate crisis that is evident in every extreme weather event. All they hear is the lie that fixing the weather is only the simple matter of stopping the use of fossil fuels which will be cheaper, more resilient, more secure, and improve the quality of life.
California fossil fuel transition plans include policies “intended to increase drive times and traffic congestion and incentivize use of public transit”. Eventually that will seep into the consciousness of the public. I cannot imagine a scenario where this will not create massive blowback. Will the charade end in California when the wind and solar system causes a massive blackout or when Californians are required to pay 85 cents more per gallon, or they are required to give up personal transportation options? Hopefully California will hit the green transition wall soon enough and hard enough that New York policies will change before the impacts seen there inevitably arrive here.