PEAK Coalition Peaker Plant Disconnects

On February 6, 2024 the PEAK Coalition sponsored a webinar entitled “Replacing NYC’s Peaker Plants With Clean Alternatives: Progress, Barriers, and Pathways Forward” that follows up on their recent report: Accelerate Now! The Fossil Fuel End Game 2.0.  There are disconnects between the findings of that report and the first webinar of this year’s New York Cap-and-Invest (NYCI) Program stakeholder engagement process: The Role of Cap-and-Invest (slides and webinar video) and the material presented at the Department of Public Service Proceeding 15-E-0302 technical conference held on December 11 and 12, 2023 entitled Zero Emissions by 2040.    

I did not intend to write so much about this topic but Pragmatic Environmentalist the Baloney Asymmetry Principle came into play.  Alberto Brandolini has explained that: “The amount of energy necessary to refute BS is an order of magnitude bigger than to produce it.” My apologies for the length.

I have followed the Climate Leadership & Community Protection Act (Climate Act) since it was first proposed, submitted comments on the Climate Act implementation plan, and have written over 380 articles about New York’s net-zero transition. The opinions expressed in this post do not reflect the position of any of my previous employers or any other organization I have been associated with, these comments are mine alone.

Overview

The PEAK coalition has stated that “Fossil peaker plants in New York City are perhaps the most egregious energy-related example of what environmental injustice means today.”  The influence of this position on current New York State environmental policy has led to this issue finding its way into multiple environmental initiatives. I have prepared a summary of this issue for this blog that explains why the presumption of egregious harm is based on selective choice of metrics, poor understanding of air quality health impacts,  and ignorance of air quality trends.  The page documents my concerns based on my extensive experience with air pollution control theory, implementation, and evaluation over my 45+ year career as an air pollution meteorologist.  Before I discuss their latest report and the webinar I provide some background information from the Role of Cap-and-Invest webinar and the Zero Emissions by 2040 technical conference.

Relevant “Role of Cap-and-Invest” Webinar Findings

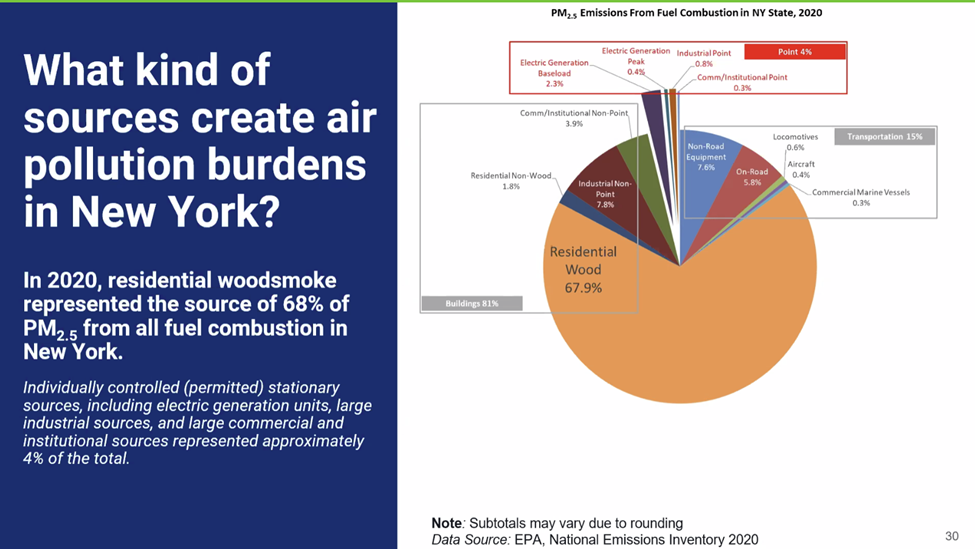
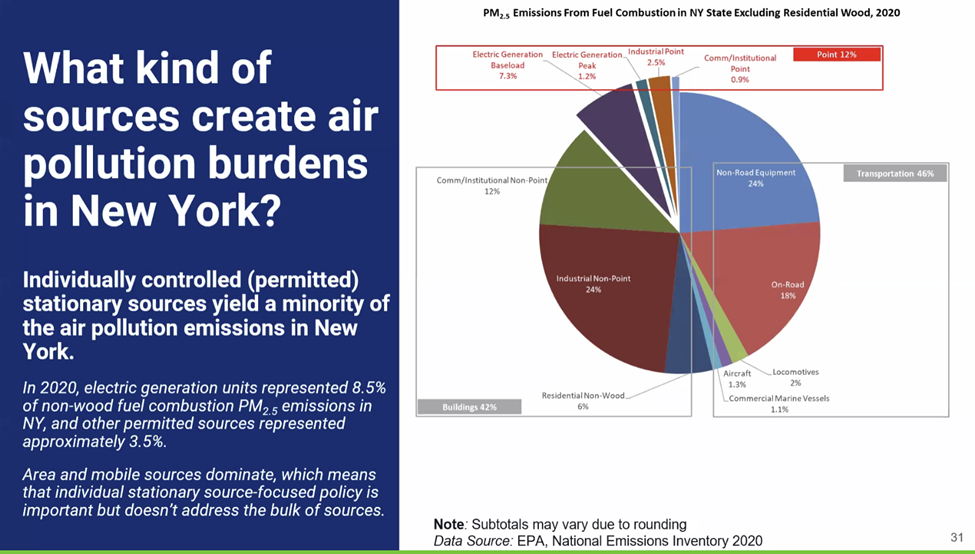
I explained in my post on this webinar that the “Current Emissions” section of the webinar set the stage for the webinars that covered  emissions and costs.  One of the primary points made was that inhalable particulate (PM2.5) emissions are primarily from non-peaking power plant sources.  The following slide shows that “Individually controlled (permitted) stationary sources, including electric generation units, large industrial sources, and large commercial and institutional sources represented approximately 4% of the total.”

The next slide in the webinar described the sources that create inhalable air pollution burdens in New York.  It points out that:

  • Individually controlled (permitted) stationary sources yield a minority of the air pollution emissions in New York.
  • In 2020, electric generation units represented 8.5% of non-wood fuel combustion PM25 emissions in NY, and other permitted sources represented approximately 3.5%.
  • Area and mobile sources dominate, which means that individual stationary source-focused policy is important but doesn’t address the bulk of sources.

The webinar slides also explicitly address power plant emissions in New York.  The next slide addressed electricity sector emissions.  It states that:

  • Existing policies will go a long way to addressing sources of emissions in the electric sector.
  • RGGI, the Clean Energy Standard, and other programs will substantially reduce the use of fossil fuels for our electricity needs.
  • The Peaker Rule will ultimately retire the most polluting plants in New York. 35 peaking units representing 955 MW have already retired and an additional 265 MW are expected to retire in 2025.
  • NYCI cannot be designed to compel the closure of individual generators, and pricing may not reduce the use of peaking facilities.

Relevant Zero Emissions by 2040 Technical Conference Findings

Unfortunately, the Public Service Commission has not announced availability of a recording of the Zero Emissions by 2040.  technical conference held on December 11 and 12, 2023 so details are still not available.  I published a summary of  the presentation given by Zachary Smith from the New York Independent System Operator (NYISO) describing a new category of generating resources called Dispatchable Emissions-Free Resources (DEFR) that are needed to keep the lights on during periods of extended low wind and solar resource availability.  It is important to note that the meteorological conditions that cause the low wind and solar resource availability also are the same that cause the highest load peaks.  As a result, DEFR will eventually be needed to replace peaking power plants.

I think the ultimate problem for reliability in an electric system that depends on wind and solar is illustrated in the following slide from Smith’s presentation.  It highlights a 7-day wind lull when the average wind capacity is 25%.  The sum of the grey area under the load curve during that period is the amount of energy (MWh) that must be provided by DEFR sources based on an analysis of historical weather data. Note that the load curve peaks during the low wind and solar resource availability drought.   If there are insufficient resources during a wind lull, then electric load cannot be met, and a blackout will occur.

Zachary Smith included a slide (shown below) that describes the generating resource expected for the Climate Act to make the point that a large amount of new generating resources needs to be developed.  Note that in both scenarios the amount of DEFR required (purple column) is on the order of the current existing fossil capacity (orange column). 

Accelerate Now! The Fossil Fuel End Game 2.0

The web page announcing the availability of  Accelerate Now! The Fossil Fuel End Game 2.0   states:

New York City has the densest concentration of urban power plants in the US, impacting the health of 750,000 New Yorkers and increasing the cost of electricity for all utility customers.

The PEAK Coalition — UPROSE, THE POINT CDC, New York City Environmental Justice Alliance (NYC-EJA), New York Lawyers for the Public Interest (NYLPI), and Clean Energy Group (CEG) —aims to end long-standing pollution from fossil fuel peaker power plants and the negative effects on New York City’s most climate-vulnerable people.

In a new report, the PEAK Coalition documents progress made since the coalition was founded and examines the steps taken by state, city, utility, and energy industry stakeholders to hasten or delay the shift from polluting power plants to clean, zero-emissions alternatives. The report, “Accelerate Now! The Fossil Fuel End Game 2.0“, details evidence of encouraging progress, with 700 MW of the city’s peaking capacity fully retired and announced plans for the retirement of an additional 3,300 MW before 2040, representing nearly two-thirds of the city’s fossil peaking capacity. However, the transition has not progressed at the pace needed to protect the health of environmental justice communities and meet the state’s climate goals. More than 75 percent of the city’s dirty and inefficient fossil peaker capacity may remain online and operating beyond 2025, when stricter peaker plant emissions limits are intended to take full effect. In this webinar, hosted by CEG for the PEAK Coalition, report authors will discuss the negative impacts these power plants are having on surrounding communities, highlight progress and barriers impeding the speed of the transition, and recommend pathways forward to accelerate the transition from peaker plants to clean alternatives.

Below I describe some of the points that the author saw fit to highlight and compare this work to the NYCI webinar and DEFR conference.

Disclaimer

This document is a perfect example of grey literature.  Grey (or gray) literature is defined by the Cochrane Handbook for Systematic Reviews of Interventions as “…literature that is not formally published in sources such as books or journal articles.” “This can include information such as government reports, conference proceedings, graduate dissertations, unpublished clinical trials, and much more.“  The key point with respect to grey literature is that anyone using must independently check the analysis.  If the data, methodology, and results are not transparently available, then the results should be questioned.

It is troubling to me that references to previous reports from the Peak Coalition have not recognized that the work did not fully disclose the data, methodology, and results, was not peer-reviewed, or disclose that it was not endorsed by the Department of Environmental Conservation (DEC). In that regard it is interesting that a new disclaimer section is included in this report that states:

This document is for informational purposes only. The authors make no warranties, expressed or implied, and assumes no legal liability or responsibility for the accuracy, completeness, or usefulness of any information provided within this document. The views and opinions expressed herein do not necessarily state or reflect those of funders or any of the organizations and individuals that have offered comments as this document was being drafted.  The authors alone are responsible for the contents of this report. Before acting on any information, you should consider the appropriateness of the information to your specific situation.  The information contained within is subject to change. It is intended to serve as guidance and should not be used as a substitute for a thorough analysis of facts and the law. The document is not intended to provide legal or technical advice.

It would be interesting to know why this was added because it clearly expresses my concerns with its contents.

Highlights of the Document Fossil Fuel End Game 2.0

Most of the technical aspects of this document I have already addressed in previous posts.  The PEAK Coalition report entitled: “Dirty Energy, Big Money” describes the original analysis designed to vilify all New York City peaking power plants.  I described that work in three posts.  I published a post that provided information on the primary air quality problem associated with these facilities, the organizations behind the report, the State’s response to date, the underlying issue of environmental justice and addressed the motivation for the analysis.  The second post addressed the rationale and feasibility of the proposed plan to replace these peaking facilities with “renewable and clean energy alternatives” relative to environmental effects, affordability, and reliability.  Finally, I discussed the  Physicians, Scientists, and Engineers (PSE) for Healthy Energy report Opportunities for Replacing Peaker Plants with Energy Storage in New York State that provided technical information used by the PEAK Coalition.

For this article I am going to respond to some of the highlighted sections in the report.  For example, one of the big issues in the Dirty Energy, Big Money report is highlighted:

Analysis of capacity payments found that an estimated $4.5 billion in ratepayer dollars flowed to the owners of the city’s fleet of peaker plants over a decade. These exorbitant payments to peaker plant owners make electricity from New York City’s fossil fuel peaker power plants some of the most expensive power in the country.

This is a good example of poor understanding of the role of peaking power plants by the PEAK Coalition.  These facilities operate for a small percentage of the time (typically less than 5%) but fulfill a critical reliability support function.  They only run during peak load periods when insufficient generation resource adequacy could lead to a blackout.  The power market pays the highest prices during peak load periods in part because these facilities must get support for all their annual operating costs during the limited periods.  The Coalition does not acknowledge the tradeoff that without the peaking units, there will be blackouts.

The Peak Coalition narrative relies on emotion.  There is a specially highlighted section entitled: “Peakers and a Legacy of Community Harm:  A Story from the Bronx” written by Victor Davila, Community Organizer, THE POINT CDC;  He writes:

The people of the South Bronx share a universal trauma. Whatever the particulars of their life circumstances, every child growing up in the South Bronx is acutely aware that the city does not care about them. The moment they step outdoors, it is clear that their neighborhoods are unimportant to the city. The infrastructure reflects historical scorn for their existence. The Bronx burned for a decade in the 1970s and 1980s, and city officials stood by and watched. Landlords set fire to buildings for insurance, and in reaction, local legislators slashed fire department funding to the Bronx in the hopes of driving residents out.

But thanks to the strength of community members, the spirit of the Bronx was able to resist the decade of fire; however, since then its infrastructure has continued to slowly choke the health of its residents.

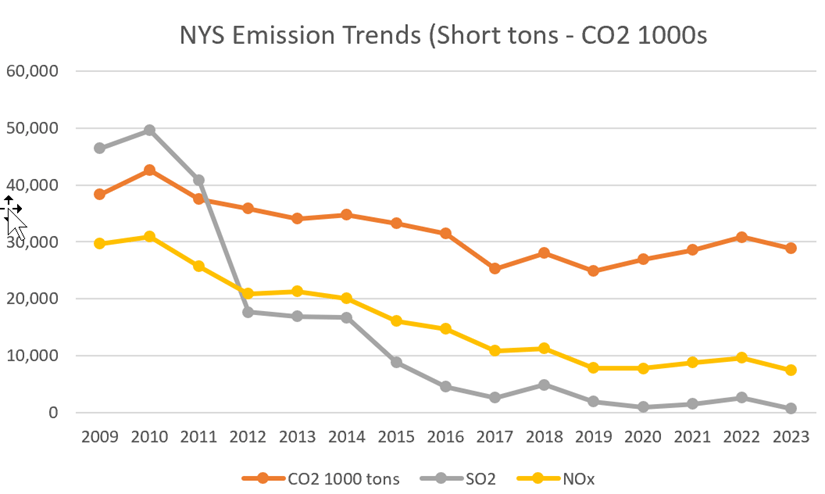
There is no question that there has been disproportionate harm to disadvantaged communities (DACs), but the emotional implication of this text is that it has been the result of a deliberate action by outsiders.  Never mentioned in the Peak Coalition reports is that there have been marked improvements in air quality and that most DACs are in compliance with most National Ambient Air Quality Standards. Instead, the report highlights asthma effects: “In the Hunts Point neighborhood of the Bronx, one in every three children and one in every four adults suffer from asthma.”

The number of confounding variables associated with asthma is very large including things like smoking and indoor air quality. One inconsistency never reconciled by the Peak Coalition is why asthma rates are increasing at the same time air quality is improving.

Another highlighted section notes that: “In 2022, 7 percent of the electricity produced in upstate New York came from oil and fracked gas, whereas more than 95 percent of electricity produced in and around New York City came from oil and gas plants.”

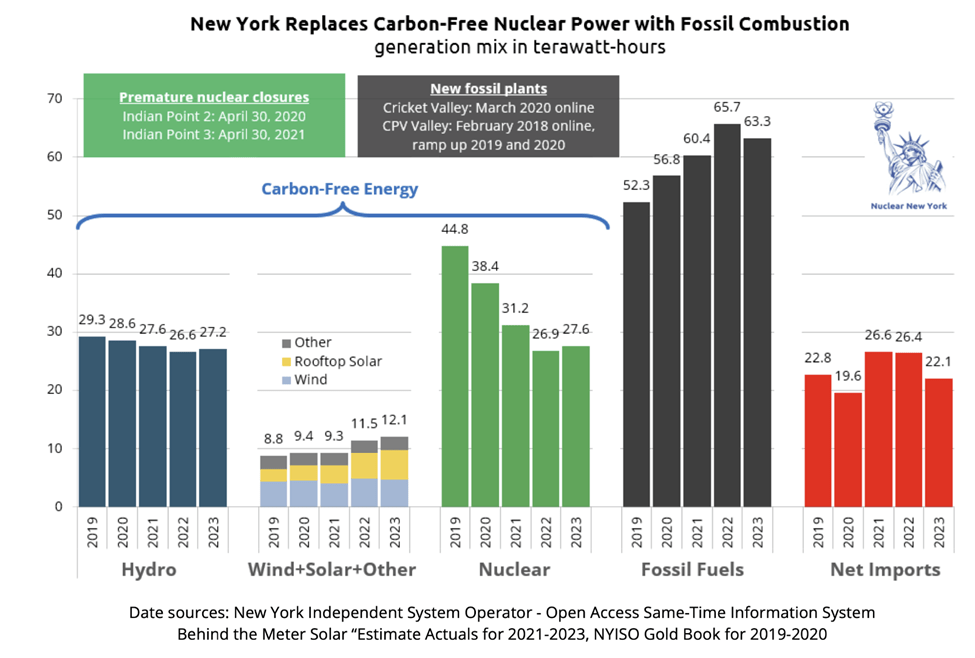
This is another example of a poor understanding of the electric system and tradeoffs associated with the peaking units.  Upstate load is near the hydro projects on the Niagara and St Lawrence Rivers and four nuclear power plants so oil and gas is not needed as much as in the City where these same groups cheered on the closure of 2,000 MW of zero-emissions nuclear power.  In addition, there are specific reliability rules for in-city generation limit the amount that can be transmitted into the City.  The rules were added because insufficient in-city generation caused the 1977 blackout.  Lightning strikes abruptly reduced the amount of generation transmitted into the city and the in-city power plants were unable to ramp up load in time to prevent the blackout.  The quick start capability of many of the peaking units is a service that must be replaced before all units can retire.

Progress to Date Chapter

The Peak Coalition admits that the New York State Department of Environmental Conservation (DEC) has recently adopted the so called “Peaker Rule” that sets more stringent ozone season NOx emissions limits for simple cycle and regenerative combustion turbines that will eventually phase out old, inefficient, and relatively dirty units.  A highlight points out that: “Replacing and retiring these older fossil units could reduce 1,849 tons of NOx emissions on some of the highest ozone days of the year, with its biggest impact felt in nearby communities.”

A point of clarification is that the tonnage refers to the annual total emissions not daily totals.  It is also important to note that the emission limits include specific reliability provisions that affect implantation timing.  The units can only be retired if the New York Independent System Operator (NYISO) signs off that they will not be needed for resource adequacy.

A prominent argument in this report is summarized in this highlight: “Despite the Peaker Rule taking full effect, New York City may still have more than 75 percent (4,591 MW) of its fossil peaking capacity online and operating in 2025.”  The tradeoff between keeping these units online and operating and their contribution to keeping the lights on is not emphasized.

Generating Company Plans

From what I can see, the advocates representing the Peak Coalition will be satisfied with nothing less than zero-emissions.  The report addresses each company that has power plants in New York City and includes the following quotes from the highlights in each section:

“We remain steadfast in our fight for an emissions-free future for Asthma Alley residents and all New Yorkers in line with New York’s climate goals.” – Daniel Chu

“Can NYC become the first city in the nation to have all its peaker plants replaced? We believe we can—especially if we follow the visionary direction established by the New York State Climate Leadership and Community Protection Act.” – Eddie Bautista

I think there is a disconnect between what the Peak Coalition thinks this represents and the electric market itself.  The report sums up Eastern Generation plans as follows:

In June 2022, the PSC approved Eastern Generation’s permit to build a 135-MW energy storage system at the Astoria Generating Station facility. In a statement about the approval, Eastern Generation again noted that the company is planning to submit applications for additional storage projects at Gowanus and Narrows, totaling 350 MW of energy storage capacity across the two sites. Eastern Generation has submitted a deactivation notice to NYISO for the 16-MW peaker at the company’s Astoria facility; however, the Peaker Rule does not apply to the three 60-year-old steam turbines at the site. It is unclear whether the development of battery storage at the site will result in the retirement of these peaking units, which have a combined capacity of 943 MW.

Under the existing market dynamic, Eastern Generation is proposing to redevelop its assets at the Gowanus, Narrows and Astoria Generating Station locations.  In a de-regulated market developers like Eastern Generation make development decisions based on the market situation which currently favors energy storage assets.  Importantly, they have no responsibilities for system reliability.  On the other hand, the NYISO must ensure that sufficient resources are available. 

There is an important technical qualifier for this discussion that needs to be clarified.  All of the numbers provided in the quoted section refer to the instantaneous electric power available from the facilities or the capacity as rated in MW.  Consumers pay for energy used per month in kWh.  The NYISO resource adequacy planning is also primarily concerned with electric energy in MWh which is 1000 kWh.  The existing capacity at the Eastern Generation facilities totals 1,915 MW of nameplate capacity and they can run 24 hours a day during extreme load conditions so can produce 45,960 MWh of energy.  The proposed energy storage capacity is just 350 MW and current energy storage lasts only four hours, so the total energy production is a paltry 1,400 MWh or 32 times less potential available energy than the existing facility. The lower energy availability is not Eastern Generation’s problem but is the crux of the NYIOSO resource adequacy concerns for New York City.  

I don’t think the Peak Coalition understands the implications of the difference between capacity and energy.  The report states:

“These findings support previous reports put out by PEAK—that battery storage could replace

the operations of each individual NYPA peaker power plant in NYC, coupled with clean renewable energy sources on the grid, by 2030”. – Eddie Bautista

Next, I will review the report’s section on transition challenges that provides the support for this statement.

Challenges Impeding the Transition

Supporters of the Climate Act maintain that the net-zero transition is only a matter of will.  The introduction for this chapter notes that “market barriers, regulatory obstacles, and other challenges have slowed progress and threaten the state’s ability to meet its climate mandates.”  There is no indication that the challenge identified previously, or the issues raised at the Public Service Commission technical conference have been considered in the analysis.

The report correctly notes that as sectors reduce their GHG emissions by electrification the inevitable result is increasing demand.  The report downplays the effect. 

However, increased electrification also represents an opportunity to shift and shape demand in new ways. The timing of EV charging is often flexible, with most vehicles just sitting around most of the time.  This creates an opportunity to shift charging to times when demand is lower and renewable generation is plentiful. Many high-power building loads, such as heating and cooling, can also be automatically adjusted to shift the majority of electricity demand to non-peak times while maintaining comfortable temperatures for occupants.

In my opinion, the biggest problem with all the net-zero technology solutions proposed including these, is that they don’t work all the time.  EV charging is “often” flexible, but during the coldest periods charging does not work as well so EV owners are going to want to charge when electric heating demand is highest.  The opportunity to shift charging to times when “renewable generation is plentiful” ignores the intermittency problems with renewables in general and the worst-case high load and low availability conundrum. Shifting heating and cooling loads to non-peak times presumes that consumers will lose control of their ability to choose their comfort levels.  Details matter for these claims!

The report argues that virtual power plants are a potential solution.  A highlighted section notes:

Unlike nearby states that have implemented statewide customer battery storage programs to meet peak demand, New York has yet to realize the important role that virtual power plants can play in reducing reliance on fossil peaker plants.

The implication that New York is not considering this option is incorrect.  I am very pessimistic about the technology but I could be convinced otherwise if the Department of Public Service Proceeding 15-E-0302 that is addressing the technology determines that it is feasible.  Until then claiming that this technology is a suitable replacement for existing peaking power plants is premature.

The report addresses reliability with another highlighted section:

“UPROSE, alongside the PEAK Coalition, is deeply concerned by the NYISO Reliability Report.  Emergency rooms get full, and the work and school day is interrupted because of the health impacts our communities have suffered from peaker plant pollution for too long. The 2025 energy reliability gap highlights the urgent need for a swift transition to clean, equitable energy solutions like renewable generation and storage. We urge the state to act decisively in accelerating this transition and ensuring environmental justice for the most vulnerable.” – Elizabeth Yeampierre

There are two problems with this characterization.  The first is the mistaken idea that no new technology is needed for the net-zero transition.  The Climate Act Integration Analysis, the NYISO resource adequacy evaluations, and the Department of Public Service Proceeding 15-E-0302 all argue otherwise because they point to the need for new DEFR.

The other problem with this is the emotional argument that peaker plant pollution is the root cause of the alleged health effects.  The “Role of Cap-and-Invest” webinar confronted this misconception and dismissed the claim.  The analysis found that “Individually controlled (permitted) stationary sources, including electric generation units, large industrial sources, and large commercial and institutional sources represented approximately 4% of the total”; for inhalable air pollution burdens in New York “Area and mobile sources dominate, which means that individual stationary source-focused policy is important but doesn’t address the bulk of sources”; and “Existing policies will go a long way to addressing sources of emissions in the electric sector.”  The point that “individual stationary source-focused policy is important but doesn’t address the bulk of sources” explicitly contradicts the idea that focusing on peaker power plants will have a discernible effect.  In fact, it could have a negative effect by mis-allocating resources to a lower impact problem.

The reliability section also includes this highlight:

All of New York City’s projected load growth and peak demand needs could be reliably met, hour-by-hour, with the right mix of renewables, short-duration battery storage, and efficiency.

This is another statement that contradicts the Integration Analysis, NYISO resource adequacy analyses, and the Department of Public Service Proceeding 15-E-0302 that all conclude that DEFR is needed for a reliable electric system.

In 2023 delays in renewable energy development due to supply chain issues, interest rate increases, and contract negotiations have slowed the pace of renewable developments that could be used to displace the peaking units.  A statement from the POINT CDC, UPROSE, and NYC-EJA highlights their concerns with renewable energy economics:

Significant delays for critical renewable energy projects disproportionately impact the health and well-being of communities suffering from fossil fuel power generation. More years of poor air quality will only exacerbate poor health outcomes for Black and Brown communities, and other communities of color. It is also a lost opportunity for a Just Transition for places like Sunset Park and Hunts Point, where offshore wind projects may be a transformative opportunity to ensure that communities most impacted by pollution can grow and flourish under a new green re-industrialization.

The report does not make specific recommendations how this can be resolved but says “These unforeseen interruptions and economic uncertainties must be addressed by the state to ensure that fossil peaking resources are still able to retire on time or even ahead of schedule.”  I suspect that this is easier said than done.

The report admits that there are challenges to replacing the peaking power plants in New York City. 

In addition to limited space for large-scale renewable energy and energy storage development within the city, New York City has some of the strictest building codes and zoning regulations in the country. These stringent regulations add cost and complexity to the development of solar and energy storage and the implementation of building efficiency measures. Fire department setback and clearance requirements limit the availability of rooftop space for solar panels, and energy storage fire code regulations continue to prevent lithium-ion batteries from being installed indoors, severely curtailing commercial storage development.

The report suggests that these regulatory constraints rather than the limited space and higher in-city development costs are the reason that in-city buildout of clean energy resources in New York City has lagged the rest of the state.  I disagree with the suggestion in the report that the “perceived” safety concerns should be revised to accelerate development because I think safety risks are more significant than the report acknowledges and the other factors affecting in-city generation will still slow development relative to the rest of the state.

The section titled “False solutions” epitomizes the single-minded devotion to the demand for zero emissions.  The idea that compromise and tradeoffs might lead to a pragmatic lower emissions solution is not acceptable to the ideologues because there still would be some emissioins.  The highlight for this section states:

Misguided support for polluting false solutions, such as burning blue or green hydrogen and RNG in power plants, has served as an unnecessary distraction that threatens the state’s ability to achieve its emissions goals mandated by the Climate Act.

False solutions is a commonly used slogan to vilify any technology that does not comport with zero-emissions dogma.  Although there are emissions associated with hydrogen combustion and renewable natural gas there are benefits for their use.  The placeholder technology for DEFR in the Climate Act Scoping Plan is green hydrogen but it is not commercially viable currently.  On the other hand, the technology to burn it in combustion turbines to generate electricity is viable.  The ideologues demand that the hydrogen be used in fuel cells which is another technology not in commercial use at the scale needed.  This ideological demand makes the DEFR challenge using hydrogen for nthe net-zero transition that much more difficult.

Furthermore, the motives of those who suggest more practical solutions are questioned.  Even the widespread support for an analysis of DEFR is characterized as a fossil fuel lobbying effort:

However, at the request of the Independent Power Producers of New York, a trade group representing owners of the state’s fossil fuel power plants, the PSC has initiated a process to “examine the need for resources to ensure the reliability of the 2040 zero-emissions electric grid mandated by the Climate Leadership and Community Protection Act” and is seeking input on how to define zero-emissions, including whether the definition should include green hydrogen.

The highlight for that section notes:

Fossil fuel interests and legacy power plant and pipeline owners continue to push for ways to continue operating existing infrastructure and perpetuate reliance on fossil fuels.

The fact is that until we have suitable replacement technology premature retirement of fossil fuel infrastructure risks serious impacts.  The perspectives described are not conducive to developing sound energy policy. As a result, I am not going to bother describing the Peak Coalition’s ideas for a path forward. 

The final highlighted section states:

The clean energy transition does not mean sacrificing the reliability of the electric grid, and ensuring the reliability of the grid should not mean sacrificing the health and well-being of New Yorkers.

This is a slogan from biased ideologues who do not understand the complexities of the electric system.  I have no doubt that premature shutdown of peaking power plants without acceptable DEFR technologies available will adversely affect the reliability of the electric grid.

Discussion

There are disconnects between the Peak Coalition Fossil Fuel End Game 2.0 report and the findings of the NYCI webinar “The Role of Cap-and-Invest” and the material presented at the Department of Public Service technical conference Zero Emissions by 2040.   The rationale that peaking power plants are responsible for all the health effects claimed by the Peak Coalition is contradicted by the DEC/NYSERDA analysis reported in the webinar.  The reality is that other emission sources are a much more likely source of health effects. The report states that all the technology necessary is available which contradicts the webinar and PSC proceeding on DEFR and casts aspersions on the motives of the organizations responsible for reliability.   

The importance of the PSC proceeding should not be underestimated.  The Integration Analysis and all the projections by the NYISO pointed to this need and the Public Service Commission recognized that there are fundamental unanswered questions that need to be addressed.  DEFR is a recognized response to the problem that the meteorological conditions that cause the low wind and solar resource availability also are the same that cause the highest load peaks.  The Peak Coalition report does not recognize that until adequate DEFR technologies are available and deployed it would be inappropriate to retire any more of the peaking power plants.

It is very frustrating that the environmental justice advocates do not prioritize prevention of blackouts as much as the organizations responsible for reliability.  Victor Davila, Community Organizer, The Point CDC claimed that “The Bronx burned for a decade in the 1970s and 1980s, and city officials stood by and watched”.  The picture of Davila on the staff page for the The Point CDC looks like he is younger than 46 so has no firsthand knowledge of the impact of the 1977 blackout which included fires in the Bronx.

Consider the effects of the 1977 blackout:

The impact of the 1977 blackout was felt long after the lights came back on: The blackout cost the city more than $300 million, both directly and indirectly. In neighborhoods affected by burning buildings or looting, the recovery process was lengthy—in some places, it took years to recover. And the blackout led Con Edison to “move[] to avoid the mistakes that led to the blackout, adding sophisticated monitoring equipment and modifying the flawed procedures that drew public acrimony and thousands of lawsuits, some still unsettled,” according to a New York Times article from 1987.  

—–

In some places—perhaps most memorably, Bushwick and parts of the Bronx—the extended power outage led to looting and instances of arson.

The effects of an extended blackout are immediate, acute, and, in my opinion, a greater threat to disadvantaged communities than peaking power plants.  The Peak Coalition Fossil Fuel End Game 2.0 report does not adequately account for the complexities of the New York City electric system.  Zach Smith’s presentation on DEFRs at the PSC technical conference outlined the need for this resource.  There was a panel discussion that addressed other relevant issues, but the recording is not available.  One point made was that the location and capacity of generating resources matters.  Given the spatial power density of the peaking power plants relative to the proposed energy storage solutions the possibility that they cannot be replaced cannot be dismissed.

Conclusion

Peak Coalition members passionately want the best the communities that they represent.  I do not think that electric energy policies that risk reliability and, affordability for that matter, are properly prioritized in their report.  The complete focus on peaking power plants is simply not in the best interest of the communities that they purport to represent.

Nonetheless, appeasing these environmental advocacy organizations is a priority for the Hochul Administration. Unfortunately, I do not think that the ideologues will ever be satisfied with anything less than their demands. Their demands are incompatible with a reliable electric system. It will be fascinating to see how this plays out.

Articles of Note February 4, 2024

I have been so busy lately with net-zero transition implementation issues that I have not had time to put together an article about relevant posts I have read.  This is a summary of posts that I think would be of interest to my readers.

I have been following the. Climate Leadership & Community Protection Act (Climate Act) since it was first proposed and most of the articles described below are related to the net-zero transition.  I have devoted a lot of time to the Climate Act because I believe the ambitions for a zero-emissions economy embodied in the Climate Act outstrip available renewable technology such that the net-zero transition will do more harm than good. The opinions expressed in this article do not reflect the position of any of my previous employers or any other company I have been associated with, these comments are mine alone.

Videos

Energy and Illusions:  Power density – Lots of resources going in, not much energy coming out means a resource that is never going to work

Hurricanes and Global Warming: Dr Neil Frank talks about climate change and the biggest storms on earth.

Isuru Seneviratne from Nuclear New York suggested a video series that I also highly recommend. 

This 5-piece docu-series as ESSENTIAL as we advocate for climate policies that do not disproportionately harm the poor. It’s a riveting wake-up call made by independent thinkers who dig deep beneath the gaslighting that goes on from Enron to German “Greens.” 

https://www.youtube.com/@JuiceTheSeries

Juice: Power, Politics, And The Grid is a five-part documentary series produced by two Austin-based filmmakers, Tyson Culver and Robert Bryce, that follows the success of their first film: Juice: How Electricity Explains the World, which is now available on streaming platforms around the world.

The series takes viewers from Texas to Tokyo to expose the perils facing our electric grid. It shows how we can improve the reliability of our most important energy network and address climate change by embracing nuclear energy.

Juice: Power, Politics & The Grid features interviews with top thought leaders, including historian Patty Limerick, political scientist Roger Pielke Jr., journalist Michael Shellenberger, civil rights leader Robert Apodaca, World Nuclear Association director Sama Bilbao, Sacramento County Sheriff Jim Cooper, Canadian nuclear activist Chris Keefer, author Meredith Angwin, former IEA director Nobuo Tanaka, Campaign for a Green Nuclear Deal founder Madi Hilly, and many others.

While offering a sober assessment of the challenges facing the $5 trillion-per-year global electricity business, the series concludes with a hopeful look at the future — and the future of climate change — by featuring the activists who are helping fuel renewed interest and investment in nuclear power here in the U.S. and around the globe.

Electric Vehicles

I have planned to put together a post on electric vehicles for weeks but did not get around to it.  This post at Irina Slav’s substack Irina Slav on energy summarizes most of the points I wanted to make in my planned article better than I would have done.  She sums up the issues:

In a commentary piece for MarketWatch earlier this month, former White House director of economic policy Todd G. Buchholz compared EVs to electric bread makers, arguing that, just like bread makers, EVs are a fad that will eventually fade.

“The 1990s bread-machine fad never benefited from public subsidies, government mandates or furious discounting to gain market share. If it had, perhaps it would have continued for a few more years,” Buchholz wrote, going on to quote President Dwight Eisenhower as saying that “you don’t lead by hitting people over the head: That’s assault, not leadership.”

Here is another article describing problems in the EV industry.

Offshore Wind

Another topic that I have been meaning to address is the current state of offshore wind.

Bud’s Offshore Energy (BOE) “Energy Production, Safety, Pollution Prevention, and More” delves into the details of offshore wind development.  He recently reviewed the Bureau of Ocean Energy Management and National Oceanic and Atmospheric Administration Fisheries North Atlantic Right Whale and Offshore Wind Strategy.  His key takeaways:

The document effectively summarizes the dire state of the North Atlantic Right Whale.

  • The BOEM/NOAA strategy is to monitor and further assess the impacts.
  • The need for mitigation will be determined through collaborative processes.
  • This industry-friendly strategy contrasts sharply with the restrictive operating requirements proposed for the more speculative Rice’s whale expanded area in the Gulf of Mexico.

He describes the status of the Right Whales:

NARW status (pages 7-14):

  • Roughly 237 NARWs have died since the population peaked at 481 in 2011, exceeding the potential biological removal (PBR) level on average by more than 40 times for the past 5 years (Pace III et al. 2021).
  • Human-caused mortality is so high that no adult NARW has been confirmed to have died from natural causes in several decades (Hayes et al. 2023).
  • Most NARWs have a low probability of surviving past 40 years even though the NARW can live up to a century.
  • There were no first-time mothers in 2022.
  • About 42% of the population is known to be in reduced health (Hamilton et al. 2021)
  • A NASEM study confirmed that offshore wind has the potential to alter local and regional hydrodynamics
  • “Effects to NARWs could result from stressors generated from a single project; there is potential for these effects to be compounded by exposure to multiple projects.” (p. 14)

I cannot imagine any scenario where a species this stressed will survive when hundreds of massive wind turbines are built across the migration routes.  See the figure showing where the turbines will be built and the whales are for March.

David Wojick describes three events affecting offshore wind development.  Last year a number of developers cancelled their contracts to provide offshore wind power but now the first to come back to the trough seeking more money was approved in New Jersey.  Wojick expects that other states will follow that lead.  On the other hand a major new lawsuit has just been filed. He explains that the suit alleges that the” Federal agencies that have quickly issued the offshore wind permits have simply ignored the destructive environmental effects. This is especially true for the collective impact of combinations of nearby projects.”  New York has similarly ignored the cumulative environmental impact of the proposed resources for the Climate Act.  Finally, he notes that “One of the plaintiffs is the Save the Right Whale Coalition. Here, the narrow issue is the threat posed by enormous offshore wind development to the severely endangered North Atlantic Right Whale.”  He includes a link to “a good picture of one of the unbelievably huge monopiles driven into the sea floor to hold up an offshore wind turbine generator” that shows what the whales are up against. Imagine the energy needed and noise created when these monstrosities are driven into the sea floor.

The mad rush to offshore wind will not just affect whales.  Craig Rucker writing at Cfact describes the stress on commercial fisherman.  He points out issues observed elsewhere and the lack of analysis before development occurs here.

New York State Climate Impacts Assessment: Understanding and Preparing for Our Changing Climate

This assessment deserves more attention and when the Climate Act implementation issues settle down I will return to this “scientific investigation into how climate change is affecting the communities, ecosystems, infrastructure, and industries of the Empire State.”  If  you are looking for an unbiased analysis of climate change in New York look elsewhere.

Without even looking hard this finding sets baloney alarms off:

Summary Finding 4: Sea level along New York State’s coastline has risen almost 1 foot in the past century and is projected to increase by another 1 to 2 feet by midcentury. Sea level rise will make chronic flooding more common in low-lying coastal neighborhoods, lead to intrusion of salt water into groundwater and freshwater coastal ecosystems, and yield more destructive storm surge during coastal storms. Coastal communities will benefit from planning and design that accounts for future sea levels.

They say that one foot in the past century has been observed.  They are claiming that 1 to 2 feet additional sea-level rise will occur in half a century.  For that to happen the sea level rise rate must at least double. There is no indication of such an accelerated sea-level rise rate.  They have no shame hyping the most extreme estimates for climate models.

Fraudulent Fantasy

Ed Reid, Jr. writing at Right Insight does a nice job summarizing reasons why the fantasy that “intermittent renewable generation combined with electricity storage provides a reliable energy system at lower energy cost than the predominantly fossil fueled energy system it would replace.”  He explains:

This fantasy is a complete and utter fraud, since those promoting it know that the generation technology they are promoting is intermittent and that the storage that they suggest would be required to overcome this intermittency and provide a reliable energy grid is inadequate, extremely expensive and unsuitable for the application.

He goes on to describe other problems.

The Campaign to Shut Down Discussion

Thomas Shepstone points out that proponents of the net-zero transition don’t want a discussion.  Jo Nova brings it all together in an excellent post at her site titled “One third of UK teenagers think climate change is deliberately exaggerated.”  She describes a perfect example of this in a recent article in the left-wing Guardian.  The article claims that arguments that “climate solutions do not work, climate science and the climate movement are unreliable, or that the effects of global heating are beneficial or harmless” should be banned.

Response to Environmental Justice Concerns

Alex Epstein argues that this aspect of the anti-fossil-fuel movement ignores the benefits of fossil fuels and overstates their negative side-effects.

Howarth’s Adverse Impact on New York Cap-and-Invest

In January 2023 I wrote an article describing Dr. Robert Howarth’s statement supporting his vote to approve the Climate Leadership and Community Protection Act (Climate Act) Scoping Plan.  Roger Pielke, Jr. recently did an interesting piece on the Biden Administration decision to halt the permitting of the continued expansion of U.S. liquified natural gas (LNG) export capacity that featured a link to Howarth and his position on methane.  It provides more evidence that a “Professor of Ecology & Environmental Biology” is unqualified to be considered an expert on methane emissions.  His misleading guidance adversely impacts the New York Cap-and-Invest program.

I have followed the Climate Act since it was first proposed, submitted comments on the Climate Act implementation plan, and have written over 400 articles about New York’s net-zero transition. The opinions expressed in this post do not reflect the position of any of my previous employers or any other organization I have been associated with, these comments are mine alone.

Overview

The Climate Act established a New York “Net Zero” target (85% reduction in GHG emissions and 15% offset of emissions) by 2050.  It includes an interim 2030 reduction target of a 40% reduction by 2030 and a requirement that all electricity generated be “zero-emissions” by 2040. The Climate Action Council (CAC) is responsible for preparing the Scoping Plan that outlines how to “achieve the State’s bold clean energy and climate agenda.”  In brief, that plan is to electrify everything possible using zero-emissions electricity. The Integration Analysis prepared by the New York State Energy Research and Development Authority (NYSERDA) and its consultants quantifies the impact of the electrification strategies.  That material was used to develop the Draft Scoping Plan outline of strategies.  After a year-long review, the Scoping Plan was finalized at the end of 2022.  In 2023 the Scoping Plan recommendations were supposed to be implemented through regulation, PSC orders, and legislation.  Not surprisingly, the aspirational schedule of the Climate Act has proven to be more difficult to implement than planned and many aspects of the transition are falling behind, and the magnitude of the necessary costs is coming into focus. 

Howarth and the Climate Act

Howarth takes pride in his role in the Climate Act.  I previously explained that the statement of Robert W. Howarth, Ph.D., the David R. Atkinson Professor of Ecology & Environmental Biology at Cornell University was very illuminating relative to the motives of the Climate Act authors.  He reiterated his claim that he played a key role in the drafting of the Climate Act, developed the methane requirements, and credited one politician for getting the Act passed:

Assembly Person Steven Englebright was hugely instrumental in the passage of the Climate Leadership & Community Protection Act that established the Climate Action Council. I thank him for his leadership on this, and particularly for his support of the progressive approach on greenhouse gas emissions that is a central part of the CLCPA. I originally proposed this to Assembly Person Englebright in 2016, and he enthusiastically endorsed and supported it through multiple versions of the bill that finally led to passage of the CLCPA in 2019. In this accounting for greenhouse gases, a major government for the first time ever fully endorsed the science demonstrating that methane emissions are a major contributor to global climate change and disruption. Further, in passing the CLCPA New York recognized that consumption of fossil fuels (and not simply geographic boundaries) is what matters in addressing the climate crisis. New York wisely banned the use of high-volume hydraulic fracturing (“fracking”) to develop shale gas in our State. But since the time of that ban, the use of fossil natural gas has risen faster in our State than any other in the Union. Methane emissions from this use of shale gas are high, but much of that occurs outside of our boundaries in the nearby states of Pennsylvania, West Virginia, and Ohio. Through the CLCPA, the citizens of New York are taking responsibility for these out-of-state emission caused by our use of fossil fuels, particularly for fossil natural gas. The way to reduce these emissions is to rapidly reduce our use of fracked shale gas.

Unfortunately, Howarth’s influence on Climate Act implementation also extended into the Climate Action Council. As a member of the Climate Action Council, Howarth was considered a subject matter expert and most members unquestioningly accepted whatever he said.  This deference to his concerns is also apparent in the Integration Analysis and Scoping Plan.  In my previous article I explained why many of his claims were not supportable.

Methane

At the time the Climate Act was written it incorporated unique emissions accounting requirements that elevate the importance of methane to Climate Act compliance.  In particular, the Climate Act specifies that the global warming potential (GWP) must be calculated over a 20-year time horizon.  The Inter-governmental Panel on Climate Change (IPCC) describing time horizons and the GWP[1] notes:

“The GWP has become the default metric for transferring emissions of different gases to a common scale; often called ‘CO2 equivalent emis­sions’ (e.g., Shine, 2009). It has usually been integrated over 20, 100 or 500 years consistent with Houghton et al. (1990). Note, however that Houghton et al. presented these time horizons as ‘candidates for discussion [that] should not be considered as having any special sig­nificance’. The GWP for a time horizon of 100 years was later adopted as a metric to implement the multi-gas approach embedded in the United Nations Framework Convention on Climate Change (UNFCCC) and made operational in the 1997 Kyoto Protocol. The choice of time horizon has a strong effect on the GWP values — and thus also on the calculated contributions of CO2 equivalent emissions by component, sector or nation. There is no scientific argument for selecting 100 years compared with other choices (Fuglestvedt et al., 2003; Shine, 2009). The choice of time horizon is a value judgement because it depends on the relative weight assigned to effects at different times.”


Howarth and others argued that it was necessary for the Climate Act to use 20-year global warming potential (GWP) values because methane is estimated to be 28 to 36 greater than carbon dioxide for a 100-year time horizon but 84-87 GWP over a 20-year period.  Because of these high potentials they assumed that meant that the effect of methane on expected warming would be significant.

I have noted that this irrational obsession with methane that is incorporated in the Climate Act is inappropriate. The fundamental flaw with the basis for vilifying methane is that it is based on selective choice of the science and ignores inconvenient aspects of radiation physics which indicate that the laboratory measurements of global warming potential do not translate to the atmosphere where it counts. 

LNG Export Terminal Pause

I originally was going to include this link in my fortnightly “Articles of Note” post but decided to elevate it into a focused post because of a reference to Howarth.  Roger Pielke, Jr did an interesting piece on the Biden Administration decision to halt the permitting of the continued expansion of U.S. liquified natural gas (LNG) export capacity.  He describes the activist rationale for the LNG export expansion halt “included in a letter to President Biden from a group of activists, including the University of Pennsylvania’s Michael Mann and Stanford’s Mark Jacobson”:

Taken together, if all U.S. projects in the permitting pipeline are approved, they could lead to 3.9 billion tons of greenhouse gas emissions annually, which is larger than the entire annual emissions of the European Union. A forthcoming study by Cornell University climate scientist Robert Howarth shows that, even in the best-case scenarios, LNG is at least 24 percent worse for the climate than coal. Increasing LNG exports will mean increased extraction of fossil fuels and climate pollution and directs us away from a renewable energy future.

[1] Reference: Myhre, G., D. Shindell, F.-M. Bréon, W. Collins, J. Fuglestvedt, J. Huang, D. Koch, J.-F. Lamarque, D. Lee, B. Mendoza, T. Nakajima, A. Robock, G. Stephens, T. Takemura and H. Zhang, 2013: Anthropogenic and Natural Radiative Forc­ing. In: Climate Change 2013: The Physical Science Basis. Contribution of Working Group I to the Fifth Assessment Report of the Intergovernmental Panel on Climate Change [Stocker, T.F., D. Qin, G.-K. Plattner, M. Tignor, S.K. Allen, J. Boschung, A. Nauels, Y. Xia, V. Bex and P.M. Midgley (eds.)]. Cambridge University Press, Cambridge, United Kingdom and New York, NY, USA.

Pielke, Jr. writes that this policy decision raises three concerns. 

  1. “The Biden Administration made a decision before producing the evidence on which such a decision is supposed to be based.
  2. The Biden Administration decision ignores the “geopolitical and security implications of the decision”.
  3. Finally, there appears to be no consideration of the economic impacts of the decision.

I recommend reading the article in its entirety.

The reason I turned this into a focused post is because Pielke, Jr. included a previously unknown to me reference regarding Howarth. His quote from the activist letter mentions a forthcoming study by Howarth which Pielke, Jr. described as follows:

The study referenced above suggesting that LNG is worse than coal in terms of greenhouse gas emissions is by Robert Howarth of Cornell University, and is both contrary to a broad scientific consensus on this issue and a lone outlier.

Of particular interest is the footnote associated with the “lone outlier” label.  Pielke, Jt. states:

The story behind the new Howarth study is for another day. I’ll just note here that in 2012 Howarth told a reporter that he was performing anti-fracking research for hire — The reporter explained: “In an interview, Howarth told me his goal was to make the anti-fracking movement mainstream and fashionable. He said he met with the Ithaca-based [Park] foundation two years ago, agreeing to produce a study challenging the conventional wisdom that shale gas is comparatively clean…Howarth hired an aggressive PR firm, the Hastings Group, to promote his politicized viewpoint.”

This is smoking gun evidence that New York’s unique characterization of methane and Climate Act policy requirements is based on the politicized and financially advantageous work of a for hire scientist. 

Discussion

On January 23, 2024, the New York State Department of Environmental Conservation (DEC) and the New York Energy Research & Development Authority (NYSERDA) hosted the first webinar of this year’s New York Cap-and-Invest (NYCI) Program stakeholder engagement process.  One of the points made in the first webinar was that under Governor Hochul’s direction, New York’s cap & invest program will incorporate these guiding principles:

  • Affordability. Craft a program to deliver money back to New Yorkers to ensure energy affordability
  • Climate Leadership: Catalyze other states to join New York, and allows linkage to other jurisdictions
  • Creating Jobs and Preserving Competitiveness: Protect existing jobs and support new and existing industries in New York
  • Investing in Disadvantaged Communities: Ensure 35%+ of investments benefit Disadvantaged Communities
  • Funding a Sustainable Future: Support ambitious clean energy investment

There are ramifications of the reliance on Howarth’s work for the first two principles: affordability and climate leadership links to other jurisdictions.

Last spring I described a Climate Act Revisions Kerfuffle when the Hochul Administration floated the suggestion to revise the emissions accounting methodology to use the Global Warming Potential over 100 years instead of 20 years because of a concern with cost.  Climate Action Council co-chairs Doreen Harris and Basil Seggos argued that:

“First and foremost, the governor is trying to maintain New York’s leadership on climate. It’s a core principle that she brought into office and we have been carrying that out for several years,” said Seggos.

But Gov. Hochul instructed both the DEC and NYSERDA to look at the affordability of Cap & Invest.

“We began running the numbers on that, based on some of the metrics being used by Washington state and some of our own, and revealed some…potentially extraordinary costs affiliated with the program,” Seggos explained. “So that’s really what this is.  It isn’t a focus necessarily on methane itself, or any particular pollutant. It is how do we implement the CLCPA in a way that doesn’t put extraordinary costs on the pockets of New Yorkers.”

The climate activist organizations went ballistic and the Administration bowed to the pressue.  Activists claimed:

“When Governor Hochul tried to sneak in a fossil-fueled methane accounting method that would gut New York State’s Climate Act during the final push of budget negotiations, New York’s climate and environmental justice movement responded swiftly and powerfully. NY Renews is proud to stand with a movement that stopped—for now—changes to New York’s progressive 20-year methane accounting method as written in law.” 

The Summary Report for the 2023 Statewide GHG Emissions Inventory  explains the effect of GWP-20 accounting and other policy requirements of the Climate Act on emissions:

When considering emission sources only within New York State and using a GWP100, CO2 is a much greater component of total emissions (Figure 3). The main difference is the CLCPA’s focus on shorter-lived methane and HFCs, which appear much larger using the 20-year GWP, although the actual mass of these emissions has not changed. The other key difference between the accounting frameworks is out-of-state emissions. Over time, New York State has imported more natural gas and has exported more waste. Methane is a major source of emissions for both the natural gas system and waste management.

In 2021 total GHG emissions were 367.87 million metric tonnes of CO2 equivalent using the Climate format (GWP-20) and to the best of my review of the data (it does not appear to match Figure 3) the GWP-100 total is 214.4 million metric tonnes of CO2 equivalent.  If the allowance costs per ton for NYCI remain the same, then costs to the state will be 72% higher using the Howarth inspired accounting.

The second Hochul principle is “climate leadership” which is described as “catalyze other states to join New York and allow linkage to other jurisdictions”.  I think it is a heavy lift to catalyze other states to join New York if most of the rest of the world is using a different accounting system, particularly when the rationale for that approach does not stand up to scrutiny.  I know that it will likely be impossible for New York to link to the California/Quebec and Washington cap-and-invest programs.  The different accounting methodology is a high hurdle and when combined with the upstream emissions accounting with the potential for double counting, it just won’t happen.

Conclusion

With all due respect to Dr. Howarth, it is appropriate to consider why a “Professor of Ecology & Environmental Biology” is qualified to be an expert on methane emissions.  Combined with the revelation that he set out to “make the anti-fracking movement mainstream and fashionable” in conjunction with the Park Foundation, the motives for his methane obsession suggest his analyses are biased to get a particular answer.  The State of New York has failed to rein him in so reconciling the inconsistencies with his pseudo-science and Hochul’s principles is a problem of their own making.  It matters to all New Yorkers because it will increase costs directly and indirectly because links to other jurisdictions could make the allowance market stronger and cheaper.

NYCI Webinar Preliminary Scenario Analyses – Cost Projections

On January 26, 2024 the New York State Department of Environmental Conservation (DEC) and the New York Energy Research & Development Authority (NYSERDA) hosted the third  webinar (slides and recording) of this year’s New York Cap-and-Invest (NYCI) Program stakeholder engagement process.  I described the first webinar “The Role of Cap and Invest” in an earlier post.  This post presents my initial impressions of the third webinar of the series, “Preliminary Scenario Analyses”, with particular emphasis on the projected costs.

I have followed the Climate Leadership & Community Protection Act (Climate Act)  since it was first proposed, submitted comments on the Climate Act implementation plan, and have written over 380 articles about New York’s net-zero transition. The opinions expressed in this post do not reflect the position of any of my previous employers or any other organization I have been associated with, these comments are mine alone.

Overview

The Climate Act established a New York “Net Zero” target (85% reduction in GHG emissions and 15% offset of emissions) by 2050.  It includes an interim 2030 reduction target of a 40% reduction by 2030 and a requirement that all electricity generated be “zero-emissions” by 2040. The Climate Action Council (CAC) is responsible for preparing the Scoping Plan that outlines how to “achieve the State’s bold clean energy and climate agenda.”  In brief, that plan is to electrify everything possible using zero-emissions electricity. The Integration Analysis prepared by the New York State Energy Research and Development Authority (NYSERDA) and its consultants quantifies the impact of the electrification strategies.  That material was used to develop the Draft Scoping Plan outline of strategies.  After a year-long review, the Scoping Plan was finalized at the end of 2022.  In 2023 the Scoping Plan recommendations were supposed to be implemented through regulation, PSC orders, and legislation.  Not surprisingly, the aspirational schedule of the Climate Act has proven to be more difficult to implement than planned.  Many aspects of the transition are falling behind, and the magnitude of the necessary costs is coming into focus.  When political fantasies meet reality, reality always wins.

Cap-and-Invest

The Climate Action Council’s Scoping Plan recommended a market-based economywide cap-and-invest program.  The program works by setting an annual cap on the amount of greenhouse gas pollution that is permitted to be emitted in New York: “The declining cap ensures annual emissions are reduced, setting the state on a trajectory to meet our greenhouse gas emission reduction requirements of 40% by 2030, and at least 85% from 1990 levels by 2050, as mandated by the Climate Leadership & Community Protection Act (Climate Act).”  In addition to the declining cap, it is supposed to limit potential costs to New Yorkers, invest proceeds in programs that drive emission reductions in an equitable manner, and maintain the competitiveness of New York businesses and industries. The stakeholder engagement process will refine the proposal over the next several months, DEC will and NYSERDA will propose regulations by summer, and the final rules are supposed to be in place by the end of the year.

The reality is different particularly because the proposal changes components that have worked in other jurisdictions and environmental activists want to remove certain components that have made similar programs work in the past.  The proposed regulations keep many of the necessary features but still make changes that threaten viability.  Further background information is available at my carbon pricing initiative page.

Preliminary Scenario Analysis Webinar

The slides and recording for the webinar are available.  Note that in the following text there are links to sections of the webinar recording corresponding to specific topics. 

The entire webinar was scripted.  Each presenter read their remarks and it even appeared that the responses to questions were vetted.  Vlad  Gutman-Britten (NYSERDA) read the script that gave an overview of the webinar outline. The goal of this webinar was to describe the preliminary scenario analysis that projects how the NYCI allowance market will operate, present expected costs to households, and describe potential benefits of associated emission reductions.  I focus on the costs to households in this post.

NYCI Modeling

The preliminary scenarios analysis relies on econometric models.  The presentation was pretty vague on exactly which models were used and who did the work.  It appears that it relies heavily on the analyses done for the Scoping Plan.  If that is true then note that there was no suggestion that those analyses had been updated since they were done in 2022.

To give context for the cost results I briefly describe the modeling.  The analyses must project allowance supply and demand.  Gutman-Britten described the following slide that gives an overview of the analysis approach. 

Allowance supply is based on the statewide greenhouse gas emissions cap:

The cap was defined by interpolating between 2025 starting point emissions (described subsequently) and the 2030 emissions limit, and then interpolating between 2030 and 2050 limits. The modeling employs non-linear interpolation, with gradual reductions at first followed by acceleration to the target year. The cap is economywide covering all sectors. The State would retire allowances for all non-obligated emissions.

In general, the allowance budget represents the allowable number of tons for each year of the emissions cap.  However, the NYCI proposal treats different sectors of the economy differently to address distinctions between the sectors.  To appease particular political constituencies, specific exemptions to all or part of sector  allowance requirements have been incorporated into the proposed plan. 

The modeling analysis balances the cap with expected emissions to estimate allowance demand for each sector.  All the obligated entities will be required to “surrender emissions allowances following a three-year compliance period, the first one being 2025-2027.”  For each ton emitted they must submit one allowance.  The modeling estimates the expected emissions based on “technology pathways”.  I think this technological jargon hides the fact that feasibility is not incorporated into these modeling results. 

The final aspect of this modeling is financial sector participation: “The model assumes that “the financial sector participates in the market freely by arbitraging on changes in the price of allowances.”  This is an aspect of the modeling where I think theory is not fully aligned with what actually happens in a market-based pollution control program.

The point I wanted to make in this summary of the modeling is that all these projections are subject to enormous uncertainty.  There are many aspects of each energy sector transition that are subject to interpretation and the biases of the modelers.  As a result, it is easy to get results that coincide with the pre-determined outcomes consistent with the political narrative.

At this time, the modeling analyses for the auction project that 2030 total revenue is “estimated to be between $6 and $12 billion per year ($4-8 billion available for investments).”  Sparse details for this calculation were provided and I was not able to reproduce those numbers.

Household Costs

The projected costs from the modeling analysis are included for three scenarios described by Gutman-Britten in the following slide.  The analysis modeled three different price ceiling trajectories. The price ceiling value represents the allowance price that triggers a safety valve that would make additional allowances available “for buyers until demand is fully met limited to actual emissions.”  The scenarios “follow similar paths but have different price levels for each one.”  No explanation was provided justifying the initial price ceiling for each scenario or the timing of the jump step in allowance prices in 2027. 

I have always maintained that the primary concern of the general public is Climate Act costs.  This presentation does not provide comprehensive cost estimates.  In the following table I list the ceiling prices by year for the different scenarios and the corresponding gasoline cost adder as an example of potential costs.   According to the US Energy Information Administration, 17.86 lbs of CO2 are emitted per gallon of finished motor gasoline which means that 112 gallons burned equals one ton. 

At first glance the 2025 gasoline price adder is not that large.  However, the market price for allowances has always been noticeably higher at the start of all allowance trading programs.  The uncertainty of a new program lead to higher prices that typically fall back as the program matures.  I think the actual price adder at the start of the program will be higher.  The other notable feature is the step change increase in 2027.  The values listed in 2027 are comparable to the California/Quebec and Washington program allowance prices so I think those prices are more reasonable for eventual New York prices.  I suspect there is a connection between the proposed low ceiling prices through 2026 and the 2026 gubernatorial election year that explains the timing of the step change in 2027.

Last year legislation mandated that funds be allocated to the Consumer Climate Action Account (CCAA) as part of the overarching investment framework established for NYCI.  As noted in the following slide and explained by Guttman-Britten the first 37% of revenue generated by NYCI auctions is “set aside for the affordability accounts, the Consumer Climate Action Account, the industrial small business climate action account and administrative expenses.”  The Consumer Climate Action Account itself is supposed to get 30% of the revenues.  Recall that 2030 total revenue is “estimated to be between $6 and $12 billion per year” so the Consumer Climate Action Account should get between $3.3 and $1.5 billion in 2030.

In the summary of the modeling overview Gutman-Britten read the script claiming that NYCI has the ability to effectively manage total costs:

  • Initial analysis shows that millions of households would break even after NYCI, especially lower income and low energy use households.
  • Although some households, especially high fossil fuel users, are likely to have residual costs after benefits, total cost impacts may be managed for a very large percentage of households.
  • In addition to driving emission reductions, NYCI investments are an essential affordability strategy. The program’s support for EV, heat pump, transit, and other related incentives and programs reduces cost exposure for households across New York, with a growing share receiving more benefits than costs.

The analysis relies on the 30% of revenues allocated to the CCAA to offset much of the cost.  Insufficient detail was provided in the webinar to evaluate those claims and if the past is any guide there will never be sufficient documentation to verify them.  In my opinion this modeling was designed to get specific answers consistent with the Hochul Administration narrative.

Household Impacts

James Wilcox read the script for the Household Impacts discussion. His presentation emphasized the point that these estimates were illustrative examples and not a formal proposal.  The following slide is an overview and makes the point that these results are “focused on the impact of NYCI on affordability for low and middle- income households”.  Those households are defined as follows:

  • Low income is identified as all income bands entirely below 60% of state median annual household income, i.e., below $35,000 for the purpose of this analysis.
  • Middle income is identified as the income band that contains the median annual household income in NYS, i.e., $50-75,000 for the purpose of this analysis.

The illustrative benefit design flow chart from the key assumptions slide deserves more discussion especially because if you are like me these numbers have no context.  I found an overview of New York household income at Statistical Atlas that included two graphs.  I combined data from the income percentiles and webinar income distribution graphs in the following table.  The webinar assumes that there will be no benefit for households in the top 20% which according to the table corresponds to an income exceeding $126,900.  There are six million households under that threshold which means that 1.5 million households in the top 20% of income will get no benefit.  Low-income households are those below $35,000 and there are 2.3 million households in that category.  There are 2.1 million households above $35,000 but below $75,000.  Middle income is identified as the income band that contains the median annual household income in NYS, i.e., $50-75,000 for the purpose of the NYCI analysis.  That leaves 1.6 million households with income between $75,000 and $126,900.  No information for expected benefits was provided for this last category.  Left unsaid was how the CCAA funds are distributed across these categories.

I have not been able to find a reference for the expected CCAA monthly distribution.  The household numbers can be used to guess at the distribution. Previously I noted that the CCAA should get between $3.3 and $1.5 billion in 2030. According to this table about six million households are eligible for a CCAA distribution so if every eligible household gets the same share, then the monthly distributions will range between $45 and $21 per month.

The script for the household impacts by type, location, and income slide described the monthly program net impacts for the first year of the program.  The title “monthly program net impact” says that the values are netted out from something, but it is not clear what. It is likely that these are net relative to the costs less the CCAA benefit. It is also possible that the values are relative to the Reference Case.  However, the Reference Case includes the costs of New York City Local Law 97 and the advanced clean car rule among other things. It is not clear how those could be separated out in the analysis.  The net impact costs table is excerpted below.

This is a busy slide that describes the monthly net cost impacts.  The rows list the regions (NYC, Downstate, and Upstate) including the low- and middle-income household categories.  There are four categories of columns.  The first column covers households that use gasoline vehicles and heat with fossil fuels.  The second column covers households that use gasoline vehicles but use “green” electric heating.  One of the unexplained details is whether using electricity for heating was limited to heat pumps or includes resistance heating.  The third column is households that do not use gasoline vehicles but use fossil heating.  Another detail is whether hybrid vehicles that are not zero-emissions vehicles are considered green.  The fourth column is for the small number of households that do not use gasoline vehicles or fossil heat.  Within each of those four columns the results for the three allowance scenarios are shown.

The script explanation for the first column stated that:

Depending on the household income level and the part of the state, the cost may range. From as little as $12 a year to up to $180 with net impacts lower under Upstate scenarios B and C.

Infuriatingly, the script description describes annual benefits, but the graph lists monthly values.  For example, the Scenario A monthly net cost impact ranges from $1 per month ($12 a year) for Downstate, Low Income to $15 per month ($180 per month) for Upstate, Middle Income. Inconsistent nomenclature makes it difficult to figure out exactly what is proposed.

The script narrative is that as people transition away from fossil fuels people will be financially better off. In the rightmost column for both green alternatives the Scenario A monthly benefits range from $11 to $28 per month or $132 to $336 per year.  Presumably this represents an incentive to convert but it is left unsaid whether converting to an EV and a heat pump will cost less than this program benefit.

The script for this concludes that “It’s essential to remember that NYCI investments will be designed to move state households from the right column to the left column.”  This appears to be a mis-statement because the left column is all fossil and the right column is all “zero-emissions” so the goal should be opposite direction.  The narrative also argues that revenues raised will provide support for households to electrify their homes and cars and the CCAA rebates will be an additional incentive. 

Wilcox provides a couple of more slides that break out the household impacts.  The following is the second slide that describes the Upstate “middle-income household journey” to decarbonized nirvana as envisioned by this modeling.  For a household with two internal combustion vehicles and a home that is not weatherized and uses gas heating the slide describes two decarbonization scenarios: moderate and increased decarbonization.  The graphs list the NYCI program impact per month (Real $ 2022) for the net program impact faced by household; increases cost due to NYCI; the surplus benefit; decreased cost for efficient appliances, weatherization, switching one of two cars to an electric vehicle and switching to a heat pump; and program impact covered by differentiated distribution.

I cannot say that I can fully explain these household impacts values.  The script states:

This household sees an initial net cost. The consumer climate action account offsets approximately two thirds of the total NYCI impact.

The increase in NYCI price is $78 which I assume is the total NYCI impact.  The sum of the net program impact faced by household ($15) and program impact covered by differentiated distribution ($28) is $43 and that is about two thirds of the total NYCI impact.  But the graph states that the net program impact is $15. I cannot figure out what the program impact covered by differentiated distribution represents.  Recall that if every eligible household gets the same share the monthly distributions will range between $45 and $21 per month in 2030 but the 2025 estimated revenues were not provided. 

The graphic and the script describe the household journey:

However, under a moderate decarbonization journey where this household installs efficient appliances, weatherizes their home, and switches one of the 2 cars to an EV.

They nearly break even. Facing a small net cost of $2 after receiving an illustrative consumer climate action account benefit.

The graphic claims that efficient appliances save $7 a month, weatherizing the home saves $10, and switching one of the 2 cars to an EV saves $36 for a total of $53 in savings per month.  In 2030 the sum of the net program impact faced by household ($2) and program impact covered by differentiated distribution ($66) is $68. In this instance the differentiated distribution is described as the “illustrative consumer climate action account benefit” but that estimate is at odds with my calculated CCAA benefits of around $45 per month.  This is another inconsistency that I cannot explain.

The script goes on to say:

Again, in addition to NYCI offering direct support for energy affordability, program revenue can be used to reduce the cost to households of investments like residential heat pumps and EVs.

This is an addition, and this applies to both slides to support from federal programs to the Inflation Reduction Act.

While others will see some costs that the consumer climate action count helps to manage. However, taking even moderate steps to decarbonize by 2030 leads to surplus benefits in nearly every region and income level analyzed, while taking increased measures leads to significant surplus benefits across all regions and income levels analyzed.

I have not been able to reproduce these claims.  Note that the claim that there are “surplus benefits in nearly every region and income level analyzed” ignores the fact that the 1.6 million households with incomes lower than the no-benefit threshold and above the middle-income $75K threshold are not addressed in their presentation of results.

Wilcox summarized the cost impact results in the following slide.  The script says that this “illustrative distribution of the Consumer Climate Action Account shows that millions of households break even due to NYCI, especially low-income households and those that rely on clean energy like EVs, transit, and heat pumps.”  These are average values.  The distribution of impacts that would describe costs for those households that do not have the option for EVs, transit, and heat pumps is not available.  The summary claims that the “Consumer Climate Action Account has the potential to manage impacts for a very large percentage of households in New York” but does not quantify that percentage.  The modeling analysis notes that the building and transportation sector modeling was custom built.  Optimistic implementation assumptions can easily be used to torture the data into the result desired.  Without complete documentation I do not think that the results are credible, so I am reserving judgement on these claims.

Discussion

I have always maintained that the primary concern of the general public is Climate Act costs.  As far as I can tell the Hochul Administration deliberately hid those costs in the Scoping Plan and that politically motivated approach is apparent in this webinar. 

The Energy Policy Institute at the University of Chicago did a poll in early 2023 poll with “the Associated Press–NORC Center for Public Affairs Research” explored Americans’ attitudes on climate change, their views on key climate and energy policies, and how they feel about electric vehicles and the policies to encourage them.  The following chart from that report shows that 38% would be willing to pay an additional $1 a month for a fee to combat change and only 21% would be willing to pay $100 a month. 

This webinar talked about a single component of the total cost of the net-zero transition.  When NYCI starts auctioning allowances the price of energy is guaranteed to go up.  The Upstate “middle-income household journey” states that households in that category will pay at least $73 a month before the rebates are applied.  The rebates are subject to the whim of Albany politicians, so the rebate amounts are not guaranteed.  In addition, the electric bill supply costs are not included in these modeled costs.  I recently discussed the Central Hudson revisions to its double-digit gas and electric delivery rate increases. The public outcry has been intense and the costs described here are in addition to the rate case costs. There is insufficient documentation available to determine exactly what costs were included in the heat pump and electric vehicle examples given.

The Energy Policy Institute poll described above found that less than a third of respondents were willing to pay even $10 a month.  The willingness to pay at other levels in the poll shows that less than a third are willing to pay as little as $10 a month for a carbon fee.  Little wonder that the true costs are a closely guarded secret.

The Climate Action Council’s Scoping Plan has been described as a  “true masterpiece in how to hide what is important under an avalanche of words designed to make people never want to read it.”  Similarly, the modeling analysis portrayal in this webinar uses an avalanche of technical jargon and impressive sounding phrases to suggest credibility and discourage questions.  In reality, all the modeling relies on guessing how society will react to incentives and regulations using parameters that can lead to wildly different results depending upon the biases of the model developer.  John von Neumann allegedly summed up the problem with parameters stating that “With four parameters I can fit an elephant, and with five I can make him wiggle his trunk”[1].  In other words, he could develop a mathematical model that described an elephant simply by fudging the parameters.  In this instance the model parameters produce the politically correct result that people will, for example, switch to electric vehicles in response to the incentives but don’t account for the many people who have weighed the pros and cons of an electric vehicle and decided never.

Conclusion

“A goal without a plan is just a wish.”, Antoine de St. Exupery.  The Scoping Plan should properly be called the Scoping Goals because there is no plan.  There has been no accountability for proving that the control strategies proposed are feasible on the schedule mandated by the Climate Act and that the costs of all the components of the energy system that must be changed to achieve the net-zero transition will maintain current standards of affordability.  It is just wishing.


[1] Attributed to von Neumann by Enrico Fermi, as quoted by Freeman Dyson in “A meeting with Enrico Fermi” in Nature 427 (22 January 2004) p. 297

New York State GHG Emissions Trends

This is my 400th article on the Climate Leadership & Community Protection Act (Climate Act) net-zero transition.  It seems appropriate to look at where the state stands relative to the time when I started writing these articles and the Climate Act targets.  This summary supplements the progress status summary described by Francis Menton and the generation trend status prepared by Nuclear New York by looking at Greenhouse Gas (GHG) emissions.

I have followed the Climate Leadership & Community Protection Act (Climate Act)  since it was first proposed, submitted comments on the Climate Act implementation plan, and have written 400 articles about New York’s net-zero transition. The opinions expressed in this post do not reflect the position of any of my previous employers or any other organization I have been associated with, these comments are mine alone.

Overview

The Climate Act established a New York “Net Zero” target (85% reduction in GHG emissions and 15% offset of emissions) by 2050.  It includes an interim 2030 reduction target of a 40% reduction by 2030 and a requirement that all electricity generated be “zero-emissions” by 2040. The Climate Action Council (CAC) is responsible for preparing the Scoping Plan that outlines how to “achieve the State’s bold clean energy and climate agenda.”  In brief, that plan is to electrify everything possible using zero-emissions electricity. The Integration Analysis prepared by the New York State Energy Research and Development Authority (NYSERDA) and its consultants quantifies the impact of the electrification strategies.  That material was used to develop the Draft Scoping Plan outline of strategies.  After a year-long review, the Scoping Plan was finalized at the end of 2022.  In 2023 the Scoping Plan recommendations were supposed to be implemented through regulation, PSC orders, and legislation.  Not surprisingly, the aspirational schedule of the Climate Act has proven to be more difficult to implement than planned.  Many aspects of the transition are falling behind, and the magnitude of the necessary costs is coming into focus.  When political fantasies meet reality, reality always wins.

Nuclear New York – Generation Trends

In a press release on January 8, 2024 Nuclear New York, “Independent Advocates for Reliable Carbon-Free Energy” explained that “four years since passing the Climate Act, New York struggles to replace shuttered clean energy “.  Their release stated (foot notes removed):

In 2023, nuclear power was once again the largest single source of clean energy in New York State. Electricity generation from this carbon-free source totaled 27.6 terawatt hours (TWh), up 2.7% over 2022. Nuclear covered 18.1% of the state’s total electricity demand (including behind-the-meter “rooftop” solar generation), and amounted to 42.7% of in-state clean electricity.

Hydro, the second largest source of carbon-free power, recovered 2.1% in 2023 to 27.2 TWh, covering 17.9% of demand. These two ‘firm clean’ generation sources provide on-demand power regardless of the time of day or weather.

Despite increasing deployed wind capacity in 2022 by 13% over 2021, generation from this source declined 3.9% in 2023 over 2022 to 4.7 TWh, demonstrating the perils of relying on weather-dependent renewable energy. New York Independent System Operator (NYISO) does not report grid-connected solar as a separate category, given its currently minuscule contribution to the generation mix. However, rooftop solar generation increased 18% to 5.2 TWh, covering 3.4% of demand.

New York’s electricity demand declined by 4.8 TWh over 2022 (-3.1%), which enabled the state to reduce net imports by 4.3 TWh. In-state fossil fuel combustion decreased by 2.3 TWh, but remained 11.0 TWh (21%) above 2019 levels, when clean energy generation peaked.

Updates on the March to the New York Great Green Future

Francis Menton’s update on the net-zero transition asks the question where are we and responds:

The Manhattan Contrarian Energy Storage Report of December 1, 2022, led off by sounding a clear alarm: getting electricity from intermittent wind and solar well past 50% of total generation would require enormous quantities of energy to be stored, with technical requirements, including duration of storage, well beyond the capability of any battery currently existing or likely to be invented any time soon. Essentially, if fossil fuels are to be eliminated, there is only one realistic possibility for meeting the storage requirements: hydrogen.

In mid-2023, the New York Independent System Operator, to its credit, recognized the problem — although it buried that recognition deep in a report when it should be shouting about the problem from the rooftops. From NYISO’s Power Trends 2023 Report, revised August 2023, page 7, starting in the middle of a paragraph and without any emphasis:

[T]o achieve the mandates of the CLCPA, new emission-free generating technologies with the necessary reliability service attributes will be needed to replace the flexible, dispatchable capabilities of fossil fuel generation and sustain production for extended periods of time. Such emission-free technologies, either individually or in aggregate, are not yet available on a commercial scale.

With hydrogen as the only possible such “emissions-free generating technology,” how much would hydrogen cost as the solution to this problem, particularly if one follows the hypothesis that it must be created without any use of fossil fuels? My Report, page 14, noted that existing commercial production of this so-called “green” hydrogen was “negligible,” leaving no good benchmark for understanding what the costs might be. As a substitute, I ran some rough numbers based on cost of wind and solar generators to make the electricity and efficiency of the electrolysis process. The result was a very rough estimate that this “green” hydrogen would cost “somewhere in the range of 5 to 10 times more” than natural gas (page 17).

Well, now some new precision has come into view. In July 2022 the UK government launched what it calls its First Hydrogen Allocation Round (HAR 1), to obtain bids and award contracts to produce this so-called “green” hydrogen using wind power. The process took a while, but here from December 14, 2023 is the announcement of the first round of contract awards. Excerpt:

Following the launch of the first hydrogen allocation round (HAR1) in July 2022, we have selected the successful projects to be offered contracts. We are pleased to announce 11 successful projects, totalling 125MW capacity. HAR1 puts the UK in a leading position internationally: this represents the largest number of commercial scale green hydrogen production projects announced at once anywhere in Europe. . . . The 11 projects have been agreed at a weighted average strike price of £241/MWh.

£241/MWh? At today’s exchange rate of 1.27 $/£, that would be $306/MWh. Prices of natural gas are generally quoted in $/MMBTU rather than per MWh, but here is EIA’s latest Electricity Monthly Update, dated December 21 and covering the month of October 2023. It gives natural gas prices in the per MWh units. The “price of natural gas at New York City” is given as $11.32/MWh. That would make the price that the UK has just agreed to pay to buy this “green” hydrogen stuff approximately 27 times what we can buy natural gas for here in New York to obtain the same energy content.

And that $306/MWh is just for the hydrogen. It includes nothing for the massive new facilities (underground salt caverns?) to store the stuff, for a new pipeline network to transport it, and for a new collection of power plants to burn it.

Electric Generating Unit Emission Trends

Electric generating units report emissions to the Environmental Protection Agency Clean Air Markets Division as part of the compliance requirements for the Acid Raiin Program and other market-based programs that require accurate and complete emissions data.  The 2023 emissions data submittal date was January 31 and I downloaded the data the next day.  Something has changed in the data access system so I could not check to see if all the facilities reported on time.  If some facilities had to ask for a delayed submittal this could mean that the totals are lower that actual emissions.

The following table lists the emissions since 2009 when the Regional Greenhouse Gas Initiative started.  Emissions of CO2, SO2, and NOx are down dramatically over this period.  The primary reason is that the fracking revolution made the cost of natural gas so cheap relative to other fuels that every facility that could convert to natural gas did so.  New York banned the use of coal in 2021 which forced the retirement of the remaining coal plants.  The state still has some facilities that primarily burn residual oil but those run infrequently.  The takeaway message is that the fuel switching options are no longer available so future reductions will only come as zero-emissions resources displace facilities burning fossil fuels.

The following graph shows the emission trends.  Note that I divided the CO2 emissions by 1,000 so that all the parameters would show up on the same plot.  The impact of the closure of the Indian Point nuclear facility mentioned in the Nuclear New York presentation is clearly shown as CO2 rose over the last three years until the 2023 emissions started down.  Importantly that could be mostly due to weather variations and not necessarily the addition of the renewables shown above.

New York State GHG Emission Trends

A relevant question is where we stand in regards to the Climate Act mandate for a 40% reduction from a 1990 baseline in GHG emissions by 2030.  Unfortunately, that is not easily answered in sufficient detail to be able to figure out what is going on.

The regulation setting the 1990 baseline emissions values that form the basis for the 2030 40% reduction and the 2050 85% reduction was promulgated in 2020.  It sets the limits

§ 496.4 Statewide Greenhouse Gas Emission Limits

(a) For the purposes of this Part, the estimated level of statewide greenhouse gas emissions in 1990 is 409.78 million metric tons of carbon dioxide equivalent, using a GWP20 as provided in Section 496.5 of this Part.

(b) For the purposes of this Part, the table below establishes statewide emission limits for the year specified, as a percentage of estimated 1990 statewide greenhouse gas emissions of 60 percent and 15 percent, respectively, measured in millions of metric tons of carbon dioxide equivalent gas using a GWP20 as provided in Section 496.5 of this Part.

YearStatewide greenhouse gas emission limit (in million metric tons of carbon dioxide equivalent)
2030245.87
205061.47

The Regulatory Impact Statement for the regulation included a table that breaks down the 1990 emissions by Intergovernmental Panel on Climate Change Sectors and gases.  As shown below there is not much of a breakdown.  Note that all the rest of the emissions will be reported as the CO2 equivalents so you do not need to worry about the component gases.

According to the 2023 Statewide GHG Emissions webpage “The Climate Act requires the New York State Department of Environmental Conservation (DEC) to issue an annual report on statewide greenhouse gas emissions, pursuant to Section 75-0105 of the Environmental Conservation Law.”  The most recent report covering the years 1990 through 2021 was released in late December 2023. The following reports were released at that time:

I extracted summary data from each of the sectoral reports to provide some idea of where New York stands relative to the 2030 targets in the following table.  The Part 496 1990 column lists the regulatory baseline numbers.  The estimated emissions in the 2023 Statewide GHG Emissions are listed for 1990, 2005, and the last five years.  I list the sector 2030 targets (40% of 1990 emissions) and the percentage reduction necessary to meet the targets. 

The first thing that pops out is that the 2023 inventory has a different estimate for 1990.  GHG emission inventories require indirect estimates of many of the emission sources and the assumptions regarding the emission factor that estimates emissions with an activity and the activity rate.  This is a fundamental problem with emission factors and means that for full transparency all the emission factors and associated activity levels should be clearly documented.

The second thing of note is that none of the IPCC sectors are even close to the 2030 targets.  The Scoping Plan’s quantitative assessment in the Integration Analysis essentially is a list of control strategies, presumed control efficiencies, and expected emission reductions that when added up meet the limits.  That assessment was poorly documented, contains inconsistencies with similar New York Independent System Operator (NYISO) analyses, and there has never been any response to comments about inconsistencies and other issues identified in the Scoping Plan comments.  There is no feasibility analysis to determine if those targets can be met with any assurance.

I tried to analyze the data used for the 2023 Statewide GHG Emissions.  Those data are available for download from Open Data NY.  This is another instance where it is not easy to break down the components of the IPCC sectors to determine if it is realistically possible to meet the 2030 targets because state agencies do not provide consistent data.

The Regulatory Impact Statement for Part 496 included Table 4 that broke down fuel combustion GHG emissions within the IPCC energy sector.  Because I used the dataset itself, I picked the sector categories that I believe match the Table 4 categories.  Note that I did not include fuel combustion from petroleum refining in the table because I could not find categories that I thought matched it.  The following table lists the results for the last ten years and compared the 2021 emissions to the 2030 target. Fuel combustion in the electric and industrial sectors are already lower than the equivalent 2030 targets.  On the other hand, transportation and fuel combustion in the commercial and residential sectors will require significant reductions to meet the targets. 

Is that feasible?  Consider what is needed for just one parameter.  To determine if the transportation fuel combustion reductions are feasible, the expected reductions per gasoline vehicle must be estimated.  Miles per gallon and the annual mileage need to be estimated for a range of users and locations so that a reasonable estimate of state-wide fuel use can be estimated.  Once you know that then you can determine how many zero-emissions vehicles must be deployed.  Is that estimate realistic?  That is not all because zero-emissions vehicles also require charging infrastructure and that affects the distribution infrastructure. It is easy to say the model projections meet the 2030 targets but the range of parameters that can be tweaked is so large that any pre-conceived answer can be produced. 

I also put these data in a graph.  I am not sure it adds much value, but I spent enough time on it that I don’t want to waste the effort.  The overall trend suggests that it might be possible to meet the targets if, and only if, the historical rate of emission reductions can be replicated.  Given that the electricity and industrial sectors have achieved the greatest reductions but have no readily available additional reductions, I am not optimistic. 

Conclusion

The 400 articles I have written on the Climate Act all lead to the same result.  When you look at the numbers as shown in this post, the enormity of the challenge is clear. Paraphrasing Francis Menton:

No person looking at these charts would ever conclude that New York has spent the past five years embarked on a crash program to replace fossil fuels with wind and solar. That process is going absolutely nowhere.

Opinion Letter: Cap-and-Invest Will be too Costly for Consumers

I recently had a letter to the editor of the Albany Times Union published asking readers how much they would be willing to pay for the New York Cap-and-Invest (NYCI) Program.  There is a word limit on submittals so this post provides supporting information for that letter.

I have followed the Climate Leadership & Community Protection Act (Climate Act) since it was first proposed, submitted comments on the Climate Act implementation plan, and have written over 380 articles about New York’s net-zero transition. The opinions expressed in this post do not reflect the position of any of my previous employers or any other organization I have been associated with, these comments are mine alone.

Overview

The Climate Act established a New York “Net Zero” target (85% reduction in GHG emissions and 15% offset of emissions) by 2050.  It includes an interim 2030 reduction target of a 40% reduction by 2030 and a requirement that all electricity generated be “zero-emissions” by 2040. The Climate Action Council (CAC) is responsible for preparing the Scoping Plan that outlines how to “achieve the State’s bold clean energy and climate agenda.”  In brief, that plan is to electrify everything possible using zero-emissions electricity. The Integration Analysis prepared by the New York State Energy Research and Development Authority (NYSERDA) and its consultants quantifies the impact of the electrification strategies.  That material was used to develop the Draft Scoping Plan outline of strategies.  After a year-long review, the Scoping Plan was finalized at the end of 2022.  In 2023 the Scoping Plan recommendations were supposed to be implemented through regulation, PSC orders, and legislation.  Not surprisingly, the aspirational schedule of the Climate Act has proven to be more difficult to implement than planned and many aspects of the transition are falling behind.  When political fantasies meet reality, reality always wins.

Published Letter to the Editor

I could not find a link to the letter available to non-subscribers but did get this assortment of opinion pieces from a friend.  The letter is in there somewhere.  The following is the text:

The article “State’s Cap and Invest program unveiled,” Dec. 22, explained that it is intended to fund the transition to zero-emissions energy alternatives. The Hochul administration claims that the costs of inaction are more than the costs of action, but this is just a soundbite slogan. Most benefits are to society, so they do not directly offset the costs of electrification for consumers.

The question New Yorkers want to know is: How much will this cost me? Wind and solar costs increased sharply in 2023 due to changes in commercial conditions driven by inflation, interest rates and supply chain disruptions. Cap-and-invest will add even more costs. Last year, Washington state started a similar program. At the beginning of 2023, gasoline prices in Washington were 72 cents higher than the national average. By October, prices were $1.25 higher. The cost differential relative to the national average increased 88 percent because of the cost of their cap- and-invest program. A similar spike in gas prices will occur here. New York’s program covers all energy sectors, so all energy costs will necessarily increase.

New York greenhouse gas emissions are less than one-half of one percent of global emissions, and global emissions have been increasing by more than one-half of one percent per year since 1990. Therefore, anything New York does will be supplanted by emissions elsewhere in less than a year. That doesn’t mean we should not do something, but it does mean the state should document expected future costs to consumers.

Questions

Before the letter was published, I was asked to respond to questions.  The first requested confirmation of the numbers included.  The second asked about my claim that New York emissions are less than half a percent of global emissions.  This section responds to those questions.

My first claim was that “The cost differential relative to the national average increased 88% because of the cost of their cap-and-invest program.” I responded:

The Gas Buddy website includes a historical gas price graph that I used to estimate the effect on gasoline prices there.  In the following graph I plotted the average gas price in Washington in blue, USA average in red, and the Albany, NY average in green.  The blue arrow points to January 2023 when the Washington cap-and-invest program started and gasoline prices in the state increased relative to the national average.  At the beginning of 2023 gasoline prices in Washington were $0.76 higher than the national average. By October prices peaked $1.38 higher. The cost differential relative to the national average increased 83% because of the cost of their cap-and-invest program. 

My second claim was that “New York greenhouse gas emissions are less than one half of one percent of global emissions, and global emissions have been increasing by more than one half of one percent per year since 1990.” I responded:

I used information from my post Climate Act Emission Reductions in Context dated January 20, 2022 that documented how New York GHG relate to global emission increases.  In response to your questions I updated the analysis.  I found CO2 and GHG emissions data for the world’s countries and consolidated the data in the attached spreadsheet.  There is interannual variation, but the five-year annual average has always been greater than 0.79% until the COVID year of 2020.  The Statewide GHG emissions inventory came out in December but the comparable GWP-100 data that I used from Open Data NY through 2021 are not available.  The analysis relies on last year’s data.  New York’s share of global GHG emissions is 0.42% in 2019 so this means that global annual increases in GHG emissions are greater than New York’s total contribution to global emissions.

Additional information was provided in my post Washington State Gasoline Prices Are a Precursor to New York’s Future.   That post showed that there is an obvious link between Washington’s new cap and trade program and gasoline prices.  I found that the cost of Washington gasoline has risen more relative to the price increases elsewhere so that now Washington has the highest prices in the nation.  The first two auctions for the Washington cap-and-invest program sold 14,770,222 allowances and raised $780,829,117 averaging $52.87 per allowance.  According to the US Energy Information Administration 17.86 lbs of CO2 are emitted per gallon of finished motor gasoline which means that 112 gallons burned equals one ton.  That works out to $0.47 a gallon needed to cover the cost of allowances necessary to purchase the allowances and that is a unique Washington cost adder.

Discussion

The Energy Policy Institute at the University of Chicago did a poll in early 2023 poll with “the Associated Press–NORC Center for Public Affairs Research” explored Americans’ attitudes on climate change, their views on key climate and energy policies, and how they feel about electric vehicles and the policies to encourage them.  The following chart from that report shows that 38% would be willing to pay an additional $1 a month for a fee to combat change and only 21% would be willing to pay $100 a month.  Based on my analyses I think the total all-in cost for a household to comply with proposed carbon fee is going to be a lot closer to $100 than $1 a month.

Conclusion

My next post is going to describe a recent webinar, “Preliminary Scenario Analyses” (slides and recording) that is part of this year’s New York Cap-and-Invest (NYCI) Program stakeholder engagement process.  The webinar offered the first glimpse of potential costs for NYCI and I will compare some of the expected costs with the poll results described above.

There is no question in my mind that most New Yorkers have no clue how much this will cost.  I also believe that the Hochul Administration is keeping the costs hidden as much as possible because they know that support for the program would evaporate.  I appreciate the Albany Times-Union publishing my letter as part of my quixotic quest to stop implementation before it is too late.

Climate and Energy Fantasy and Tyranny

Paul Driessen recently wrote an article explaining that “Models, myths and misinformation on climate drive models, myths and misinformation on energy” at Cfact,org.  It is such a good summary of the overarching issues associated with New York’s Climate Leadership & Community Protection Act (Climate Act) that I want to present it here with some commentary.

I have followed the Climate Act since it was first proposed, submitted comments on the Climate Act implementation plan, and have written over 380 articles about New York’s net-zero transition. The opinions expressed in this post do not reflect the position of any of my previous employers or any other organization I have been associated with, these comments are mine alone.

Overview

The Climate Act established a New York “Net Zero” target (85% reduction in GHG emissions and 15% offset of emissions) by 2050.  It includes an interim 2030 reduction target of a 40% reduction by 2030 and a requirement that all electricity generated be “zero-emissions” by 2040. The Climate Action Council (CAC) is responsible for preparing the Scoping Plan that outlines how to “achieve the State’s bold clean energy and climate agenda.”  In brief, that plan is to electrify everything possible using zero-emissions electricity. The Integration Analysis prepared by the New York State Energy Research and Development Authority (NYSERDA) and its consultants quantifies the impact of the electrification strategies.  That material was used to develop the Draft Scoping Plan outline of strategies.  After a year-long review, the Scoping Plan was finalized at the end of 2022.  In 2023 the Scoping Plan recommendations were supposed to be implemented through regulation, PSC orders, and legislation.  Not surprisingly, the aspirational schedule of the Climate Act has proven to be more difficult to implement than planned.  Many aspects of the transition are falling behind and the magnitude of the necessary costs is coming into focus.  When political fantasies meet reality, reality always wins.

Climate and energy fantasy and tyranny

Paul Driessen is senior policy analyst for the Committee For A Constructive Tomorrow (www.CFACT.org) and “author of books and articles on energy, environment, climate and human rights issues.” He covers “climate change, energy and environmental, human rights, corporate social responsibility, sustainable development, and renewable energy issues in articles and research papers, on radio programs and college campuses, and at professional and other conferences.”

In this article he writes that “It’s mystifying and terrifying that our lives, livelihoods and living standards are increasingly dictated by activist, political, bureaucratic, academic and media ruling elites, who disseminate theoretical nonsense, calculated myths and outright disinformation.”  I have observed that they do this all the while claiming that they are “following the science”

Driessen describes the existential threat rationale and the disconnect between the narrative and historical climate change before human effects and the actual recent data since the alleged human effects started:

We’re constantly told the world will plunge into an existential climate cataclysm if average planetary temperatures rise another few tenths of a degree, due to using fossil fuels for reliable, affordable energy, raw materials for over 6,000 vital products, and lifting billions out of poverty, disease and early death.

Climate alarmism implicitly assumes Earth’s climate was stable until coal, oil and gas emissions knocked it off kilter … and would be stable again if people stopped using fossil fuels.

In the real world, climate has changed numerous times, often dramatically, sometimes catastrophically, and always naturally. Multiple ice ages and interglacial periods, Roman and Medieval warm periods, a Little Ice Age, major floods, droughts and dust bowls all actually happened – long before fossil fuels.

Data for tornadoshurricanes and other extreme weather events prove they are not getting more frequent or intense. You might argue that Harvey and Irma marked a sudden increase in major hurricanes in 2017 – but that’s only because after Wilma there’d been a record twelve years of zero Category 3-5 hurricanes.

He makes the point that if people would bother to look at the data and figure out that the headlines come from models that can be configured to get any answer desired that the reasons for the transition would evaporate:

We need to ignore the fear-mongering, look at actual historic records, and recognize that more dangerous, unprecedented calamities upward trends simply aren’t there. We need to insist that alarmists distinguish and quantify human influences versus natural forces for recent temperature, climate and weather events – and show when, where and how human activities replaced natural forces. They haven’t done so.

The only place manmade temperature and climate catastrophes exist is in Michael Mann and other GIGO computer models. These climate models are worthless for policymaking because they aren’t verified by actual measurements, don’t account for urban heat island effects, and cannot incorporate the vast scale and complexity of atmospheric, planetary and galactic forces that determine Earth’s climate.

Another over-looked point is the impacts of cold weather relative to warm weather:

In reality, people and planet are threatened far more by global cooling than warming. Even a couple degrees drop in average global temperatures would drastically reduce growing seasons, arable land, plant growth, wildlife habitats and agricultural output – especially if it’s accompanied by reductions in plant-fertilizing atmospheric carbon dioxide levels. Plants, animals and people would face starvation.

He goes on to point out that fear mongering about climate change is not the only flawed story.  The idea that there is a solution that is simple and cost-effective is equally unsound:

We’re also told ruling elites could prevent this imagined crisis by switching us to wind, solar and battery power. (They also want to eliminate cows and modern agriculture, over misplaced concerns about methane and fertilizer, but that’s another discussion.)

Build a coal, gas or nuclear power plant – and unless governments shut it down or cut off fuel supplies, the plant provides plentiful, reliable, affordable electricity nearly 24/7/365 for decades. Build a massive sprawling wind or solar installation, and you have to back up every kilowatt with coal, gas or nuclear power – or with millions of huge batteries – for every windless, sunless period.

The economic and ecological effects would be ruinous.

Driessen does a good explaining the qualities that make fossil and nuclear generating the best choice for providing power to society:

 Coal, gas and nuclear plants can be built close to electricity-intensive urban centers. Tens of thousands of wind turbines and billions of solar panels must go where there’s good wind and sunshine, far from urban areas, connected by high voltage transmission lines. In fact, for Net Zero, says the International Energy Agency (IEA), the world would need 50,000,000 miles of new and upgraded transmission lines by 2040!

All those “clean, green, renewable, sustainable, affordable” wind, solar and battery systems, backup generators, transmission lines and electric vehicles would require millions of tons of iron, copper, aluminum, manganese, cobalt, lithium, concrete, plastics and numerous other metals and minerals.

Onshore wind turbines require nine times more materials per megawatt – and offshore turbines need fourteen times more – than a combined-cycle natural gas power plant, the IEA calculates. Solar panels and EVs have the same problem.

To get these materials, billions of tons of overlying rock must be removed to reach billions of tons of ores – which then must be processed in huge industrial facilities that use mercury and toxic chemicals … emit vast quantities of greenhouse gases and toxic pollutants … and are powered by coal or natural gas. Many components for these “green” technologies are derived from oil and natural gas.

US and other Western facilities control and recycle these pollutants. Chinese and Russian facilities pay little attention to air and water pollution, workplace safety, or fossil fuel use, efficiency and emissions – yet they supply over 80% of “renewable” energy raw materials, because the West increasingly bans mining and processing and makes energy prohibitively expensive to operate mines and factories.

Pseudo-renewable energy worldwide would cost hundreds of trillions of dollars, would have to be subsidized by trillions of taxpayer dollars, and would dramatically increase electricity rates.

Ultimately, I think the public will balk at the transition when the costs become clear.  Driessen explains:

Electric vehicle, appliance and heating mandates would double or triple all these infrastructure, materials, mining and land use requirements, ecological impacts and costs.

American residential electricity prices in 2023 ranged from 10.4¢ per kilowatt-hour (Idaho) to 28.4¢ per kWh (California). British families paid 47¢ per kWh! UK factories and businesses paid up to three times what their US counterparts did. German families, factories and businesses are in the same capsizing boat.

But EU industrial leaders say energy prices must continue rising, to cover the soaring costs of the “energy transition.” If they don’t, factories, jobs and emissions will move overseas. But if they do, families will freeze jobless in the dark.

In the face of these obvious problems I often wonder why the net-zero transition has so much momentum.  I agree with Driessen’s suggestion:

What many call the Climate Industrial Complex has a monumental stake in perpetuating this situation. Collectively, its members have incredible power, control much of government and education, hold enormous financial stakes in green tech subsidies, and often censor contrarian viewpoints.

There is another troubling problem.  The plans for the energy transition simply cannot work.  When they don’t there are hints that life style changes will be mandated:

Just as ominous, if it becomes clear that the Brave New World of Net Zero Energy cannot provide sufficient affordable electricity and other necessities for modern industries, healthcare and living standards, two-thirds of America’s ruling elites favor food and energy rationing to combat climate change and retain their anti-capitalism, anti-growth agenda. It’s likely the same in Europe and Canada.

The Biden Administration and other governments are already dictating the kinds of vehicles we can drive and what appliances and heating systems we can use. They’re already exploring ways to limit the kind and size of homes we can live in, how warm and cool we can keep them, how often we can travel by air, the kinds and amounts of meat we can eat, and many other aspects of our lives.

New York State has never quantified the potential effect of their GHG emission reduction policies on the climate or admitted that New York emissions relative to other countries are insignificant:

Meanwhile, China, India, Indonesia and dozens of other countries are building hundreds of coal and gas generating units – further underscoring the insanity and futility of trying to control energy sources, quantities and emissions.

He concludes that the politicians currently in power have to be voted out to stop the transition:

This is what America’s 2024 state and national elections are about – and elections in Europe, Canada, Australia and elsewhere. The longer these elites remain in power, the more our liberties, lives and living standards will resemble life a century ago under authoritarian regimes. Vote accordingly.

Conclusion

New York’s net-zero transition is going to cause more harm than good.  Current energy system levels of reliability, affordability, and effects on the environment will be impacted negatively.  This has always been a political construct so the only way to change it is to change the politicians in charge.

New York Cap and Invest – The Role of Cap-and-Invest

On January 23, 2024 the New York State Department of Environmental Conservation (DEC) and the New York Energy Research & Development Authority (NYSERDA) hosted the first webinar of this year’s New York Cap-and-Invest (NYCI) Program stakeholder engagement process.  This post presents my initial impressions of the first webinar in a series of three. 

I have followed the Climate Act since it was first proposed, submitted comments on the Climate Act implementation plan, and have written over 380 articles about New York’s net-zero transition. The opinions expressed in this post do not reflect the position of any of my previous employers or any other organization I have been associated with, these comments are mine alone.

Overview

The Climate Act established a New York “Net Zero” target (85% reduction in GHG emissions and 15% offset of emissions) by 2050.  It includes an interim 2030 reduction target of a 40% reduction by 2030 and a requirement that all electricity generated be “zero-emissions” by 2040. The Climate Action Council (CAC) is responsible for preparing the Scoping Plan that outlines how to “achieve the State’s bold clean energy and climate agenda.”  In brief, that plan is to electrify everything possible using zero-emissions electricity. The Integration Analysis prepared by the New York State Energy Research and Development Authority (NYSERDA) and its consultants quantifies the impact of the electrification strategies.  That material was used to develop the Draft Scoping Plan outline of strategies.  After a year-long review, the Scoping Plan was finalized at the end of 2022.  In 2023 the Scoping Plan recommendations were supposed to be implemented through regulation, PSC orders, and legislation.  Not surprisingly, the aspirational schedule of the Climate Act has proven to be more difficult to implement than planned.  Many aspects of the transition are falling behind and the magnitude of the necessary costs is coming into focus.  When political fantasies meet reality, reality always wins.

Cap-and-Invest

The Climate Action Council’s Scoping Plan recommended a market-based economywide Cap-and-Invest Program.  It is supposed to establish a declining cap on greenhouse gas emissions, limit potential costs to New Yorkers, invest proceeds in programs that drive emission reductions in an equitable manner, and maintain the competitiveness of New York businesses and industries. Cap-and-Invest will ensure the state meets the greenhouse gas emission reduction requirements set forth in the Climate Leadership & Community Protection Act (Climate Act).

The reality is different particularly because environmental activists want to remove certain components that have made similar programs work in the past.  Further background information is available at my carbon pricing initiative page.

NYCI Implementation

The NYCI website describes the implementation plan:

This process will solicit crucial feedback from individuals and stakeholder groups to build out an equitable program that balances interests while ensuring the State meets its greenhouse gas emission reduction objectives. New York’s Cap-and-Invest Program will draw from the experience of similar and successful programs across the country and the world that have yielded sizeable emissions reductions while catalyzing the clean energy economy.

In the First Stage of Pre-Proposal Outreach DEC, and NYSERDA hosted a series of webinars in June 2023. DEC and NYSERDA have now entered into the Second Stage of Pre-Proposal Outreach and will continue to host workshops to gather feedback on the program as we develop regulations to implement the Cap-and-Invest Program. See the Events page for more information on upcoming webinars and recordings of past webinars.

In this stage of the pre-proposal outreach DEC and NYSERDA are seeking feedback on a outline of questions and descriptions for NYCI implementation.  They want feedback by March 1 and plan to have the regulation in place by the end of 2024.   The first webinar described the role of NYCI. Subsequent webinars will review the pre-proposal outline and describe an analysis of expectations for allowance prices and emissions trajectories.  I will address those webinars here as well.

Webinar Overview

The entire webinar was scripted.  Each presenter read their remarks and it even appeared that the responses to questions were vetted.  For example, in the overview Doreen Harris, President of NYSERDA read the Guiding Principles for NYCI.  The narrative is that under Governor Hochul’s direction, New York’s cap & invest program will incorporate these guiding principles:

  • Affordability. Craft a program to deliver money back to New Yorkers to ensure energy affordability
  • Climate Leadership: Catalyze other states to join New York, and allows linkage to other jurisdictions
  • Creating Jobs and Preserving Competitiveness: Protect existing jobs and support new and existing industries in New York
  • Investing in Disadvantaged Communities: Ensure 35%+ of investments benefit Disadvantaged Communities
  • Funding a Sustainable Future: Support ambitious clean energy investment

She mentioned that two thirds of the revenues collected will be used to support the transition but that they would be looking for suggestions for investments.

Jonathan Binder from DEC gave a high-level overview of NYCI.  He explained that the “Climate Action Council’s final Scoping Plan recommends – and Governor Hochul’s 2023 State of the State Address and the FY 2024 State Budget advanced – an economywide Cap-and-lnvest Program.”  He noted that DEC and NYSERDA have been developing the plan to implement NYCI.

The following slide describes the emission reduction requirements.  Note that between 2021 and 2030 NYS GHG emissions will have to decrease from 368 million metric tonnes (MMT) to somewhere under 246 MMT.  This represents a reduction of 33% but there was no mention of feasibility.  It was mentioned that the plan is to get on the trajectory to meet the 2030 target.

Ona Papageorgiou continued the overview description.  The following slide shows how NYCI is supposed to fit in with other programs, investments, and regulations.  She also described the role of NYCI following the narrative script.  First, there was the obligatory comment that “New Yorkers are feeling the effects of climate change.”  In yet another misunderstanding between weather and climate the script said “In 2023 alone we experienced air choked with wildfire smoke, flooding in NYC and the Hudson Valley, extreme snowstorms in Buffalo, and more.”  No mention was made how NYCI could possibly affect those weather events given that New York’s emissions are less than half a percent of global emissions.

The script made the point that “Cap-and-invest and similar programs are internationally accepted as a core component of a credible decarbonization strategy.”  I agree that this approach is widely used.  The script went on to state that the Climate Action Council’s Scoping Plan recommended cap-and-invest as the most cost-effective means of achieving decarbonization. For the record, that was taken as an article of faith and not proven.

The following two statements in the script hint at the ramifications of the plan.  It claims that “Cap-and-invest ensures New York will minimize costs by reducing emissions first in sectors where it is cheapest to do so.”  That is the theory so I will not disagree.  The second statement includes my highlights:

NYCI pairs a disincentive for continued use of fossil fuels with robust funding to support the energy transition. It is an essential complement to existing investments and regulations intended to reduce emissions and drive a clean energy transition.

Therein lies the ramification for New Yorkers.  The disincentive for continued use of fossil fuels is to make it expensive enough that users will switch to other technologies or use less.  For anyone who does not have the option for another technology or who cannot meaningfully use less fossil fuel the NYCI result is a regressive tax on energy use.

The narrative script claimed that “cap-and-invest and similar pricing mechanisms are a well-tested mechanism for addressing climate change.”  New York has been a big proponent of the Regional Greenhouse Gas Initiative (RGGI) and the script claims that RGGI achieved 50% reduction in CO2 emissions.  That statement is simply wrong.  I blog about the details of the RGGI program.  I have found that although CO2 emissions in the RGGI region are down around 50% since the start of the program, RGGI funded control programs have only been responsible for 6.7% of the observed reductions.  When the sum of the RGGI investments is divided by the sum of the annual emission reductions the CO2 emission reduction efficiency is $927 per ton of CO2 reduced.  Both of these findings should be of concern, but they are not even acknowledged.

Vlad Gutman-Britten (NYSERDA) read the script for the “Cap-and-Invest Program: How it Works” section of the webinar.  He explained:

  • Large-scale GHG emitters and distributors of heating and transportation fuels will be required to purchase allowances for the emissions associated with their activities.
  • NYCI will incentivize businesses and other entities to transition to lower- carbon alternatives.
  • Proceeds will support:
    • Consumer Climate Action Account that will deliver at least 30 percent in future Cap-and-Invest proceeds to New Yorkers every year to mitigate consumer costs.
    • Industrial Small Business Climate Action Account that will deliver up percent in proceeds to support energy affordability for small businesses.
  • Climate Investment Account that will direct two-thirds of future Cap-and-Invest proceeds to support the transition to a less carbon-intensive economy.

A series of slides were presented that described how cap-and-invest programs are supposed to work.  The first slide showed example marginal abatement costs across a curve.  In this slide it shows that there are choices that will result in lower emissions (green wedge).  Those choices are made “based on upfront costs, costs over time to operate, and other factors.” Example: an LED lightbulb costs more up front but reduces electricity costs over time.  Even though this an illustrative example there is no expectation that there are enough of these options to get to the Climate Act target limits.

A cap-and-invest program is supposed to modify the costs of control strategies.  The following slide explains the general approach.  Note that it explicitly says these programs include trading and banking.  There is a vocal minority of ideologues who think that trading and banking is inappropriate.  For example, Assemblywoman Kelles has introduced A08469 that “establishes an economy-wide cap and invest program to support greenhouse gas emissions reductions in the state “ that includes the requirement  that it “must be implemented with input from impacted communities to avoid the harms we have seen from other pollution pricing mechanisms that have relied on ‘trading’ the right to pollute disadvantaged communities”.  It is encouraging that the webinar confronted this mis-conception head on.

The next slide in this series explained that when a cap-and-invest program is implemented investment decisions change.  The added cost of the allowances makes “Investment in pollution reductions become cost effective because it’s cheaper to cut those emissions than purchase allowances (yellow wedge)”.  In my opinion, however, the incremental costs of the allowance price necessary to make those investments cost-effective is higher than what is politically acceptable.  I guessed that that in order to make the emission reductions needed investments between $15.5 and $46.4 billion per year will be required.  I don’t think that range is politically palatable.  The slide also pointed out that proceed investments can be used to reduce emissions so that decision-makers will have “even more of an incentive to choose to invest in decarbonization (orange wedge).”

The next slide addressed flexibility mechanisms that are included to address unforeseen circumstances.  They are proposing to include price stability features included in RGGI: a price floor, emissions containment reserve, and a cost containment reserve.  They explain that they are:

“intended to make the system resilient to unexpected changes—sharp and unanticipated emission reductions (e.g., the transition away from coal) or energy shocks (e.g., as witnessed during COVID-19).”  The slide emphasizes the price ceiling explaining that “If clean energy technology faces substantial barriers (supply chain issues, inadequate workforce, unavailable mitigation options, etc.)” that without some restrictions that costs could explode.  The proposed solution is “a price ceiling where unlimited compliance instruments are issued at a predetermined price.”  This limits emission reductions temporarily until the market catches up.  These allowance are explicitly created just for this compliance requirement.  That ensures that facilities will not shut down because they don’t have sufficient allowances.  Among the many unresolved issues is what that means to the Climate Act targets.  If they have exceed the limit but kept the lights on and did not induce an artificial energy shortage that is a good thing.  But the climate activists will have a fit.

The next slide addresses a fundamental issue of a single jurisdiction GHG emissions reduction program intended to address a global problem.  When New York acts alone its programs can cause “leakage” i.e., “shifting activity out of New York and to other locations with higher emissions.”   New York industry is already among the most efficient in the country which makes further improvements more costly and reduces the potential total reductions.  The NYCI pre-proposal recommends “providing no-cost allowances to industry at risk of leakage in amounts that decline every year”.  This sounds fine in theory but in practice I suspect it will not be very effective.

Hillel Hammer (NYSERDA) read the script for the “Current Emissions” section of the webinar.  This session set the stage for the Preliminary Analysis Overview webinar later in the week.  That analysis is supposed to cover emissions and costs.  Environmental Justice advocates have created a story that peaking power plants in New York City are “perhaps the most egregious energy-related example of what environmental injustice means today”  and are demanding that they be shut down as soon as possible,   The single-minded focus on the evils of these facilities extends to demands that NYCI not increase emissions within disadvantaged communities (DACs) near the power plants.  According to the script inhalable particulate (PM2.5) emissions are primarily from other sources.  The following slide shows that “Individually controlled (permitted) stationary sources, including electric generation units, large industrial sources, and large commercial and institutional sources represented approximately 4% of the total.”

The next slide describes the sources that create inhalable air pollution burdens in New York.  It points out that:

  • Individually controlled (permitted) stationary sources yield a minority of the air pollution emissions in New York.
  • In 2020, electric generation units represented 8.5% of non-wood fuel combustion PM25 emissions in NY, and other permitted sources represented approximately 3.5%.
  • Area and mobile sources dominate, which means that individual stationary source-focused policy is important but doesn’t address the bulk of sources.

The message is that addressing permitted stationary sources does not address the bulk of the problem in DACs.

The next slide addressed electricity sector emissions.  It states that:

  • Existing policies will go a long way to addressing sources of emissions in the electric sector.
  • RGGI, the Clean Energy Standard, and other programs will substantially reduce the use of fossil fuels for our electricity needs.
  • The Peaker Rule will ultimately retire the most polluting plants in New York. 35 peaking units representing 955 MW have already retired and an additional 265 MW are expected to retire in 2025.
  • NYCI cannot be designed to compel the closure of individual generators, and pricing may not reduce the use of peaking facilities.

The final item bluntly points out that NYCI is the wrong tool to use to try to shut down the peaking power plants.  During the presentations and in the pre-proposal outline the DEC has suggested that their preferred approach is to limit emissions from sources in DACs using permit conditions in other programs.  I agree with DEC on this line of reasoning.  Trying to control a local air quality problem with a GHG emissions program designed to address global impacts is absurd.  However, logic and reason are not the primary drivers of the environmental justice advocates.  They rely on emotion.  It will be interesting to see if they accept these arguments or demand something different.

The next slide addressed transportation emissions:

•              Advanced Clean Cars II and Advanced Clean Trucks will drive substantial uptake of zero emission vehicles across all classes.

•              Commitments to all-electric school buses will support change for those vehicles that directly burden children.

•              Investments like the Clean Transportation Prizes target market transformation in the most impactful geographies.

•              NYCI would provide essential revenue and price signal to ensure achievement of existing policies in addition to advancing greater ambition.

In this slide and the previous one, the transformation claims in the bar charts are based on the Integration Analysis.  Based on my evaluation of the draft Scoping Plan analyses that used the Integration Analysis I am skeptical of the emission reductions expected.

The final slide associated with the emission reduction policies claims that “NYCI will accelerate New York’s emission reduction policies and programs that advance building decarbonization”.  This is where the claims deserve more attention.  It says that “NYCI will put electricity on a more level playing field with fossil fuels, helping support building efficiency and electrification”.  That occurs when the cost of carbon added by NYCI makes fossil fuels more expensive and reduces the present cost advantage of fossil fuels relative to electricity.  It claims that “In particular, NYCI will support adoption of heat pumps, especially replacing heating oil.”  However, everything I have seen suggests that heat pumps are already cost competitive with heating oil furnaces but that they are nowhere close for natural gas furnaces.  The final bullet point says that “NYCI will create a new investment mechanism for building transition.”  Presumably that means that revenues from the auction will subsidize building electrification.

The other section of this slide states that “NYCI will also help deploy zero emission vehicles faster than with current policies alone”:

  • This is especially the case for medium and heavy-duty vehicles and non-road engines, where existing regulations are less stringent than for light duty. Diesel engines are also especially impactful in many Disadvantaged Communities.
  • NYCI will even the playing field for clean transportation, and the revenue will create financial support also for hard-to-electrify vehicles, supporting not only focused investment in electrifying these impactful sources, but also growth of hydrogen fuel cell vehicles used in long- haul heavy-duty and non-road applications.

While the theory suggests, and the results may show some benefits, I do not think there will be meaningful impacts.  This is another situation where the demand is inelastic, and the alternatives have so many downsides that it would take an enormously expensive carbon cost to justify meaningful conversions.

There was a session on “Delivering Equitable Benefits” but I am not going to discuss them much here.  One point made does deserve mention “The Climate Act requires that DEC’s NYCI regulation not result in net increases in co-pollutant emissions or disproportionately burden disadvantaged communities”.  The DEC and NYSDERDA analysis need to prove that is the case.

Conclusion

I was worried because environmental activists want to remove certain components that have made similar trading programs work in the past.  The DEC and NYSERDA proposal confronts that line of reasoning in order to preserve the expectations that NYCI will work the same as other programs.

There is an enormous effort necessary to get this program in place and operational by the end of the year.  I don’t think it is possible and I suspect that there are insufficient resources at the state agencies to make it even close.  Unfortunately, the likely outcome is a poorly designed and implemented program.  Worse it could end up causing more problems and adding costs.  Stay tuned.

Dutchess County Comments on the Central Hudson Climate Act Implementation Plan

One of my readers sent me some documents related to the implementation of New York’s Climate Leadership & Community Protection Act (Climate Act) from the Central Hudson rate case, CASE 23-E-0418.  I asked if I could credit him for providing the material for this post but he prefers to be anonymous: “I don’t need the re-education task force tracking me down.”  This post highlights some commonsense issues related to the effects of Climate Act implementation on a utility rate case.

I have followed the Climate Act since it was first proposed, submitted comments on the Climate Act implementation plan, and have written over 380 articles about New York’s net-zero transition. The opinions expressed in this post do not reflect the position of any of my previous employers or any other organization I have been associated with, these comments are mine alone.

Overview

The Climate Act established a New York “Net Zero” target (85% reduction in GHG emissions and 15% offset of emissions) by 2050.  It includes an interim 2030 reduction target of a 40% reduction by 2030 and a requirement that all electricity generated be “zero-emissions” by 2040. The Climate Action Council (CAC) is responsible for preparing the Scoping Plan that outlines how to “achieve the State’s bold clean energy and climate agenda.”  In brief, that plan is to electrify everything possible using zero-emissions electricity. The Integration Analysis prepared by the New York State Energy Research and Development Authority (NYSERDA) and its consultants quantifies the impact of the electrification strategies.  That material was used to develop the Draft Scoping Plan outline of strategies.  After a year-long review, the Scoping Plan was finalized at the end of 2022.  In 2023 the Scoping Plan recommendations were supposed to be implemented through regulation, PSC orders, and legislation.  Not surprisingly, the aspirational schedule of the Climate Act has proven to be more difficult to implement than planned and many aspects of the transition are falling behind, and the magnitude of the necessary costs is coming into focus.  When political fantasies meet reality, reality always wins.

Central Hudson Rate Case

Central Hudson Gas & Electric Corporation (Central Hudson) is a “regulated transmission and distribution utility serving approximately 315,000 electric customers and 90,000 natural gas customers in a defined service territory of New York State’s Mid-Hudson River Valley”.  On July 31, 2023 Central Hudson submitted revisions to its electric and gas rates (“Rate Case”).  It includes double-digit gas and electric delivery rate increases and the public outcry has been intense.  In this post I highlight some of the issues that affect costs that are imposed by the Climate Act.

There is a dynamic at work for all New York corporations relative to the Climate Act.  All companies know it is going to cost a lot of money, threaten reliability and will not make much of a difference to global warming.  However, not unlike the Star Trek line used by “the Borg in the series, who assimilate various cultures into their own and warn the encountered species, that ‘resistance is futile’”, companies have few options opposing the Climate Act.  If they publicly oppose the Climate Act well organized environmental organizations will claim that they are against solving the existential threat of climate change.  Recent administrations in New York have an outsized and weaponized influence on regulatory actions.  As a result, criticizing a political policy will adversely affect doing business with state agencies and very likely impact the outcome of rate cases.  There are no upsides to opposition in my opinion.

Central Hudson has done about as much as they could to educate their customers.  Their Energy in Transition webpage addressed the question: “How quickly can we transition to an energy system that protects the environment without compromising highly consistent and reliable service at a reasonable cost?”.  It describes the Climate Act, outlines Central Hudson’s position, and includes examples of what people are saying about the risks of the net-zero transition.  Also included are videos on implementation of the Climate Act and New York Independent System Operator (NYISO) videos that help New Yorkers understand the important changes and challenges ahead.  All this is accompanied by the following:

Residents and businesses should be aware of the changes that are coming and help shape the transition by contacting your state legislator or contacting the Governor’s office if you have thoughts about how these changes may affect you.

On the other hand, the balance between trying to appease politicians and providing customers with electric and gas service upon demand at a reasonable price is a challenge.  The primary point in the comments described below is that Central Hudson went too far trying to appease the State at the expense of its customers.

Climate Leadership and Sustainability Panel

In the initial submittal Central Hudson included the Direct Testimony of its Climate Leadership and Sustainability Panel (CLSP) along with exhibits.  The stated purpose of the Panel’s testimony in the Rate Case says:

Central Hudson has made substantial efforts and investments to facilitate and support New York State’s decarbonization and environmental justice objectives as established within New York State’s Climate Leadership and Community Protection Act (“CLCPA”). The Panel will first outline the requirements of the CLCPA itself, as well as the outcomes of the Company’s facilitation and support of the CLCPA goals. The Panel will explain the need for a deferral mechanism for costs that are incurred in support of CLCPA compliance. The Panel will also present the Company’s completed, ongoing, and planned activities that are consistent with the CLCPA, including the Company’s Sustainability Strategy and Efforts; Climate-Driven Planning, Studies, and Reporting; Gas Initiatives; Electric Vehicle (“EV”) Make Ready Programs (“MRP”), Supplemental EV programs; Electrification of Central Hudson’s fleet; and the Company’s Onsite Solar Proposal. The Panel will explicitly identify the Company’s proposed CLCPA-aligned initiatives and associated recovery mechanisms within this proceeding.

Rate Cases and the Climate Act

This post highlights the Direct Testimony of Allan R. Page on behalf of Dutchess County New York:  “The primary purpose of his  testimony is to “express the concerns of Dutchess County as the concerns relate to how climate is being addressed in these rate cases.”  He founded A. Page & Associates after a 32-year career with Central Hudson.  His testimony focused on Central Hudson’s proposed expenditures to meet the requirements of the Climate Act.

In the testimony, Dutchess County gave reasons why “Central Hudson should not pursue any emissions reduction initiatives beyond what is required by state regulation” as proposed by its Climate Leadership and Sustainability Panel. The testimony expressed “concern about the overall cost of achieving state clean energy policy objectives and the impact such costs will have on customers”, stated that “emissions reduction efforts within New York State will have little impact on the global climate and that New Yorkers, including those residing in disadvantaged communities (“DACs”), may not directly benefit. For these reasons”.

I address three of the Dutchess County concerns raised: the costs and customer benefits of clean energy investments, funding for the supplemental electric vehicle programs; and the company’s onsite solar proposal.  The Direct Testimony of Allan R. Page (“Dutchess County Testimony”) and the Rebuttal Testimony of the Climate Leadership and Sustainability Panel (“Rebuttal Testimony”) documents in the Public Service Commission docket for the Central Hudson rate case proceeding were used for the following.

Clean Energy Investments

The Dutchess County Testimony describes Panel proposals that will increase costs with minimal benefits to customers.  For example, it notes that Central Hudson’s is “taking ‘significant steps’ ‘to enhance corporate focus on sustainability and incorporate climate change considerations into its operations’ while building upon ‘understanding stakeholder interests” but points that the focus “does not

come free of change” nor does it provide tangible benefits to its customers.

The Rebuttal Testimony comment summarizes the Dutchess County concerns with clean energy investments:

The Panel acknowledges Dutchess County’s concerns regarding the overall cost of achieving the CLCPA emissions reduction and clean energy goals. The future costs, as well as responsibility for those costs, are not fully understood at this time. The Company supports a balance, one where safety, reliability, and just and reasonable rates are core elements of the Company’s utility planning and operations, while the incorporation of clean energy initiatives provides support for the achievement of New York’s CLCPA targets. As Dutchess County indicates in its testimony, “Through PSC regulation and orders, balance is defined.” The Company’s clean energy investments are consistent with those included in recent Public Service Commission (“PSC” or “Commission”) orders approving utility rate plans.

The statement that “future costs, as well as responsibility for those costs, are not fully understood at this time” is absolutely true.  To the defense of Central Hudson, the Scoping Plan is no more than an outline of control strategies with incomplete cost documentation.  There has never been a feasibility analysis to determine how the strategies might work and how the costs might be assigned.  Dutchess County Testimony correctly points out that the ratepayers will be the losers as a result.

The Rebuttal Testimony responds to an estimate of total costs where they claim “Dutchess County’s testimony is inconsistent with a Company interrogatory response relating to the cost of carbon reduction”:

Dutchess County seems to have inadvertently mixed and matched parts of the Company’s response. First, the net present value of $300 billion was identified in the response as a modeling estimate in the January 2022 Climate Action Council Scoping Plan, noting that the predicted costs through 2050 that underlay that net present value calculation ranged from $594 billion to $627 billion, in 2020 dollars.

Second, our response also stated that these costs are relative to (i.e., net of) the Climate Action Council Scoping Plan Reference Case costs of $4.269 trillion, in 2020 dollars, through 2050 but we did not describe what the Reference Case includes. Absent clear definitions in the Scoping Plan documentation, we do know with certainty what comprises the Reference Case. As a result, Central Hudson neither stated nor implied that the costs in New York related to the reduction of carbon are around $4.6 trillion.

Both testimonies miss a complicating factor in the interpretation of the Reference Case results.  Contrary to usual practice the Scoping Plan baseline was a case that included “already implemented” programs.  In other words, there are some programs incorporated into the Reference Case that only exist to reduce GHG emissions.  As a result, I agree it is impossible for anyone to determine the total Climate Act costs.  Again Central Hudson ratepayers are the losers.

Supplemental Electric Vehicle Programs

Dutchess County recommended the removal of funding for the Company’s Supplemental Electric Vehicle (“EV”) Programs.  The Dutchess County Testimonial stated:

Fifth on the list of Panel proposals, deals with electrifying the Central Hudson fleet of vehicles. Certainly, as vehicles are retired and a competitive EV market exists for the replacement of similar in-kind vehicles, EV’s should be purchased. However, to prematurely replace existing functional vehicles to advance climate goals in other market sectors unfairly burdens electric customers with addressing the emission needs of other sectors of the New York State economy. The transportation sector should be pulling its fair share to address climate change. The Panel’s position that it desires to lead by example is misplaced. The example that customers desire most from Central Hudson is a high quality, reliable energy product at the lowest reasonable price.

In a victory for commonsense Central Hudson agreed to remove these programs from this proceeding.  The company and the PSC Staff agreed that sufficient funding was available within its authorized EV Make-Ready programs to conduct the additionally proposed activities.

Central Hudson Onsite Solar Proposal

The CLSP proposed the installation of solar arrays on Central Hudson offices in Catskill, Kingston. Eltings Corners, and Poughkeepsie. Dutchess County Testimony note that “Justification for the installations is that Central Hudson desires to be a “role model and leader in promoting local and carbon-free technologies.”  Some quotes from the arguments:

Central Hudson customers have been exposed to significant amounts of leadership distribution in the State of New York. If there is one area in New York State where the State can claim a significant amount of leadership distribution it is in the area addressing climate change. Electric customers are or will be on the hook for contributing billions of dollars of personal fonds to meet the State’s leadership initiatives.

……

From the current day to 2050 the State measures success through partnerships, outreach and education. and workforce and economic development. implementing the Plan produces no measurements of electric or natural gas customer cost savings, or reducing climate change threats, or reducing carbon in the atmosphere in Dutchess County.

……

To reiterate. Central Hudson’s desire to “support the state’s ambitious solar generation goals” increasing customer costs to Dutchess County customers. in order to promote partnerships, education, and development, provides no tangible Dutchess County customer benefits.

The Rebuttal Testimony responds to the question whether Central Hudson agrees with Dutchess County’s characterization of the Company’s Onsite Solar proposal as increasing customer costs without providing tangible benefits?

No.  The Onsite Solar proposal benefits customers in that it contributes to CLCPA emissions reductions targets and by setting an example, the project could encourage customers to participate in distributed generation projects, which lower their energy costs.

They did not respond to the reasons provided in the Dutchess County Testimony.  Probably because there is no reasonable response.  In my opinion, this Central Hudson program is transparent pandering to the State’s narrative. 

It is also possible that the company has looked at the long-term and thinks an energy future where everything is electrified might be good business.  That is disappointing because I believe there are plenty of technical people at the company that know that the Climate Act net-zero transition plan is impossible on the mandated schedule and very unlikely in any event.  There are too many untested components necessary for reliability and too many upgrades to infrastructure to keep it affordable.

Conclusion

I believe that low cost and reliability are overarching concerns for electric and gas ratepayers.  The Hochul Administration has been hiding the total costs of the transition throughout the process.  The other missing piece is an energy plan feasibility study that would enable Central Hudson to determine what aspects of the transition they will be expected to implement.  This uncertainty and the desire to placate the political aspirations of the Administration to improve the chances for a favorable rate case outcome ultimately impacts ratepayers negatively.  The double-digit rate increases for this Central Hudson rate case will become the norm until New Yorke voters demand the politicians back off.

There are many good points in the Dutchess County Testimony relevant to the Climate Act net-zero transition.  The following example sums up the problem:

The purpose of Dutchess County government is to serve the citizens of the County and to fulfill its fiduciary responsibilities to provide a safe clean environment promoting fulfilling life styles. In commenting on the Draft Scoping Plan, the County points out the economic pain being imposed on individuals and businesses and the extreme societal risk created by replacement of reliable, secure energy infrastructure with intermittent renewables. While affirming its support for solar and wind power the County notes that the feasibility of meeting arbitrary timing mandates is slim to none but in the process of attempting to meet those mandates the State will require that residents help fund trillions of dollars of unproven energy systems. CO2 emissions are a world-wide phenomenon and for all the pain, sacrifice, and cost the State’s contribution to the reduction in world wide emissions is miniscule. The transition required under the Plan for transportation, buildings, residences, is massive and to avoid catastrophic New York State economy collapse a modified plan is imperative.

Articles of Note January 21, 2024

Sometimes I just don’t have time to put together an article about specific posts I have read about the net-zero transition and climate change that I think are relevant.  This is a summary of posts that I think would be of interest to my readers.

I have been following the. Climate Leadership & Community Protection Act (Climate Act) since it was first proposed and most of the articles described below are related to the net-zero transition.  I have devoted a lot of time to the Climate Act because I believe the ambitions for a zero-emissions economy embodied in the Climate Act outstrip available renewable technology such that the net-zero transition will do more harm than good. The opinions expressed in this article do not reflect the position of any of my previous employers or any other company I have been associated with, these comments are mine alone.

Videos

Four reasons renewables are rubbish h/t TS

New York’s climate law – how do we move forward?

New York March To The Great Green Energy Future

Francis Menton uses the work of Nuclear New York to describe the status of the New York transition to net-zero.  He concludes:

Out of 152.3 TWh of electricity produced or imported in 2023, fossil fuels continued to provide 63.3 TWh (41.5%).  Most of the imports (14.5%) are undoubtedly from fossil fuels as well.  Wind/solar/other provided just 12.1 TWh, or 7.9% of the total, barely up from about 6% in 2019.  And that’s now suddenly going to go to 70% by 2030?  Ridiculous.  Meanwhile, the big story leaps off the page, as the Nuclear New York guys emphasize in the headline.  The State forced the premature closure of two nuclear plants in 2020 and 2021, which caused the (carbon free) nuclear share of the total to drop from about 29% to only 18%; and almost all of that was taken up by two new natural gas plants, causing the fossil fuel share of the total to soar from only 34% to 41.5%.  No person looking at this chart would ever conclude that New York has spent the past five years embarked on a crash program to replace fossil fuels with wind and solar.  That process is going absolutely nowhere.

Utility Cost Allocation

Ed Reid, Jr. discusses issues associated with consumers paying for the costs of the net-zero transition.  Reid explains that the proposed electric system that depends upon wind and solar changes the cost allocation dynamics.  It is evident in New York that the money needed to just upgrade the grid are leading to marked rate increases.  I thought this was interesting:

Electric utilities earn a return on net physical plant in service (rate base). They are therefore faced with a Hobson’s Choice. Utilities could require that the intermittent renewable generation attached to their grids be dispatchable, in which case the investment in storage would be made by the renewable developers, increasing their delivered electricity costs, while the utilities” rate base and earnings potential declined as fossil generation was removed from service. Alternatively, the utilities could invest in the storage required to stabilize renewable generator output, increasing the utilities’ rate base investment and earnings potential, while accepting responsibility for increasing electricity costs.

In my opinion, renewable energy developments should be paid one rate for dispatchable power and a much lower rate if not dispatchable.  This would reveal the true cost of their electricity and hasten the inevitable backlash of the transition because it is unaffordable.

Another Take on Alarmist Motives

John Robson at Climate Discussion Nexus argues that the arguments that climate alarmism is a fraud is wrong.  In response to claims that the manipulated temperature data record is a scam he writes:

We take a very different view of al the deliberate and highly unscientific tampering with evidence. We think the zealots at NOAA, and a great many other places, are not trying to scam us with claims they secretly think are untrue. Instead, they are so utterly persuaded that their alarmist theory is right that when the data don’t fit it, as happens often, they conclude that the data must be wrong. For one thing, if they were cheating on purpose, they’d hide it better. And for another we think that after a while the perpetrators of a known fraud would tire of constantly lying. It’s easier to believe climate alarmists are wedded to a flawed theory and have constructed ingenious ways to rationalize its many failures without having to face the possibility that it might be untrue.

Fear of Climate Crisis Solved

Ron Clutz at Science Matters describes an article by John Tamny that explains the root cause of fears about global warming/climate change in his Real Clear Markets article Warming and Left Wing Professors Worry You? You Must Be Rich.  He argues that the worries about climate change come from individuals that do not have to worry about weather extremes because, in large part, fossil fuels have made their lives safer and better.  The result is that they have time to worry about less important issues.  This inability to balance risks and benefits is very frustrating to me and I agree with Tamny that it is a primary driver of the climate risk scare.

Offshore Wind Environmental Impact Assessment

I do not believe that the Hochul Administration has adequately addressed the Climate Act impacts on reliability, affordability, and the cumulative environmental impact of all the wind and solar projects necessary for the net-zero transition.  David Wojick describes the Bureau of Ocean Energy Management Programmatic Environmental Impact Statement for a combination of coming offshore wind projects and concludes that this analysis is a joke.  If you share my concerns about the impacts, please submit comments by February 27.  There is a link to submit comments here.

CO2 Effect on Climate – Miniscule

Pierre L. Gosselin writing at the No Tricks Zone has compiled a list of 160 papers that have found extremely low CO2 climate sensitivity.  The correlation between rising global temperatures and increasing CO2 concentrations does not prove causation!

What is Climate?

Professor Richard Lindzen explains that the notion that global average temperature anomaly constitutes ‘climate’ is attractive due to its simplicity.  Unfortunately, that doesn’t mean that it is correct.