Floating Offshore Wind

Paul Driessen explains why “the materials, costs and survivability for wind turbines on massive floating platforms defy reality”.  I also learned more about floating turbines and wind turbines in general from the comments on this article.

I have an interest in offshore wind because the resource is a key part of New York’s Climate Leadership & Community Protection Act (Climate Act) net-zero transition plan.  I have followed the Climate Act since it was first proposed, submitted comments on the Climate Act implementation plan, and have written over 400 articles about New York’s net-zero transition. The opinions expressed in this post do not reflect the position of any of my previous employers or any other organization I have been associated with, these comments are mine alone.

Can “clean energy” schemes get any crazier?

Paul Driessen’s article notes that Federal agencies are designating area where the sea bed is so deep that a conventional offshore wind turbine won’t work.

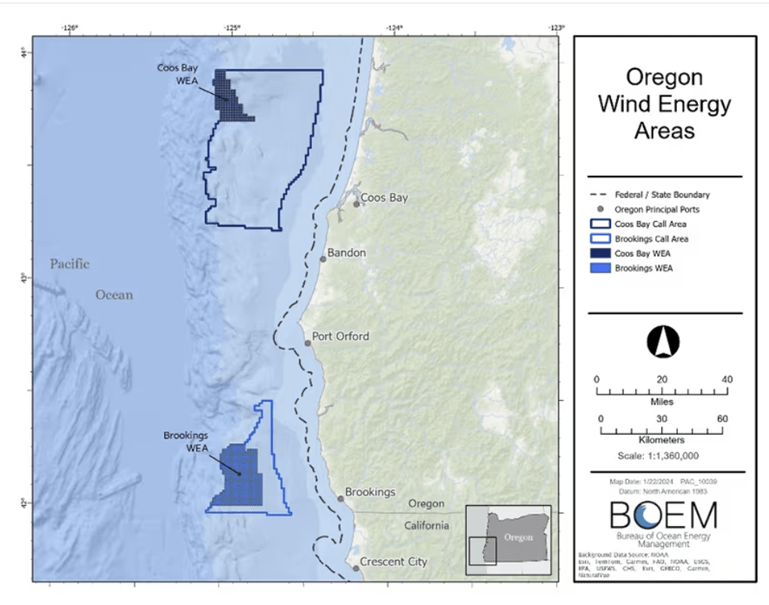
The US Interior Department’s Bureau of Ocean Energy Management recently designated two Wind Energy Areas in deepwater areas off the Oregon coast. BOEM is also reviewing offshore wind energy development options for the Gulf of Maine, Central Atlantic, Gulf of Mexico, and maybe Great Lakes.

They’re part of Team Biden’s plan to deploy 30,000 megawatts of offshore wind energy capacity by 2030 and 15,000 MW of floating offshore wind energy capacity by 2035. Capacity is what the turbines could generate, when the wind is blowing at optimal speeds, perhaps 30-40% of the year.

I was particularly attracted to his article because he used New York as an example of to put these numbers in perspective. For the record, the Climate Act mandates 9,000 MW  of offshore wind and the outline for implementing the transition in the Integration Analysis projects that the 2040 total will be 14,364 MW.  Driessen notes:

30,000 MW is what 2,500 12-MW turbines could generate. It’s enough to meet New York State’s current peak electricity needs on a hot summer day. Add the electricity required to replace gasoline cars and natural gas furnaces and stoves, meet surging AI, data center and streaming video demands, and charge grid-scale backup batteries – and New York alone would likely need 10,000 12-MW offshore turbines.

Meeting the soaring electricity needs of all US states would require hundreds of thousands more.

Not unlike New Yorks shameless promotion of clean energy solutions, Driessen comments on the information accompanying the announcement:

BOEM nevertheless insists that “Offshore wind is a once-in-a-generation opportunity to build a new clean energy industry, tackle the climate crisis, and create good-paying jobs, while ensuring economic opportunities for all communities.”

Note to be outdone in baseless puffery, the Department of Energy extols the Administration’s goal of “decarbonizing” the entire US electric grid by 2035 and says “offshore wind is especially well-suited” for generating “clean energy.” Two-thirds of all US offshore wind potential, it says, exists over ocean areas so deep that turbines must be mounted on floating platforms anchored to the seafloor by mooring lines tied to suction piles sunk into bottom sediments.

DOE even claims it will somehow reduce the cost of floating deepwater wind energy to $45 per megawatt-hour by 2035. (That’s 45¢ per kilowatt-hour, triple what most Americans now pay.) To buttress its claims, DOE presents maps, artist’s renderings and images of floating turbine arrays.

These claims exhibit the same departure from reality as New York:

It’s almost as though these government officials actually believe they can solve the alleged climate crisis by simply issuing proclamations, regulations, drawings, press releases and subsidies – and Voila!

Mines open, raw materials materialize, and millions of wind turbines, billions of solar panels, billions of vehicle and grid-scale batteries, millions of miles of transmission lines, millions of transformers and other technologies get manufactured and installed – affordably and with no fossil fuels, greenhouse gas emissions, toxic air and water pollutants, child and slave labor, or other evils (all at minimal cost), while endangered species and other environmental conflicts disappear (or are relegated to irrelevance) … and cornucopias of clean, renewable, reliable, affordable electricity are rapidly generated worldwide.

Driessen describes some other issues with floating wind turbines:

12-MW offshore turbines are 850 feet tall, carry three 350-foot-long blades, and weigh thousands of tons. To date, few have been installed anywhere, none have been subjected to major hurricanes, and none have been mounted on deepwater floating platforms. Indeed, no such platform-mounted turbines exist outside the realm of concepts and ten-foot models in wind tunnels and test tanks.

The Kincardine floating turbines in the North Sea southeast of Aberdeen, Scotland are much smaller, and the strongest wind gusts recorded there were in the 83–123 mph range. Sustained wind speeds for category 3-5 hurricanes range from 111 to 157 mph and greater. Some of the worst US landfalling hurricanes reached 126 mph (Katrina, 2003) to 167 mph (Andrew, 1997). The strongest winds ever off the Oregon coast exceeded 100 mph (1962 and 1995).

Subsurface and semisubmersible structures for the smaller 2.0–9.5-MW deepwater turbines weigh 2,000 to 8,000 tons. New semisubmersible platforms for deepwater oil production can be over 30,000 tons and cost a billion dollars or more. Yet even they are probably not large enough for the monstrous 15-MW beasts that the Biden Administration, CNN and others are extolling.

The Climate Act mandates that all conceivable associated impacts with fossil fuels are considered.  On the other hand the upstream impacts of the “zero-emissions” resources are ignored.   Driessen points out:

It’s almost impossible to conceive of the amounts of steel and other raw materials that would be needed for each of these gigantic turbines and support systems; the amounts of ore that would have to be extracted to obtain those materials; the fossil fuels required to mine and process the ores, manufacture the turbines, blades and support systems, and transport and install them; the cost to build each of them.

Based on average deposits being mined today, the 110,000 tons of copper required for 30,000 MW of offshore turbine alone would require removing some 65,000,000 tons of ore and overlying rock. That doesn’t include copper for marine cables, transmission lines, transformers and other equipment – or the other metals and minerals.

It is inconceivable that these deepwater wind turbine systems could ever recoup all the energy and costs – or offset all the greenhouse gas emissions – involved in building them, no matter how many years they generate electricity. Indeed, those years may be very short, due to violent storms and constant salt spray. 

Driessen notes that some companies are bailing out of deepwater wind projects but others are still playing the game:

That Shell Oil, among the world’s most experienced offshore oil developers, has dropped out of deepwater wind projects should say a lot about the viability of the far-fetched deepwater schemes Team Biden is promoting, to forcibly transform America’s energy and economic system.

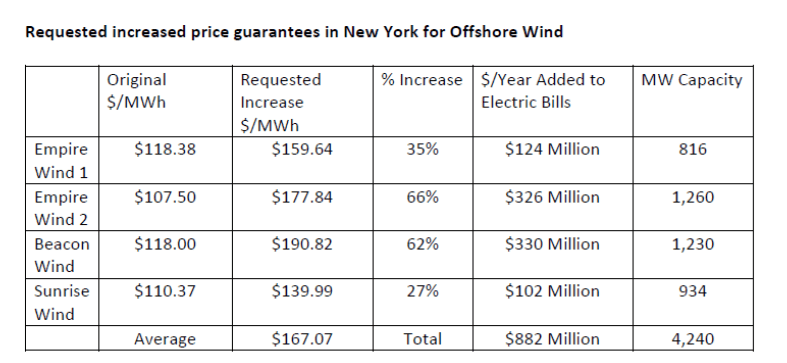
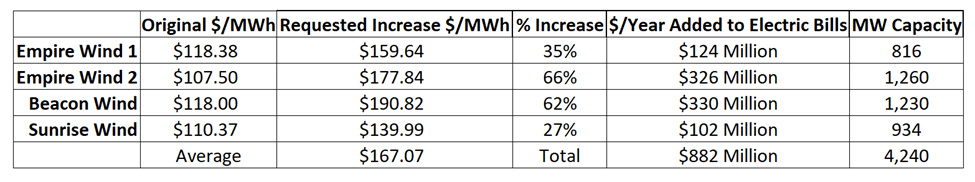
That some companies are still in the game underscores how their risks are being forcibly subsidized and underwritten by taxpayers and consumers, who are being dragooned into these schemes by politicians and bureaucrats who likewise have no real skin in the game. Their leasing bids are plummeting, their electricity price demands soaring.

Interesting Comments

In addition to the article itself there were interesting comments at Watts Up With That.  For example, the following comments provided more background information on floating wind:

David Wojick:

Floating wind is a global craze. DOE has a (long) shot program on it.
https://www.energy.gov/eere/wind/floating-offshore-wind-shot

Here are the basics. There are no utility scale projects in operation.
https://en.m.wikipedia.org/wiki/Floating_wind_turbine#:~:text=The%20technical%20feasibility%20of%20deepwater,oil%20industries%20over%20many%20decades.

My take:
https://www.cfact.org/2023/11/09/cfact-blasts-feds-floating-wind-fantasy/

Dave Andrews:

Orsted have a quick guide to the 4 different types of floating offshore wind – Tension leg platform, Semi submersible, Barge and Spar buoy and their advantages and disadvantages.

https://orsted.com/en/what-we-do/renewable-energy-solutions/floating-offshore-wind-energy

There four interesting comments that addressed issues with these massive machines.

Denis

That salt eats the heck out of everything-a well known fixed data point for all manner of marine (meaning ocean going) structures. Maritime ships, for example, seldom operate more than 30 years because of salt except for some military ships that carry such an abundance of high cost technology that the extraordinary cost to repair salt-induced failures is (or may be) worth it. Ships plying the Great Lakes can easily exceed 50 years or sometimes much more, until their basic economic parameters are exceeded by more recent technology.

Wind turbines fixed in the ocean’s bottom are equally subject to the mayhem caused by salt air in addition to the vagaries of wind speed and direction. Currently, because of these vagaries failure of gears and bearings are the major cost centers in keeping such machines operating. Mount them on floating barges and you add increased bearing and gear loading from the pitch, roll, rise and fall of the barges. Even more maintenance will be required. Yes, maritime ships survive such motions but the bearings and gears (if any) are specifically designed to do this and are truly massive structures, far too heavy to be mounted at the top of a 400 foot tall pole. If the Biden politicians think they barge mounted turbines are a good idea, at the very least, they could build just one or two and see what happens in 10 years before building hundreds.

Their proposal to do the latter is truly truly nutty.

Dr Bob:

I am not a structural engineer, but I can just imagine the torsional loads an 850-foot-tall wind turbine puts on the tower structure and base. The mooring cables would be under tremendous stresses. This paper explores the bucking loads on towers, the most common failure of wind turbines.

Buckling Analysis for Wind Turbine Tower Design: Thrust Load versus Compression Load Based on Energy Methodby Yang Ma,Pedro Martinez-Vazquez andCharalampos Baniotopoulos *
Energies | Free Full-Text | Buckling Analysis for Wind Turbine Tower Design: Thrust Load versus Compression Load Based on Energy Method (mdpi.com)

Eng_Ian:

Torsion is twisting, you can imagine a torsion load if you picture a stuck drill bit or a drive shaft on a car. The bigger load is bending, which is the loading best imagined by the picturing the centre section of the beam in a see-saw. Bending loads try to change the shape of straight beams into bananas, etc.

Since the wind turbine nacelle is going to rotate to orient it into the wind, the torsion loads can be managed. It would be significantly worse if the nacelle was incorrectly aligned, with the blades aligned so that the rotating axis of the fan was at 90 degrees to the wind direction. This would result in large torsion loads but is still quite simple to disperse to the foundations.

The issue I see, with a three bladed fan, is that on every rotation two blades will be on one side and then as the top blade swings over, there are then two blades on the the other, etc This will set up a cyclic torsion load, an even number of blades would have eliminated this load. Strange they did this, cyclic loads lead to fatigue.

I’d be more concerned about BENDING loads, eg the ones caused by a horizontal force applied at the top of a post. These forces get larger as the length of the post increases, or as the load increases. Both obviously increasing as the demand for larger fan diameters and taller towers materialise from the dreams of the renewable fraternity.

And of course, no matter what wind speed you design for, sooner or later that speed will be exceeded, it’s just a matter of time. If we are forced to build them, then who gets to pick up the pieces. With heavy falling objects, NIMBY has real meaning, especially if you are in the drop zone.

In the following comment Rud Istvan addressed the effect of increasing wind speeds with height.  One meteorological phenomenon that I have not heard much about is a nocturnal low-level jet.  Wind speed varies with height due to surface friction.  At times nocturnal radiational cooling decouples the mixed layer from upper layers creating a layer of notably higher wind speeds above a relatively calm layer.  The description below of turbine wobble has to be exacerbated during these conditions.

Rud Istvan:

The primary failure mode of big onshore wind turbines is axial bearing failure. The problem is inherent, since wind speed is higher aloft so the bearings wobble as each of the three blades reaches peak height.

Any wave induced sway on a floating offshore turbine makes the wobble problem worse and axial bearing failure earlier and less predictable. Beefier bearings have not solved this problem onshore; they for sure wouldn’t offshore.

Not a wild guess, just very good intuition.

The final comment did not directly address floating wind but was too good to not include.  One of the hidden challenges of the net-zero transition is staffing.

Hot Scot:

The one ‘Reality’ that almost everyone misses entirely is the workforce required to achieve everything necessary to reach all this wondrous ‘decarbonisation’.

A report recently written by Michael Kelly, the inaugural Prince Philip Professor of Technology at the University of Cambridge, Fellow of the Royal Society and of the Royal Academy of Engineering exposed this a few years ago, and nothing has changed since.

In the UK, at least, we have one third of the skilled workforce to conduct all the changes required by trained engineers, builders, technicians etc. and our education and training system is not geared up to provide more, and won’t be for many years even assuming changes are made now.

A traditional solution to this would be to attract immigrant workers from the continent. The problem here though is, Europe is also short of their own labour to achieve their decarbonisation goals.

The UK’s usual fallback solution (and it’s been done many times before) is to announce to the public, with great fanfare, a job creation scheme where they will launch vocational training at local tech. colleges. Lots of votes in that particular scam.

The routine is, a whole bunch of youngsters are recruited to train up as technicians at local colleges. They recognise an opportunity so rush out and recruit a few untrained mates, start a business to do the rudimentary work like home insulation and perhaps even installing Heat Pumps.

We have seen it all before with the 1970’s double glazing scam, the 1990’s cavity wall insulation scam and the 2010’s domestic Solar Arrays (as they were grandly called) and it all ends with the same result. Thousands of householders spending lots of money to wind up with lots of problems and innumerable Cowboy business suddenly going bust because, well, that’s what Cowboy businesses do. Guarantees are worthless, even if underwritten by the government because the installation was substandard and of course, the government won’t cover that. Caveat emptor.

It takes years for this to manifest itself as an abject failure and the MSM will be recruited by the government to tidy up the loose ends with recognition of the phenomenon, a few cases won in court, and then nothing. It’s all forgotten about.

We already have a shortage of STEM qualified individuals who will be required to deal with the enormous demands of the commercial wind and solar industry. Of course, universities will suddenly take a great deal of interest in STEM subjects instead of Phd’s in Macramé or flower arranging.

Evidence of all this?

My middle aged son landed a job to monitor small scale wind turbines remotely from home. A laptop in his living room. He was a failed musician, dropped out of his college course as an electrician, but excelled as a short order cook in a sandwich bar. He now believes he knows everything there is to know about wind turbines and is, naturally, an passionate advocate for the cause of climate change.

I hasten to add I had no influence on his formative years whatsoever.

These are the rocks the climate scam will perish on, not the theory or counter theory of whether or not CO2 causes warming, it will be the practicalities of implementing the solutions to it.

Conclusion

I published this article because it provides great background information on floating offshore wind turbines.  Fortunately, no one has proposed any for New York yet but there probably is some location serving New York where someone will claim this technology is needed.

I concur with Driessen’s conclusion: “It’s time to say, “Enough! We’re going to keep our nuclear and fossil fuel energy, until you prove beyond a reasonable doubt that your alternatives provide equally abundant, reliable, affordable energy.”

Which Power Source is Best

A slightly different version of this article was published at Watts Up With That.

Bud’s Offshore Energy blog highlighted a new national energy report card that is of interest to readers here.  According to the Mackinac Center press release the report ranks energy sources by ranking eight key energy resource types “based on their ability to meet growing demand for affordable, reliable, and clean energy generation”.  The report concludes that “natural gas and nuclear power lead the rest of the class in generating clean and affordable energy”.

Unfortunately, the impractical Climate Leadership & Community Protection Act (Climate Act) mandates a transition to an electric system with zero greenhouse gas emissions heavily reliant on wind and solar.  The report card gives wind and solar failing grades so this report is relevant.  I have followed the Climate Act  since it was first proposed, submitted comments on the Climate Act implementation plan, and have written over 400 articles about New York’s net-zero transition. The opinions expressed in this post do not reflect the position of any of my previous employers or any other organization I have been associated with, these comments are mine alone.

Jason Hayes and Timothy G. Nash co-authored this report from Northwood University’s McNair Center for the Advancement of Free Enterprise and Entrepreneurship and the Mackinac Center for Public Policy.  The Mackinac Center for Public Policy is a nonprofit research and educational institute that advances the principles of free markets and limited government.

Methodology

The report summarizes the scoring methodology:

Bottom Line Up Front: Each ranking area graded the energy resource on a scale of 1 to 10. If an energy source performed poorly, it received a 1, if it performed well, it received a 10.

The scores in each section were totaled and broken down from 1 to 50. The energy source was given a final letter grade of A to F based on its score out of 50. The grading system results in a comparative ranking that describes the energy resource as excellent (90-100 /A-range), very good (80-89/B-range), average (70-79/C-range), poor (60-69/D-range), and Failure (59 or below/F).  This methodology is roughly based on the American Society of Civil Engineers’ methodology described in the annual “A Comprehensive Assessment of American’s Infrastructure: 2021 Report Card for America’s Infrastructure” document.

The score card evaluated each energy source for five ranking areas:

  1. Capacity and Reliability: We estimated the capability of this energy source to produce sufficient energy to meet demand. We also considered how plans to maintain existing (or build new) infrastructure and capacity will meet growing energy demand.
  2. Environmental/Human Impact: We asked what are the environmental impacts, the human rights, or other labor issues associated with using this energy source.
  3. Cost: We asked how the energy source competes with other energy sources in terms of pricing.
  4. Technology and Innovation: We asked what technologies are used and what new technologies are being developed for this energy source.
  5. Market feasibility: We considered whether the energy source relies on free-market forces to supply energy to the public. To what extent do subsidies and/or government mandates drive its adoption and use?

The report includes recommendations for policies that could be implemented to improve this sector’s performance.

Energy Sector Rankings

The report card, ranked by the final grades, puts natural gas and nuclear at the top of the class.

The Executive Summary of the report includes a summary for each energy sector that describes the ranking rationale.

Natural gas tops the energy sectors because it not only provides electric energy but also provides the ancillary support services necessary for the transmission system at a relatively low cost.  Aside from the irrational obsession with over hyped greenhouse gas effects it also has a low, albeit not zero pollution impacts.    I agree with the concern that reliability would be improved with on-site storage.

Natural gas: 94 % (A)

Natural gas is at a unique position in our energy supply.

The nation has experienced rapid growth in energy demand for a range of activities: electricity generation, home heating, transportation, manufacturing, etc.

As governments around the nation attempt to impose a transition from traditional energy resources to energy sources often referred to as renewables, natural gas is the energy source that is best suited to integrate with the intermittency inherent in the use of wind and solar. Gas provides a reliable, affordable, and increasingly clean source of energy in both traditional and “carbon-constrained” applications.

Gas faces headwinds in the form of increasingly extreme net zero energy policies that will constrict supplies if implemented as proposed. Gas could also improve overall reliability if onsite storage was prioritized to help avoid supply disruptions that can occur in just-in-time pipeline deliveries during periods of extreme weather and demand.

The second highest energy sector was nuclear.  The report card recognizes its zero emissions, that it provides electric energy and ancillary support services necessary for the transmission system, and that it is mature technology with the potential for extensive deployment.  Were it not for high development costs and market feasibility issues it would undoubtedly be the highest rated.

Nuclear: 88% (B+)

Nuclear energy represents a best-of-all-worlds energy resource for the United States. Given its history as the nation’s safest and most reliable electricity source and its ability to produce near endless amounts of completely reliable and emission-free electricity, nuclear is an obvious choice, especially given the nation’s current hyper-focus on net zero carbon dioxide emissions.

Nuclear’s primary challenges lie in two areas: initial costs and concerns over safety related to fuel storage or the potential release of radioactive materials.

First, while initial costs to build can be high, they can be amortized over a 60- to 100-year expected life cycle. Additionally, costs can be addressed by reigning in the overactive nature of the Nuclear Regulatory Commission. Second, the industry’s record demonstrates it is the nation’s safest source of electricity.

Perhaps no better example of this technology’s safety, reliability, and usefulness exists than the nation’s fleet of nuclear-powered aircraft carriers, submarines, and cruisers. Building on Admiral Rickover’s innovations, the U.S. Navy has reliably and safely powered a significant portion of its fleet with nuclear power for decades. As we have done in many other areas, it is possible to use the knowledge gained in this area in the civilian nuclear fleet.

Given the safety and reliability of both our military and civilian nuclear, concerns over meltdowns or having the fuel used to build nuclear weapons are more in the realm of science fiction than reality. The United States was once the world leader in developing safe, reliable nuclear technologies. We should focus on rebuilding that status.

Coal and hydroelectric are ranked next with the same with a total of 40 points.  I think that ranking by electric system characteristics and not weighing environmental impacts is the reason.

Coal is a mature technology that provides electric energy and ancillary support services necessary for the transmission system and has the potential for extensive deployment.  I would have ranked the capacity reliability a point higher because coal can be stored on-site and that I think is an important characteristic too often overlooked. 

Coal: 80% (B-)

Despite its low cost, abundant domestic supply, and reliability, Western nations—USA, Canada, UK, and across Europe—have targeted coal for closure largely due to climate change concerns. While most pollution concerns associated with coal use can be addressed with widely available emissions reduction technologies, coal does emit more pollutants and CO2 than natural gas.

Due to growing regulatory pressure and effective competition from low-priced, domestic natural gas, coal use is declining in North America, as well as Europe. However, coal use worldwide— especially China and India—continues to grow rapidly. Across Asia, coal use is growing so rapidly that attempts to cease its use in the West as a climate change mitigation measure are being wholly eclipsed.

The primary challenges faced by the coal industry are 1) a long-term campaign on the part of government and green special interests to stop its use, and 2) very effective competition from low-cost fracked natural gas, which is displacing coal as a primary baseload generation option.

The grading for conventional hydroelectric recognized this is another mature technology that provides electric energy and ancillary support services necessary for the transmission system.  Unfortunately, there is little potential for further deployment and the current plans to destroy hydro dams are inconsistent with the supposed need to fight the “existential threat” of climate change.  In my opinion that is almost as stupid as shutting down nuclear plants prematurely.

Conventional hydroelectric: 80% (B-)

Hydroelectric is the one form of renewable generation that is completely dispatchable and has no emissions associated with its operations (compared with biomass).

While hydroelectric would seem to meet most of the tests of the environmental movement, it is often targeted for removal because it requires a great deal of bulk material in its construction and interrupts or changes natural river flows and floods riparian zones (displacing wildlife and human inhabitants). Given the expansive nature of large hydroelectric facilities, it is unlikely that any new developments could be permitted in North America.

In my opinion petroleum fuels were a bit under-rated.  This is another mature technology that provides electric energy and ancillary support services necessary for the transmission system.  Admittedly it is important in limited areas but provides critical support in those markets.  However, I agree the potential for any further development is very low.

Petroleum fuels: 70% (C-)

Petroleum products play a very small role in the production of U.S. electricity. They are almost a rounding error and are used primarily in older or geographically limited areas (like t

the Hawaiian Islands or Northeastern markets because of historical use).

I probably would have rated geothermal closer to petroleum fuels.  As noted, it suffers from the same lack of potential development.

Geothermal: 66% (D+)

Geothermal plays a limited role in the production of U.S. electricity. Much like petroleum products, geothermal is almost a rounding error and is used primarily in geographically limited areas (like the Western states and the Hawaiian Islands)

Wind and solar receive failing grades.  Both are rated lowest for similar reasons.  When they are compared to the capability of the other energy sources to provide sufficient energy to meet demand the need for energy storage and supporting ancillary services, they are appropriately ranked lowest.   Even though they are zero-emissions resources there are “numerous other grid reliability, environmental, economic (or cost), and social issues associated with its use that are often overlooked”.    The Climate Act explicitly mandates that every conceivable impact associated with fossil fuels are considered but does not require consideration of these issues.  When human rights impacts are included, they should be rated lower than the other sources.  Wind and solar are only relatively cheaper if the costs to provide reliable energy and transmission system ancillary services are ignored.  I think this ranking correctly scores this category.  The technology/innovation category recognized that there are limited opportunities to improve the energy output.  The market feasibility scoring considered “whether the energy source relies on free-market forces to supply energy to the public.”   I do not believe that wind and solar could survive without massive subsidies so believe this scoring is appropriate.

Wind: 56% (F)

Wind is one of two so-called renewable energy generation sources widely promoted for its claimed ability to reduce the environmental impacts of electricity generation. Wind is marketed as being able to reduce carbon dioxide emissions, protect the environment, reduce electric rates, and improve grid reliability.

While it is true that wind does not produce carbon dioxide as it produces electricity, there are numerous other grid reliability, environmental, economic (or cost), and social issues associated with its use that are often overlooked.

Given that society increasingly relies on a steady and reliable supply of affordable energy, government policies that mandate and heavily subsidize a transition to wind generation represent a growing threat to human health and well-being.

Solar: 58% (F)

Solar is the second of two so-called renewable energy generation sources (wind is the first) widely promoted for its claimed ability to reduce the environmental impacts of electricity generation. Like wind, solar is marketed as being able to reduce carbon dioxide emissions, protect the environment, reduce electric rates, and improve grid reliability.

Like wind, solar does not produce carbon dioxide as it produces electricity. However, there are numerous other grid reliability, environmental, economic, social, and human rights issues associated with its use that are often overlooked.

Given that society increasingly relies on a steady and reliable supply of affordable energy, government policies that mandate and heavily subsidize a transition to solar generation also represent a growing threat to human health and well-being.

This summary of the report is only an overview.  The report is comprehensive with 107 pages of text.  There is extensive documentation with 297 references.  As a result, the rationale for the scoring is extensive.

Conclusion

The conclusion of the report states:

Demands for a hurried transition from conventional, reliable energy sources to unreliable and expensive renewable alternatives are threatening the reliability of the North American electric grid. Pushing for increased efficiency and improved environmental performance is a laudable (and achievable) goal. However, we cannot allow misplaced environmental zeal to obscure electricity’s pivotal role in promoting human health and well-being and powering our society.

Advocates for wind and solar hold them up as essential to environmental and climate health. However, rushing a systemwide transition to these untested and unreliable energy options puts human lives and the North American economy at risk. Their inherent intermittency will strain the ability of the grid to meet growing energy demands and the ability of ratepayers to cover the high costs they impose on the grid. In contrast, the reliability and affordability of fossil and nuclear fuels cannot be ignored. Admonitions from grid managers warning about the dangers of rushing to close reliable sources of electricity generation only serve to highlight the risks associated with the premature rush to transition to wind and solar.

This research demonstrates the high environmental and economic costs of hurrying the grid transition. While fossil and nuclear fuels do have environmental costs, we also have the technological capacity to address those costs as we continue to trust their unparalleled reliability for essential energy services.

Wind and solar energy have been marketed as a means of having our energy and environmental cake and eating it, too. We are told they are clean, cheap, and reliable. However, a closer look at their real costs, growing environmental impacts, and questionable human rights records leads to serious questions about their ability to serve as a realistic energy option.

Transitioning a service as important as the nation’s electric grid cannot be rushed. It requires a far more careful and pragmatic approach than we see from elected officials and utilities nationwide. The rushed transition is neither reasonable nor prudent and must be reconsidered.

I agree with these conclusions.  The point about wind and solar that “rushing a systemwide transition to these untested and unreliable energy options puts human lives and the North American economy at risk” is particularly relevant.  New York’s electric system has unique features that are incompatible with the intermittent sources of power except at extraordinary costs for backup resources for worst case conditions.

NYSERDA Solar Quiz Misinformation

I recently covered an article by Ken Girardin who broke the story of New York’s latest attempt to shore up public support for the Climate Leadership & Community Protection Act (Climate Act).  In brief, the New York State Energy Research and Development Agency (NYSERDA) are hiring a public relations outfit, using $500,000 per year of public money, to “maintain a positive narrative” and “respond to negative viewpoints” about the state’s Climate Act. This article shows the likely result of that effort – NYSERDA’s Think You Know Solar – Take the Solar Quiz.

I have followed the Climate Act  since it was first proposed, submitted comments on the Climate Act implementation plan, and have written over 400 articles about New York’s net-zero transition. I have devoted a page to solar issues that describes my concerns with solar development in New York. The opinions expressed in this post do not reflect the position of any of my previous employers or any other organization I have been associated with, these comments are mine alone.

The Climate Act established a New York “Net Zero” target (85% reduction in GHG emissions and 15% offset of emissions) by 2050.  Despite the enormous impacts to energy affordability, threats to electric system reliability, and mandates affecting personal energy choices I believe many New Yorkers are unaware of the law. In 2023 transition recommendations were supposed to be implemented through regulation, Public Service Commission orders, and legislation.  Not surprisingly, the aspirational schedule of the Climate Act has proven to be more difficult to implement than planned. 

Solar Quiz

On March 21, 2024 I received an email announcing the Solar Quiz.  This link is the web view version. In the rest of this section, I respond to its contents.

The quiz opens with the obligatory picture of roof-mounted solar panels.

The cheerful opening introductory paragraph leads off with the narrative: “free and abundant light” gives us electricity” from this “incredible clean energy technology”.

You may already know that solar panels convert the sun’s free and abundant light into electricity. Pretty great, right?

So, we thought we’d give you a quick quiz to test your solar smarts. Let’s see how much you really know about this incredible clean energy technology.

Sunlight may be a “free” energy source but there are costs to collect and use that energy.  That detail must be in the next quiz which will come out when the geothermal energy source from Hell freezes over.

The entire Climate Act legislation and narrative is characterized by black and white cartoon descriptions.  Consider the first quiz question:

Q: Do solar panels work on cloudy days?

A: Yes!

Because the panels collect light, they still function on cloudy days even though efficiency is somewhat reduced.

“Somewhat reduced”?  A negligible amount or a lot?  Let’s take a look at the potential range.

Their illustration:

My illustrations of today’s views from the NYS Mesonet Buffalo meteorological station.  This site is notable because it is surrounded by solar panels.  I am not sure how much that affects whether the meteorological data collected are representative but it does let us address the question of solar variability on this worst case condition – cloudy and snow covered.

Buffalo March 23, 2024 14:15:28 UTC or 10:15:28 EDT

Buffalo March 23, 2024 17:20:27 UTC or 13:20:27 EDT

Here is a graph of the temperature (red, orange), dew point temperature (green), and solar insolation (yellow) over the last seven days ending 23 March 2024 at 16Z or Noon EDT.  Regrettably the parameter of interest is in yellow.

Note that solar insolation is 170 watts per meter squared (W/m2) at 10:15 EDT in the first picture and 420 W/m2 at 13:20 EDT the time of the second picture.  Reasons for the difference include the tine of day because the second picture is closer to solar noon and the clouds are darker which could mean they are thicker in the first picture.  It would be interesting to see the effect of the snow on the panels if data from that solar facility could be obtained.

To guess the effect of clouds I looked at the last seven days of data from the same site.  I have put arrows on the peak solar insolation for the last six days.  Presumably there were three days without clouds because the solar insolation exceeded 800 W/m2.  There were two days when the peak insolation was around 500 W/m2, one day when the peak was no more than 350 W/m2, and on the most recent day it appears that the data from the daily graph peaks a little over 400 W/m2.  I guess the point is that even on a cloudy day solar power is “Somewhat reduced” to half and does not go to zero.  I am sure that some power would be generated even when the panels are covered by snow but the reduction sure is more than “somewhat” reduced, closer to nearly zero is my guess.

Of course, solar is zero at night.  Not to worry the solar quiz addresses this.

Q: If I have solar panels, will my house still have energy at night?

A: Yes.

Solar-powered homes collect excess energy and pass it to the grid for future use, and if you don’t have excess energy stored you pull energy from the grid at any time, like when it’s dark. Another option for night-time energy use is on-site battery storage, which collects excess energy and saves it for when it’s needed.

This is egregious misinformation.  The electric system instantaneously balances load and generation.  Any excess energy passed to the grid has to be used at that time or stored.  In my opinion the worst subsidy for residential solar is the unacknowledged cost to provide grid energy when the sun does not shine.  Somebody else is paying for the infrastructure (storage or alternative sources) necessary so that solar-equipped residences can “pull energy from the grid at any time”.  Inevitably the “net-metering” rules will have to be changed so this subsidy is reduced or eliminated.  The mention of on-site battery storage is a start, but the reality is that the largest reliability cost is associated with extreme conditions and providing enough solar panels and energy storage to start to address that problem is uneconomic for an individual.  If this was not the case, then folks would be going off the grid entirely.

The next question has no interest to me:

Q: When was the first solar panel installed?

A: In 1883, by American inventor Charles Fritts in Manhattan.

Solar energy (the photovoltaic effect) was discovered in 1839 by Edmond Becquerel, a French physicist who studied light.

The next question is relevant.  Consistent with the rest of the quiz the answer provides no nuances or specific information.

Q: How long do solar panels last?

A: About 25 years

The efficiency of solar panels decreases over time. However, a lot of factors contribute to lifespan, such as weather, installation, maintenance, and quality.

The narrative answer is that “most residential solar panels should operate for 25 years before degradation (or reduced energy production) is noticeable.”   The National Renewable Energy Laboratory notes that “the rate of degradation is typically around 0.5% to 0.8 % per year but varies among different types and brands of solar panels.”  If I define “noticeable” degradation as a 10% loss of efficiency, then at 0.5% per year the degradation is noticeable at 23 years and at 0.8% per year the degradation is noticeable at 15 years. 

The next quiz question addresses solar panel land use.

Q: What is it called when land is used for both solar panels and agriculture?

A: Agrivoltaics

In some places, farmers are experimenting with grazing livestock (solar grazing), growing native grasses, and even fruits and vegetables around solar panel installations.

Sounds great.  Note that they did not talk about agrivoltaics in New York.  There is a reason. The State has set up the New York State Agricultural Technical Working Group to address this in New York but there has been no progress mandating this approach.  As I will explain in the following discussion, I am unimpressed with that effort.

The last question in the quiz manages to get in a bit of bragging.

Q: Which U.S. state is the top community solar market in the country?

A: New York!

As of December 2023, more than two gigawatts of community solar have been installed in New York – enough to power nearly 400,000 homes.

Of course the point that they can power 400,000 homes only when the sun is shining is unmentioned.

New York’s Disgraceful Solar Implementation Record

So much for the quiz.  How is New York’s solar implementation policy going?  

I believe that the development of solar resources is considered above all other concerns which will not end well.  I submitted comments on the Draft Scoping Plan two years ago calling for a moratorium of utility-scale solar development because the New York State Department of Agriculture and Markets (Ag & Market) policies on solar energy projects that protect prime farmland were being ignored and programs designed to protect prime farmland and reduce impacts were being developed but not implemented.  Two years later the policies are still being developed and I estimate that 20 projects have  permits to construct and only seven meet the Ag & Markets policy.

In their comments for solar project applications the Department of Ag and Markets prepared testimony has noted that “The Department’s goal is for projects to limit the conversion of agricultural areas within the Project Areas, to no more than 10% of soils classified by the Department’s NYS Agricultural Land Classification mineral soil groups 1-4, generally Prime Farmland soils, which represent the State’s most productive farmland.”  The lack of a responsible solar implementation policy has meant that of the 20 projects with applications only seven meet this criterion as shown in my Solar Project Scorecard.  These results show that it is possible to protect prime farmland, but that New York State has failed to mandate that all projects meet the reqirement.  As far as I can tell, there are no provisions in any of the permitting requirements that mandate farmland protections consistent with Department of Ag & Markets recommendations.

If there are no specific requirements for protecting farmland then what about other mitigation strategies.  One responsible solar siting mitigation strategy would be to combine agriculture and solar land use – agrivoltaics.  Last October, the report Growing Agrivoltaics in New York was released.

The report outlines the results of a limited literature review to advance understanding of opportunities for agrivoltaics by reviewing New York State’s current agricultural landscape; the current situation of agrivoltaics pilots and programs; and solar design considerations related to integration of agricultural activities and solar power generation. In aggregation with additional State efforts to understand land-use implications of large-scale solar (LSS) development, results inform potential future actions to provide education on best practices for implementation of agrivoltaics projects in New York State.

The report provides good background information.  It includes a good description of the permitting process. It mentions the New York State Farmland Protection Working Group which was formed in 2021 “to consider and recommend strategies to the State on the siting process of major renewable energy facilities and to minimize the impact of siting on productive agricultural soils on working farms”.  It also notes that additional agrivoltaic research has been proposed.  They managed to come up with a definition:

A simultaneous use of land for solar photovoltaic power generation and agricultural production of “crops, livestock, and livestock products” as that phrase is defined by Agriculture & Markets Law (AML) §301(2).

I am unimpressed because the report is long on research recommendations and short of any sign of urgency to implement anything. 

The fact is that the drive to install as much as possible as quickly as possible is affecting agricultural lands across the state and local communities.  One of the readers of my blog, Lenny Prezorski from the Cold Spring Farm  in Schoharie County recently wrote me a note.  The following is a lightly edited version.

Schoharie County like much of rural NY, is losing prime farmland to solar development.    One project is under construction and another is seeking approval from ORES.

Last week our state and local officials held a news conference at the Salisbury dairy farm which adjoins the NextEra East Point solar project in the Town of Sharon.  A number of impacts were discussed.   This news article details those concerns.  For example, the highway superintendent has been fighting with solar contractors since the project started.  His efforts to correct the damage to town roads have fallen on deaf ears in Albany.  Despite the claims from the developer, they continue to do as they may with no oversight.

On the same day as the news conference our local newspaper ran an article noting that the property for the project was up for sale.  The article notes that the parcel has “1,100 acres on a working, income-producing farm, with a log cabin home, and “seeping vista views” stunning views of both the Mohawk Valley and Catskill Mountains.”  However, There’s just one catch:

Three hundred thirty five of those acres, across eight parcels, are covered in solar panels as part of NextEra Energy’s 50-MW project mostly off Route 20 and Gilbert’s Corners Road, but also Pomella, Beech and Sakon Roads.

Coldwell Banker is listing the site at 485 Gilberts Corner Road for $15,350,000; the listing went up February 20.

The site, according to the description “is one of the largest working solar farms in all of New York State, secured by a 25-year lease with guaranteed lease payments totaling in excess of $20 million.

“This property portfolio consists of over 1,000 acres of farmland and solar arrays on eight separate tax parcels—including a working farm with barns and residences.

“The largest portion on this income-producing portfolio is from the 25-year lease on the solar panels, covering 355 acres.

Prezorski  continues:

How deep are the pockets that these projects can be sold, I assume at a profit, before they are complete?  I understand that Rock District Solar in the Town of Carlisle has been sold 2 or 3 times and it hasn’t even received approval.

It is too late for the Town of Sharon but it hopefully isn’t too late for the proposal in Carlisle.

Prezorski describes problems with the accelerated permitting process.

Rock District attempted to get local approval from the Carlisle Planning Board.  During the public comment period I submitted a detailed report which exposed errors and omissions in the Environmental Assessment Form.    Once appraised of these facts they immediately withdrew their application from the town and submitted it to Office of Renewable Energy Siting.  I’ve prepared a report which primarily focuses on the loss the prime farmland and potential impact to groundwater resources in our karst landscape.

The EAF located the project in the wrong watershed.  It neglected to document that runoff from the site flows directly into a sinkhole which feeds the longest cave system in NYS.  The application submitted to ORES contains the same erroneous data.  How do we ensure that NYS follows their own laws?    This is the question I posed to our local leaders and to you too.

Unfortunately, I do not have any answer for the question how do we get the state to follow our own laws.

Concluding Remarks

The Think You Know Solar – Take the Solar Quiz is an example of mis-misplaced priorities of the Hochul Administration.  The cute little public relations quiz demonstrably misinforms the public.  Sunlight may be a “free” energy source but the costs to collect and use that energy are ignored.  While it is encouraging that solar panels can generate electricity even on cloudy days the implications of reduced output are not addressed.  Claiming that solar panels last for 25 years ignores that they are also expected to generate 10% less power in a shorter period.  Finally, the answer to the question “will my house still have energy at night?” displays a lack of understanding of how the electric system works and downplays the enormous challenge and costs to provide that energy that are not covered by residential solar owners.

Meanwhile, back in reality the article describing the local stakeholder concerns with the state’s control over solar farm projects describes what is happening away from Albany.  As noted previously, the developers are affecting roads and not fixing damage.  The state is over-riding local code enforcement and safety issues are evident.  In order to expedite renewable development, the State has implemented new permitting requirements that over-ride landowner rights and local government control. 

I believe that this situation has led to a disgraceful solar siting process.  Despite assurances prime farmland is not being protected.  Proponents of “responsible solar siting” that includes things like agrivoltaics are long on talk and promises of more research but short on urgency to do anything to implement something.  Prezorski explained that the expedited permitting process is enabling errors that could have significant consequences.  Finally, the state has no requirements that the solar developments are constructed to meet the Scoping Plan performance expectations.  As a result, even more solar development will be required to meet the generation and capacity requirements.

No amount of public relations investment to spin stories to be consistent with the Hochul Administration narrative are going to be able to hide the reality of the disgraceful utility-scale solar siting policies. Those policies are going to cause much more harm than acknowledged by the State.

New York Climate Plan Needs Publicly Funded Spin Doctor

This post was originally posted at Watts Up With That. Special thanks to Charles Rotter for using AI to create this fantastic cover picture used at WUWT.

This is another article about New York’s climate “leadership” that I fear will trickle down to a state near you.  Ken Girardin from the Empire Center breaks the story of New York’s latest attempt to shore up public support for the Climate Leadership & Community Protection Act (Climate Act).  This article explains that the State “is especially concerned about certain areas of the climate program, noting they should be able to “immediately address emerging unforeseen events that draw media scrutiny”.

I have followed the Climate Act  since it was first proposed, submitted comments on the Climate Act implementation plan, and have written over 400 articles about New York’s net-zero transition. The opinions expressed in this post do not reflect the position of any of my previous employers or any other organization I have been associated with, these comments are mine alone.

The Climate Act established a New York “Net Zero” target (85% reduction in GHG emissions and 15% offset of emissions) by 2050.  Despite the enormous impacts to energy affordability, threats to electric system reliability, and mandates affecting personal energy choices I believe many New Yorkers are unaware of the law. In 2023 transition recommendations were supposed to be implemented through regulation, Public Service Commission orders, and legislation.  Not surprisingly, the aspirational schedule of the Climate Act has proven to be more difficult to implement than planned. 

NYS Seeks Spin Doctor To Fight Climate Law Critics

Girardin discovered that the New York State Energy Research and Development Agency (NYSERDA) are hiring a public relations outfit, using $500,000 per year of public money, to “maintain a positive narrative” and “respond to negative viewpoints” about the state’s Climate Act. 

NYSERDA has been charged with supporting the technical analyses that are supporting the development and deployment of the Scoping Plan that outlines how to “achieve the State’s bold clean energy and climate agenda.”  In brief, that plan is to electrify everything possible using zero-emissions electricity. Many aspects of the transition are falling behind, and the magnitude of the required actions is coming into focus. As a result, enough questions are being asked that the State has decided it needs to respond.

Girardin notes that the  just-released request for proposal from the New York State Energy Research and Development Agency (NYSERDA) seeks: 

public relations professionals or public relations firms interested in providing public relations/communications services to advance the goals of NYSERDA and the Climate Leadership Community and Protection Act (Climate Act) by building awareness of and support for the Climate Act and assisting in developing a narrative around New York State’s clean energy and climate priorities and providing rapid response communications services, if necessary.

He describes the genesis of the problem and current situation:

The law was passed without anything close to a cost estimate or feasibility study, and five years into its implementation, the Climate Act has created headaches for state officials. Among other things, the state Department of Environmental Conservation has blown off a statutory deadline to implement related regulations that would, among other things, ban replacement gas appliances and fossil-fuel furnaces and impose an economywide tax-like charge on businesses responsible for greenhouse gas emissions.

None of the reports or analyses have provided a transparent full disclosure of the assumptions, expected emission reductions, and costs for the implementation of control strategies.  What is clear however is that NYSERDA has glommed on to the Climate Act funding as much as possible.  NYSERDA’s payroll has doubled in the past decade.  It already gets funding from a range of grants, taxes and energy-related charges, and Girardin notes that it’s not clear which would be used to fund this contract. 

NYSERDA already has a sizable communications and marketing operation so this push to bring in outside help is remarkable. Girardin suggests that this proposal is tasked to what the State policy makers must think is a real problem:

The RFP doesn’t just want someone to promote the Climate Act. It specifically seeks someone who can “rapidly respond to negative viewpoints and perceptions about the State’s climate and clean energy goals under the Climate Act, the costs associated with the Climate Act, and challenges to particular policies and programs.” 

Clearly, you can only hide the impacts to the state of a complete transformation of the energy system in the state for so long.  Girardin points out that NYSERDA posted the RFP two weeks after a report from the Empire Center showed “how state officials had violated the law, misrepresented Climate Act costs and made fanciful assumptions about how the electric grid would function in 2030.“  I am not the only one who has been making similar arguments for many months so it is not surprising that these issues are getting traction despite the efforts of NYSERDA to date.

I thought Girardin laid out a strategy to raise issues when he described the primary concerns of the request for proposal (RFP).  If these are their issues of concern then pragmatists like me should be strengthening our arguments about these topics.

The RFP suggests NYSERDA is especially concerned about certain areas of the climate program, noting they should be able to “immediately address emerging unforeseen events that draw media scrutiny” in areas including: 

  • “Questions and concerns on affordability for New Yorkers and direct costs to ratepayers as a result of the State’s clean energy and climate transition” including the cost of the planned “cap-and-invest” system. 
  • “Concerns related to the cost and practicality of supporting building decarbonization, the implementation of codes for same and a phase out of fossil fuels in new construction;” 
  • “Concerns related to transitioning cars, trucks, and SUVs sold in New York to zero emissions, and requiring all school buses in operation in the state to be zero-emission by 2035;” (This last policy, required by a separate state law, has given school districts sticker-shock, both with the cost premium of electric models and the unexpected cost of electricity infrastructure upgrades). 
  • “Challenges with the lithium-ion batteries and the scale up of stationary battery storage systems, as well as related fires, safety issues, and the work of the associated working groups.” 
  • “[A]ddressing the headwinds” related to the state’s large-scale renewable energy projects (and presumably NYSERDA’s decision to let offshore wind developers extort an extra $8 billion or so out of state electricity customers last month). 

Girardin lays out an argument why this RFP is troubling at a higher level that I think is irrefutable.

Encouraging people to use less energy or to participate in state programs can serve the public interest by lowering costs for everyone or improving grid reliability. And educating them about a law’s existence to increase compliance is one thing, but spending public funds to “build support” and challenge accurate criticism sounds more like political speech that taxpayers should not be compelled to fund. If not unconstitutional, it certainly is illiberal. 

What would the response have been if Governor George Pataki had used funds seized from low-level drug offenders to hire flacks to “maintain a positive narrative” that the Rockefeller drug laws were good and shouldn’t be changed? Or if an upstate county had used sales tax revenue to buy billboards to reduce support for the Climate Act, perhaps by telling residents how Climate Act programs to benefit New York City will soon be funded with hidden charges on their electricity bills? 

It’s easy to imagine the—justifiably—breathless tantrums that would have ensued if a different administration had used NYSERDA funds to pressure lawmakers to repeal the state’s ban on natural gas fracking or obstacles to new nuclear power plants.

One of my biggest problems with the state’s implementation plan is the failure to acknowledge the misleading cost-benefit descriptions.  Girardin shares my concern:

NYSERDA deserves extra skepticism because the state has gone to great lengths to keep people in the dark about the Climate Act. Legally required cost estimates for Climate Act programs were never released and the revised State Energy Plan, which would show where costs are headed, is several years overdue. NYSERDA spent a year in court fighting to block the release of a Cuomo-era study which appeared to raise doubts about the costs and feasibility of the state’s climate agenda.  

He concludes that reality will eventually win out:

Ultimately it matters little what people are told about the Climate Act, by NYSERDA or otherwise. New Yorkers will in short order face higher fuel costs, higher property taxes, higher compliance costs and higher electricity rates, interspersed with news about businesses either leaving or cancelling investments because of energy concerns. 

The Climate Act, on its own, will tell people exactly how it works. And that might be what NYSERDA fears most.

Conclusion

As a New Yorker this is yet another embarrassment.  The State’s narrative is that everyone is on board with this fantastic plan that will “encourage other jurisdictions to implement complementary greenhouse gas reduction strategies and provide an example of how such strategies can be implemented”.  It is not clear whether a plan that requires a spin doctor can serve as an example to others.

Despite the embarrassment it is encouraging that the State is scared enough that they have to go this route.  The folks who have ignored this law are starting to wake up as the implementation plans roll out.  Hopefully this is a sign that the inevitable pushback is starting.

The Difference Between Weather and Climate is Important

I recently published an article about the difference between weather and climate that was in response to a friend who consistently links weather events to climate change on his Facebook account.  The reason for this post is his response to my latest explanation that ended with him saying “I’m comfortable with being wrong.   It’s not a death match.”  This post explains why it matters.

I will explain the problem with the successful propaganda campaign to convince the general population that unusual weather events justify New York’s Climate Leadership & Community Protection Act (Climate Act).  I have followed the Climate Act since it was first proposed, submitted comments on the Climate Act implementation plan, and have written over 400 articles about New York’s net-zero transition. The opinions expressed in this post do not reflect the position of any of my previous employers or any other organization I have been associated with, these comments are mine alone.

Overview

The Climate Act established a New York “Net Zero” target (85% reduction in GHG emissions and 15% offset of emissions) by 2050.  It includes an interim 2030 reduction target of a 40% reduction by 2030 and a requirement that all electricity generated be “zero-emissions” by 2040. The Climate Action Council (CAC) is responsible for preparing the Scoping Plan that outlines how to “achieve the State’s bold clean energy and climate agenda.”  In brief, that plan is to electrify everything possible using zero-emissions electricity. The Integration Analysis prepared by the New York State Energy Research and Development Authority (NYSERDA) and its consultants quantifies the impact of the electrification strategies.  That material was used to develop the Draft Scoping Plan outline of strategies.  After a year-long review, the Scoping Plan was finalized at the end of 2022.  In 2023 the Scoping Plan recommendations were supposed to be implemented through regulation, PSC orders, and legislation.  Not surprisingly, the aspirational schedule of the Climate Act has proven to be more difficult to implement than planned and many aspects of the transition are falling behind. 

Examples of the Causal Link

In order to keep the public’s support for the Climate Act net-zero transition the Hochul Administration links recent extreme weather events to climate change.  The impetus of this article were two recent Facebook posts by my friend.  The first said that “So it wasn’t so long ago that there was a thing called “snow” and included a memory of a hike during the winter of 2014-2015 when there were “MASSIVE snow dumps in the Catskills”.  Yesterday the second post noted that he had heard spring peepers.  This small chorus frog is “one sure sign of spring” and my friend noted that hearing them on March 8 was “by far the EARLIEST EVER”.

Climate Change and California Atmospheric Rivers

In my articles responding to the presumption that these weather events are tied to climate change I have explained that according to the National Oceanic and Atmospheric Administration’s National Ocean Service “Weather reflects short-term conditions of the atmosphere while climate is the average daily weather for an extended period of time at a certain location.”  That article goes on to explain “Climate is what you expect, weather is what you get.”  Rather than trying to expand on my arguments I think this recent article by Chris Martz provides good insight. 

In his article Martz addresses those who will claim that the recent rounds of atmospheric rivers that have brought rainfall for days and recent heavy snowfalls to California are linked to climate change.  He describes the news cycle that had been harping for years on the “megadrought” that would put California in a permanent drought because of climate change.  The last two years of above average precipitation have destroyed that story.  Martz writes:

Faced with the reality that these “forever drought” predictions from nearly a decade ago were woefully wrong, academics and their media mouthpieces have had one of two options, either:

  1. Admit that the “permanent drought” prediction was wrong, or,
  2. Change their tune quietly to say that human-induced climate change is making California wetter by “fueling” the atmospheric rivers that provide the bulk of the state’s annual rainfall budget, and hope the rest of us don’t notice.

And, of course, the second option is the one academics and government scientists decided to go with (Figure 5).

 Martz goes on to describe atmospheric rivers and their potential for serious impacts.  Then he addresses the question whether “human-induced climate change plays a role, and to what extent if that is indeed the case.”  He notes:

I should prepend this discussion with the disclaimer that climate change itself does not cause any single weather event to occur. Climate is nothing but a statistical measure of various atmospheric state variables over a period of at least 30-years, preferably longer. The statistics may be organized into averages or “climate normals,” distributions and extremes. Each provides some sort of insight as to the weather one might expect at any given point in space or time. As the old saying goes, “climate is what you expect, weather is what you get.” Climate changes, both naturally and through man-made forcings, over a period of several decades. The equations of motion which physically explain how extreme weather phenomena occur do not change with the climatic base state.

I think he does a good job explaining what meteorologists should consider when trying to attribute weather events to climate change.

So, the question becomes, how does a changing climatic base state alter specific characteristics of atmospheric river events? In this case, there are two facets that atmospheric scientists care about:

  1. Has there been a detectable increase in extratropical cyclone activity [and the accompaniment intense winds] that atmospheric rivers are associated with in the observational record? How is this expected to change in the future?
  • How has extreme rainfall associated with atmospheric rivers changed as the climate has warmed? How is this expected to change in the future?

In a nutshell, depending on which of the two key issues above are examined, we reach contrasting conclusions, showcasing the sheer complexity of the coupled ocean-atmosphere system. To elaborate, if we make the assumption that the planet continues to warm, extratropical cyclone activity and their associated extreme winds should wane, but extreme rainfall, on the contrary, should be enhanced.

Like every other aspect of climate change policy this is much more complicated than it appears at first glance.  He does a great job breaking down all the factors at play.  For example, the warmer climate means more moisture “super-charging” extreme weather.  He says in response: “Simply put, just because more water vapor can occupy the air at higher temperatures does not mean that it will.”  I recommend reading his article in its entirety to understand how difficult it is to make a definitive link between climate change and weather events.

Why it Matters

After I sent the link to the article to my friend he responded:

I might quibble with “The equations of motion which physically explain how extreme weather phenomena occur do not change with the climatic base state.”    No, the equations don’t change, but the inputs do, right?   So, more heat = more [whatever], etc.     I appreciate the skepticism, but, clearly, there is something going on out there beyond the bounds of “normal”.   But then again, you can be skeptical and say that my human timeframe is far too short to make such judgments – perhaps.    But even beyond my mere mortal years, it seems that we’re seeing the furthest outliers of “weather” data that you might expect for a given season.  

The frustration to me is that he gets it when he says, “my human timeframe is far too short to make such judgments”.  Anecdotal evidence linking weather events and climate change is going to always be wrong because weather is what you get and climate is what you expect and our time frame is too short for climate comparisons.

However, that is not the problem.  The issue is his concluding remarks:

I’m comfortable with being wrong.   It’s not a death match.

My concern is that ultimately the conflation of every unusual weather event to climate change is linked to the preposterous idea that if New York converts its energy system to meet the Climate Act net-zero goals there will be an effect on the unusual weather events observed.  I am convinced that the present trajectory of the Climate Act mandates aspirational goals that are dangerous.  In February 2021, the Texas electric grid failed to provide sufficient energy when it was needed.  The storm was the worst energy infrastructure failure in Texas history and resulted in at least 246 people dying and total damages were at least $195 billion.  The Hochul Administration has not demonstrated that the Climate Act goals are feasible and will not endanger the reliability of the New York electric system.  The same thing that happened to Texas could happen in New York.

Discussion

There is another related weather and climate related issue.  I fear that the emphasis on ever more dangerous weather in the future due to climate change is diverting resources away from addressing observed weather problems.  There is a limit to the resources available to address weather-related issues despite the value in doing so.  Over building infrastructure in one place to account for potential issues related to climate change likely means that improving infrastructure elsewhere for observed weather events will not be funded.

As noted previously, the rationale to do something and the response to climate change is much more complicated than it first appears.  The recent article Minding the Sciences—Wicked Science and Understanding Climate Change: Uncertainty, Risk, and Pragmatics by Joe Nalven reviews Judith Curry’s book, Climate Uncertainty and Risk and its discussion of these policies.

Nalven writes:

I am often surprised how California state and local entities craft policies they believe would put us on the path to addressing the complex dynamics of what we label climate change. Whether these efforts—a bullet train to and from small cities, banning the sale of gasoline cars by 2035, limiting the use of gas appliances, and similar aggressive policies—make real-world sense or whether they are a virtue-signaling crystal ball without a feasible way of measuring those efforts remains to be seen.

This is the nub of the Climate Act problem.  Can we come up with net-zero transition policies that will not do more harm than good.  Nalven’s article describes how Curry lays out the wicked problem of whether climate action is necessary and how it should be addressed given the uncertainties.  Nalven sums up:

Curry’s approach stands in stark contrast to the overreach and catastrophizing by climate justice warriors. Those warriors and their acolytes are unlikely to be persuaded by Curry’s pragmatic, but seemingly slower, approach to a changing climate.

There is no magic wand, no scientific alchemy, that can easily upend cognitive catastrophizing about weather events.

“The disconnect between historical data for the past 100 years and climate model-based projections of worsening extreme weather events presents a real conundrum regarding the basis on which to assess risk and make policies when theory and historical data are in such disagreement.”

Conclusion

Chris Martz sums up my concern about the mis-allocation of resources based on the fear of climate change:

Whether or not climate change is having any meaningful impact on the extreme weather events we care about is irrelevant in the need to raise awareness to the fact that we continue to develop in disaster-prone areas and the necessity to improve societal resilience through better zoning codes and community planning. Mother Nature always has and always will throw curveballs in our direction, regardless of what the climate is doing in the long-term, and being better equipped to mitigate disaster losses or prevent them in the first place must be a focal point of engineers, emergency managers and policymakers in the years and decades to come.

Sitting on our hands and blaming climate change for everything is really a waste of time that would be better spent finding solutions to real-world problems such that our children and grandchildren have a safer world to live in.

Against this backdrop, the cartoon-like presumption that any unusual weather is tied to climate change and thus needs to be addressed whatever the cost needs to be confronted.  The difference between weather and climate does matter. N

Articles of Note March 3, 2024

I have been so busy lately with net-zero transition implementation issues that I have not had time to put together an article about every relevant post I have read.  This is a summary of posts that I think would be of interest to my readers.

I have been following the. Climate Leadership & Community Protection Act (Climate Act) since it was first proposed and most of the articles described below are related to the net-zero transition.  I have devoted a lot of time to the Climate Act because I believe the ambitions for a zero-emissions economy embodied in the Climate Act outstrip available renewable technology such that the net-zero transition will do more harm than good. The opinions expressed in this article do not reflect the position of any of my previous employers or any other company I have been associated with, these comments are mine alone.

Green Guardrails

The Empire Center’s Ken Giradin has written an exhaustive guide to New York’s drive to lower emissions.  I recommend it highly.  The Executive Summary states:

New York in 2019 adopted a sweeping climate law designed to reduce greenhouse gas emissions through bans, regulations and taxes. The law, the Climate Leadership and Community Protection Act (CLCPA), sets ambitious goals: 70 percent of electricity from renewables and a 40-percent economywide reduction in emissions by 2030, with an electric grid that uses only “zero emission” technology by 2040 and an economy that has effectively zero emissions by 2050.

The state’s approach to these goals is, however, deeply flawed. The Climate Act leaves the bulk of the decisions about how emissions will be reduced to state agencies under direct control of the governor, vesting them with policymaking powers that are supposed to be reserved for New York’s senators and assemblymembers.

The process that has played out in the five years since the law’s passage has been marred by a lack of transparency, with state officials failing to issue legally required cost estimates and crucial studies designed to guide state energy policy. There is growing evidence that the state will be unable to achieve its goals without significantly affecting the cost of living and doing business in New York and harming the reliability of its electric grid.

Giradin offers recommendations including “demanding updated state energy studies, as required by state law and the development of proper cost estimates.”  Other steps include:

  • Giving the Legislature the final say on any regulation or set of regulations with gross compliance costs of $100 million or more;
  • Ceating an “off-ramp” in case of recession or other financial emergency;
  • Setting renewable energy credit (REC) purchase requirements through legislation rather than administrative rulemaking;
  • Pausing awards for offshore wind developers amid exploding costs and making more technologies eligible for zero-emission subsidies; and
  • Eliminating obstacles to reducing emissions with steps such as making more types of zero-emission power plants such as nuclear, biogas and hydroelectric eligible for state subsidies and seeking an exemption from the federal Jones Act.

Maryland Offshore Wind

PenguinEmpireReports Substack published a great article “Whose grid is it anyways?”:

So whose grid is it? Is the grid supposed to provide flexible and dependable electricity to the customers when and where they need power? Or is the grid sub-servant to wind and solar? Is it the customer’s job to be ‘flexible’ to accommodate inflexible renewables? Who is the grid supposed to serve:

A. The customer?

or

B. Whatever power source is politically favored at the moment?

Fundamental Climate Model Concern

One of the reasons that I distrust climate models is because they do not model clouds well.  It turns out that there is another issue with moisture.  Pierre Gosselin explains that “A new study published in PNAS has demonstrated, once again, that climate models fail to simulate what happens in the real world with regard to fundamental climate change variables like water vapor. This is a devastating finding, as water vapor is the most significant greenhouse gas due to its alleged “feedback” capacity, accelerating warming well beyond what CO2 is said to be capable of alone.

Coming Soon to New York

The Institute for Energy Research reports that Massachusetts utilities are asking for rate increase:

Eversource and National Grid, the major utilities in Massachusetts, are requesting rate hikes to enhance the power grid and accommodate the growing demand from electric vehicles and heat pumps. They are requesting approximately $2.4 billion over the next five years for grid improvements to convert the grid for renewable energy production and make it more resilient and capable of handling the surge in electrification. That is because Biden’s and the state’s climate agenda will result in Massachusetts homes consuming nearly three times as much electricity by 2050 than they do today. To deliver all that power, Eversource and National Grid will have to invest billions in grid infrastructure upgrades with ratepayers picking up much of the cost. The two utilities have asked the state Department of Public Utilities to begin the process of recouping their investments in converting the electric grid by raising rates over a five-year period.

The Death of a Wind Farm: Why the United States is No Country for Old Wind
A Substack article by Isaac Orr and Mitch Rolling explains:

Taxpayer subsidies and utility profit motives are converging to incentivize the premature destruction and replacement of wind installations throughout America, and this trend will almost certainly become more common as an increasing number of wind turbines are added to the nation’s electric grid. Utility companies and wind turbine operators will seek to renew their access to the PTC to reduce the need for curtailment and to increase their government-approved profits on capital expenditures as long as these subsidies are available.

For your information New York’s October 2023  land-based renewable energy procurement included 612 MW of wind turbine re-powering.

Fundamental Greenhouse Gas Effect Concern

The Science and Environmental Policy Project Weekly Climate and Energy News Roundup #588 explains that physicist Howard Hayden demonstrates that AR6 is inconsistent with itself and with the Stefan-Boltzmann law which specifies the amount of radiation emitted per unit of time from a specific area of a blackbody.  A webpage describing observations of infrared radiation compares radiation measurements with temperature measurements.  The following results are described:

Both upward and downward infrared radiation can be measured by pyrgeometers mounted 1.5 to 2 meters (4.5 to 6 feet) above the ground. These measurements vary seasonally and by year. The example shown by the Japan Meteorological Agency at Tsukuba, Japan, the home of Tsukuba Science City and the headquarters of the Japan Aerospace Exploration Agency shows this variation and a modest increase in downward infrared radiation but not an appreciable increase in upward infrared radiation indicating a warming.

Update: Climate Act Emission Reductions in Context

A couple of years ago I posted an article about New York GHG emissions  and found that they are less than one half of one percent of global emissions and that global emissions have been increasing on average by more than one half of one percent per year since 1990. I was recently asked to document that claim and updated that analysis.  This post describes the results.

I have followed the Climate Act since it was first proposed, submitted comments on the Climate Act implementation plan, and have written over 400 articles about New York’s net-zero transition. The opinions expressed in this post do not reflect the position of any of my previous employers or any other organization I have been associated with, these comments are mine alone.

Overview

The Climate Act established a New York “Net Zero” target (85% reduction in GHG emissions and 15% offset of emissions) by 2050.  It includes an interim 2030 reduction target of a 40% reduction by 2030 and a requirement that all electricity generated be “zero-emissions” by 2040. The Climate Action Council (CAC) is responsible for preparing the Scoping Plan that outlines how to “achieve the State’s bold clean energy and climate agenda.”  In brief, that plan is to electrify everything possible using zero-emissions electricity. The Integration Analysis prepared by the New York State Energy Research and Development Authority (NYSERDA) and its consultants quantifies the impact of the electrification strategies.  That material was used to develop the Draft Scoping Plan outline of strategies.  After a year-long review, the Scoping Plan was finalized at the end of 2022.  In 2023 the Scoping Plan recommendations were supposed to be implemented through regulation, PSC orders, and legislation.  Not surprisingly, the aspirational schedule of the Climate Act has proven to be more difficult to implement than planned and many aspects of the transition are falling behind.  In addition, there has not been any additional documentation provided that proves that the transition will be affordable, keep the same standards of energy reliability, or not have unacceptable cumulative environmental impacts.

GHG Emissions

I frequently note that New York greenhouse gas emissions are less than one half of one percent of global emissions, and global emissions have been increasing by more than one half of one percent per year since 1990.  This post shows that the claim is still true.

I originally used information from my post Climate Act Emission Reductions in Context to support that claim.  I recently updated the analysis.  I found CO2 and GHG emissions data for the world’s countries and consolidated the data in a spreadsheet.  There is interannual variation, but the five-year annual average has always been greater than 0.79% until the COVID year of 2020.  For the New York data I used GWP-100 data from Open Data NY through 2021 as documented in this post.  New York’s share of global GHG emissions is 0.42% in 2019 so this means that global annual increases in GHG emissions are greater than New York’s total contribution to global emissions.

The data used are shown in the following table.

Global and New York State GHG and CO2 Emissions (million metric tonnes)

The following graph lists the five-year annual average GHG and CO2 NY emissions and the annual change in the five-year global GHG and CO2 emissions.  Note that for most years the global change in emissions is greater than New York emissions.  Anything New York does to reduce emissions will be supplanted by emission increases elsewhere in less than a year.

Conclusion

By any measure New York’s complete elimination of GHG emissions is so small that there will not be any effect on the state’s climate and global climate change impacts to New York.  I previously showed that although New York’s economy would be ranked ninth relative to other countries, New York’s emissions are only 0.45% of global emissions which ranks 35th.  This post graphically shows New York emissions are negligible compared to global emissions.  The change to global warming from eliminating New York GHG emissions is only 0.01°C by the year 2100 which is too small to be measured much less influence any of the purported damages of greenhouse gas emissions.  Finally, this post shows global emissions have increased more than New York’s total share of global emissions consistently since 1990.  In other words, whatever New York does to reduce emissions will be supplanted by global emissions increases in a year.

The only possible conclusion is that the Climate Act emissions reduction program is nothing more than virtue-signaling.  Given the likely significant costs, risks to reliability, and other impacts to New York society, I think that the schedule and ambition of the Climate Act targets needs to be re-assessed for such an empty gesture.

Ellenbogen Comments on DEFR Proceeding

Richard Ellenbogen recently submitted comments as part of the record for the Department of Public Service Proceeding 15-E-0302 related to the net -zero mandate of the Climate Leadership and Community Protection Act (CLCPA), Last spring the New York State Public Service Commission (PSC) recently initiated an Order initiating a process regarding the zero-emissions target” that will “identify innovative technologies to ensure reliability of a zero-emissions electric grid”.   His comments discuss “a viable, affordable, and rapidly executable  Plan B to assist NY State in reducing its carbon footprint  using technologies that actually exist at scale, unlike the technologies proposed by the CLCPA which only exist at scale in the fantasies of its proponents.”  I think it is important that his message gets out to all New Yorkers to try to avert the inevitable collision between aspiration and reality..

Ellenbogen is the President [BIO] Allied Converters and frequently copies me on emails that address various issues associated with the CLCPA.  I have published other articles by Ellenbogen, a description of his keynote address to the Business Council of New York 2023 Renewable Energy Conference Energy titled: “Energy on Demand as the Life Blood of Business and Entrepreneurship in the State -video here:  Why NY State Must Rethink Its Energy Plan and Ten Suggestions to Help Fix the Problems”,  and another video presentation he developed describing problems with CLCPA implementation.  There are only a few people in New York that are trying to educate people about the risks of the CLCPA with as much passion as I am, but Richard certainly fits that description.  He comes at the problem as an engineer who truly cares about the environment and how best to improve the environment without unintended consequences.  He has spent an enormous amount of time honing his presentation summarizing the problems he sees but most of all the environmental performance record of his business shows that he is walking the walk.   The comments described here put his thoughts on the record.

CLCPA Overview

The CLCPA established a New York “Net Zero” target (85% reduction and 15% offset of emissions) by 2050.  It includes an interim 2030 reduction target of a 40% reduction by 2030 and a requirement that all electricity generated be “zero-emissions” by 2040. The Climate Action Council (CAC) is responsible for preparing the Scoping Plan that outlines how to “achieve the State’s bold clean energy and climate agenda.”  In brief, that plan is to electrify everything possible using zero-emissions electricity. The Integration Analysis prepared by the New York State Energy Research and Development Authority (NYSERDA) and its consultants quantifies the impact of the electrification strategies.  That material was used to develop the Draft Scoping Plan.  After a year-long review, the Scoping Plan recommendations were finalized at the end of 2022.  In 2023 the Scoping Plan recommendations are supposed to be implemented through regulation and legislation. 

Although vocal members of the Climate Action Council refused to acknowledge that not all the technology necessary for net-zero transition is available today the PSC zero-emissions target order recognizes that is not true.  The Council ideologues ignored the fact that the Integration Analysis recognized that “as renewable resources and storage facilities are added to the State’s energy supply, additional clean-energy resources capable of responding to fluctuating conditions might be needed to maintain the reliability of the electric grid”.  I published a post last summer summarizing the proceeding, including an overview of the questions raised by the PSC, and describing t comments I submitted.

I described the first set of comments for this Order submitted by Ellenbogen last summer.  In order to make it easier for readers I have copied his submittal here.  I converted his footnotes into inline references because footnotes do not lend themselves to blog posts. 

About the Author

The first section of his comments describes his background and its relevance to the Proceeding.

Richard Ellenbogen an active party in the case , a resident of the State of New York, the CEO of Allied Converters, and welcomes the opportunity to provide comments as requested by the Commission in the above referenced proceeding, issued in the May 18, 2023 “Order Initiating Process Regarding Zero Target”.

I am a Former Bell Labs Engineer that has done work on the Utility System with NYSERDA and Con Ed. I also decarbonized my factory starting in 1999 and those measurements resulted in the Public Service Commissions Case 08-E-0751 to reduce power line losses. I was an invited speaker to a PSC Utility Conference in 2008 for that case on Line Loss Reduction that was initiated by Steven Keller based upon my work at the factory and a paper written at the request of Con Ed after a factory visit. I was the Keynote Speaker at the 2023 Business Council of NY Renewable Energy Conference and an invited speaker at the Dutchess County Chamber of Commerce meeting on Energy. I was an early adopter of renewable technologies going back to the 1990’s and decarbonized both my home and my business two decades ago. Between 2006 and mid-2023, the business recycled or repurposed 100% of its waste and sent nothing to a landfill. Over the past 20 years, the factory has generated between 60% and 85% of its electrical energy onsite with a carbon footprint approximately 30% lower than the Con Ed System, even prior to the closing of Indian Point.

I have lived live in an “electric” house since 2004 with a solar array and a geo-thermal heating system with 100% radiant heat using 95–100-degree water with a COP between 5.5 – 6.0, far more efficient than what most places will build under NY State guidelines, and I have driven an EV for six years. As all of the parameters in both the house and factory are measured three times per minute, I see firsthand what implementing the CLCPA will do to the load every day. The house was written up in the NY Times in November, 2008 under “Going Green: Still Challenging Turf” and the factory was written up in the Wall Street Journal under, “Westchester Plastics Maker Embraced Renewable Energy Decades Before The Gas Moratorium”.4 Additionally, I defeated Con Ed in a tariff hearing (NY State Public Service Commission Case 08-E-1426 Allied Converters, Inc. – Petition For a Declaratory Ruling on the Administration of Solar Net Metering Provisions at Locations Where Multiple (Hybrid) Energy Efficient Generation Technologies Are Installed) in 2008-2009 to allow additional interconnection of renewables and the factory became the first building in NY State with multiple sources of high efficiency grid connected generation.

It is through this lens that I have developed an understanding of the shortcomings of renewables after over 20 years of living with them. They are a great way to reduce the reliance on fossil fuels but attempting to run the entire system on them is going to be an unmitigated disaster which will be documented in the following pages. The requirement in the CLCPA for 25 – 37 Gigawatts of Dispatchable Emission Free Generation (DEFR) by 2040 is problematic at best and is impossible to execute in the stated sixteen year time frame, especially when considering that a single 1.2 GW Power Cable will have taken nearly that long to plan, construct, and get operational (2011 – 2026). I recommend that this DEFR proceeding determine whether there is a dispatchable emissions-free resource that can provide sufficient baseload and, if not, recommend a Plan B.

Introduction

The introduction lays out reasons that things have changed since last summer that could affect the schedule and viability of the Scoping Plan list of control strategies.

Since the original filing was made in August, a lot has changed in the NY State energy landscape. Renewables projects requested $12 billion in infaltionary increases that were declined by the Public Service Commission and that led to the cancellation of numerous projects, including solar, offshore wind, and battery storage. Those resources are now being rebid, likely at a significantly higher price.

The NYISO has indicated that the peaker plants will be operating far longer than planned because of a lack of renewables needed to replace them. Champlain Hudson Power Express (CHPE) is running into issues with landholders in upstate NY and may have to make eminent domain filings for certain parcels. It will not cripple the project but may delay it.

As mentioned in the earlier filing, the NYSERDA 6 GW Energy Storage Report, on page 94 of the 104 pages documents a need for 1000+ hours of storage or 6000 GWh of storage. Text from page 94 follows in italics.

Solar output is highest in the summer and lowest in the winter, and wind output is complementary to solar, as shown in Figure 40. With seasonal storage (1000+ hours), the availability of a specific resource during critical weeks – or in between multiple critical weeks in a season matters less; instead, the cheapest form of energy, such as solar in the spring and summer, can be stored and discharged over multiple winter weeks.

Column C in Figure 1, below, shows the 6,000 GWh of storage on the same scale of generation and demand. It is almost non-existent relative to the loads and will be totally inadequate to support the system. Far more storage than that will be needed to support a renewable system, however the NYSERDA report also documents a cost of $560 per KWh. At that price, the 6,000 GWh will cost $3.4 trillion, or about 16 times NY State’s annual budget. Some have been proposing using EV batteries to support the system. Having driven an EV for six years, I am almost never near a charger except when I am charging so there would be no way to feed energy back into the system. Further, how many people will willingly use their car to support the utility when they find out they will rescive 20% less revenue for discharging than they paid for charging and that the more frequent cycling will shorten the battery life. There are also capacitive batteries now being manufactured that will have a longer life span and a greatly reduced fire risk, however that are not ready for mass distribution. They also have a much lower energy density which makes them larger. That will work for utility scale storage but not EV’s. However, the price is roughly comparable to Lithium-Ion batteries so they will still be prohibitively expensive if used to support the utility system..

The Renewable Generation shown in column D was based upon 2019 projections that are no longer applicable as several Offshore Wind contracts have been canceled and several land based solar and wind projects have been canceled and others are meeting local resistance.

Additional Issues

Ellenbogen explains that these are not the only issues.

We are reaching a crossroads in New York State whereby the cost of the renewable generation and other mandates included in the CLCPA may make it impossible to live or work here.

The New Jersey nuclear plants announced this past week that they no longer need state subsidies because of the Inflation Reduction Act (IRA) subsidies that are now available to them. This raises the question, what does nuclear generation cost relative to the renewables that NY State is having enormous difficulty getting installed? Is there a viable carbon free Plan B?

This link is from a paper from September, 2022, published by the Cato Institute, regarding the costs of different generating options and the effect of the IRA on the cost of nuclear generation.

If you look at Table 2 below, from the paper, in the lower left hand column (Baseline), you will see that the UNSUBSIDIZED HIGH CONSTRUCTION cost for nuclear generation is 14.4 cents per KWh. The expected bids for Offshore wind are expected to come in substantially higher than that and the earlier bids were nearly that large. The recently canceled wind bids in NY State varied from $107 per MWh to $118 per MWh, despite Wind generation in the United States being heavily subsidized.

The next table shows the recently canceled wind bids and their costs. The requested increase had an average cost of $167/MWh. These are going to be rebid at a higher price and many will not be available for over 6 years, at a minimum, if they are ever built. Also note that the total capacity listed is 5 GW short of NY State’s ultimate goals. I referred to the High-Cost nuclear construction scenario because that is approximately what the recently built Vogtle reactors costs correlate with. This is a worst-case comparison of nuclear generation compared to the renewable generation.

Bids For Offshore Wind In NY State

According to information developed by David Stevenson (described here) ) the new projects were approved by NYSERDA with an average nominal cost MWh of $145.07 which compares to $167.07 in the table above. The table prices were requested in December 2023 while the new projects bids were likely made in early 2023 and may not reflect the tine cost needed to obtain financing today. The projects in the table most likely would have started construction in 2025 while the new projects are slated to start in 2030. It is highly likely that by 2030 the projects could not be built at these prices and the developers will come back for higher prices.

A recent blog post presented by Parker Gallant Energy Perspectives and highlighted in a recent post by Roger Caiazza of The Pragmatic Environmentalist, analyzed the costs of various generation types in Ontario, Canada. The results are shown in the table below. In Ontario, Nuclear Generation is approximately 30% less expensive than wind and 40% less than solar despite the claims that wind and solar are less expensive. Combined cycle gas generation is slightly less than nuclear in Canada.

That shows that unsubsidized nuclear is less expensive than OSW and doesn’t kill any birds or people, despite the claims of the fear mongers. OSW and solar could cost NY State ratepayers 30% more than nuclear generation, not including the costs of the required batteries and the more extensive transmission lines needed for those technologies due to their low capacity factor. If batteries are added in to support the intermittent renewables, the costs will be higher still. As shown in the earlier analysis of battery costs based upon the NYSERDA Energy Storage Report, the required batteries will cost more than the nuclear generation, independent of the costs of the renewable generation.

Again, I have developed an understanding of the shortcomings of renewables after over 20 years of living with them. In my experience, I believe that they are a great way to reduce the reliance on fossil fuels but expectations that they can completely replace fossil fuels are misplaced. A primary concern is cost and maintaining public support for the process. Public support will evaporate quickly with the current projected costs of the wind, solar, and batteries.

Regarding “Cap and Invest”, Table 3 below is also from the Cato Paper. It shows the carbon taxes required to achieve parity between nuclear and fossil fuel generation. With the High Cost nuclear, the carbon tax required to bring nuclear into parity with combined cycle gas generation is $196 per Metric Ton of CO2. According to the EIA, combined cycle gas generation will yield 2.25 MWh per metric ton of CO2 (976 pounds per MWh).  With wind being more expensive than nuclear by between 20% and 30%, it will cost between $235 – $275 per metric ton to bring wind and Combined cycle gas generation into parity. Doing the math, $235 / 2.25 to make wind cost effective when compared to natural gas, even with the current subsidies, the taxes would be over $100/MWh. It would double the cost of the energy in the entire downstate region. If electric heat is forced upon the downstate residents, a current doubling of operating costs will morph to a tripling or quadrupling of heating bills for downstate residents.

Keep in mind that natural gas prices have dropped since 2022 so the actual tax would have to be higher in 2024.

These are the kinds of taxes that Cap and Invest will have to assess to make the plan work and they are ludicrous. Even without Cap and Invest, these are the additional costs that are going to be incurred by NY State ratepayers if the CLCPA keeps progressing. What makes this situation even worse is that the state can’t effectively install generation that won’t be taxed, building owners don’t have space or can’t afford upgrades to avoid penalties from the mandates, and the proponents of this plan can’t define who is going to pay the tax, acting as if the ratepayers and the taxpayers are mutually exclusive. A Venn Diagram of NY State ratepayers and NY State taxpayers will have an enormous amount of overlap.

A Viable Low Carbon / Carbon Free Solution That Will Not Bankrupt NY State Residents and Businesses

Ellenbogen offers a pragmatic alternative.

As nuclear generation takes years to get approved and sited, new combined cycle natural gas generation that feeds the CO2 emissions into greenhouses will provide low carbon energy at a low cost for NY State ratepayers in the near term. It is the least expensive generation to build and at present, it is also the least expensive generation to operate. It can provide baseload generation so it will eliminate the cost of battery storage. As it operates with a capacity factor two to seven times higher than renewables, the cost per MWh of transmission will be that much less expensive. As an initial step, siting a large combined cycle generating plant in Central New York, near the Western end of CleanPath, would provide easy access to natural gas from Pennsylvania while also allowing CleanPath to be fully utilized, reducing its costs to taxpayers. Additionally, there is available land in Central NY that is already used for farming that would be ideal to support large greenhouses. Routes 81, 86, and 88 provide easy access for shipping the agricultural products to population centers in NY State within four hours.

As can be seen in the following graph (Figure 2) a comparison of the emissions of Long Island Generating plants, the newer Caithness plant, shown on the right, operates far more cleanly than the E F Barret Plant shown on the left. E F Barret, which is a conventional steam generating plant that is operating well past its useful lifetime because of flawed NY State policy, was supposed to be replaced by a combined cycle plant six years ago. However, the expectation that Offshore Wind would replace it has fallen flat and Long Island residents are suffering with higher emissions and twice the energy cost of what could have been built six years ago. The Offshore Wind, if it is ever built, will reduce the emissions but based upon the current cost structure, it will not improve upon the operating costs of the old plant. This issue was addressed at length in the earlier filing.

By feeding the CO2 output of the combined cycle plants into large greenhouses, it can be used to increase crop yield by providing a twelve month growing season for NY State farms and increase food security in the state while using less land and water than existing farms. It will also use far less land than renewable generation. Additionally, it will harden farming in NY State to the effects of climate change.

Unlike the 25–37 Gigawatts of as yet unknown and non-existent Dispatchable Carbon Free Generation fantasized about in the CLCPA, this technology exists now and the greenhouses will cost far less than the batteries while also generating revenue and extremely high crop yields. The greenhouses will also last well beyond the 10 year lifespan of the batteries so they are a far more cost effective capital investment to make.

Additionally, operating EV’s from combined cycle gas generation is far more energy efficient than using internal combustion engines and will greatly reduce harmful pollutant emissions in the population centers.

Conclusion

Ellenbogen concludes that an alternative that does not go to zero provides a better solution.

Interim Combined Cycle Natural Gas Generation phasing to nuclear over time is a far more cost effective and secure way to power the state than what the CLCPA is mandating. Recovering the Combined Cycle emissions in greenhouses will mitigate the negative effect of the carbon emissions. That will also provide energy security that renewables can’t, while simultaneously providing food security as climate change makes food production more challenging.

Pragmatic Environmentalist Conclusion

The Hochul Administration has supported the ideological insistence that the schedule is necessary, and that zero-emissions in the electric sector by 2040 is mandatory.  This is a political construct that does not stand up to any realistic evaluation.  I have shown that New York’s GHG emissions are less than one half of one percent of global emissions and that global emissions are increasing by more than one half of one percent per year.  That fact destroys any urgency arguments.  We have time to do this right.  This also implies that not reaching zero will not influence the alleged impacts to global warming.  Ellenbogen’s alternative does not meet the ideological mandates but would be affordable, reliable, and have fewer environmental impacts.  I endorse his comments.

NY Offshore Wind Perspectives February 2024

Offshore wind (OSW) is a key component of the Climate Leadership & Community Protection Act (Climate Act).  This article highlights material on costs and the leasing process that suggests it is not going to end well.  Affordability is a major concern of mine and the costs for offshore wind are extraordinarily high.  David Stevenson prepared a summary of costs that deserves wider distribution.  Bud’s Offshore Energy blog  argued that unrealistic power generation deadlines should not be the focus of the Bureau of Ocean Energy Management (BOEM) leasing policy.

I have followed the Climate Act since it was first proposed, submitted comments on the Climate Act implementation plan, and have written over 400 articles about New York’s net-zero transition. The opinions expressed in this post do not reflect the position of any of my previous employers or any other organization I have been associated with, these comments are mine alone.

Overview

The Climate Act established a New York “Net Zero” target (85% reduction in GHG emissions and 15% offset of emissions) by 2050.  It includes an interim 2030 reduction target of a 40% reduction by 2030 and a requirement that all electricity generated be “zero-emissions” by 2040. Because nothing says sound energy policy like one designed politicians, the Climate Act also includes a requirement for 9 GW of offshore wind by 2035.  The Climate Action Council (CAC) is responsible for preparing the Scoping Plan that outlines how to “achieve the State’s bold clean energy and climate agenda.”  In brief, that plan is to electrify everything possible using zero-emissions electricity. The Integration Analysis prepared by the New York State Energy Research and Development Authority (NYSERDA) and its consultants quantifies the impact of the electrification strategies.  That material was used to develop the Draft Scoping Plan outline of strategies.  After a year-long review, the Scoping Plan was finalized at the end of 2022.  In 2023 the Scoping Plan recommendations were supposed to be implemented through regulation, PSC orders, and legislation.  Not surprisingly, the aspirational schedule of the Climate Act has proven to be more difficult to implement than planned and many aspects of the transition are falling behind. 

Offshore Wind Costs

Richard Ellenbogen recently submitted comments that compared nuclear costs to other proposed dispatchable emissions-free resources which I cover in another post.  His analysis included an assessment of OSW, but he was unable to come up with good cost numbers.  David Stevenson has some numbers available which are shown below.  David has spent the last twelve years as the Director of the Center for Energy & Environment for the Caesar Rodney Institute, a bipartisan free market think tank. He has published over 150 analytic studies including major studies on the Regional Greenhouse Gas Initiative, the EPA Clean Power Plan, electric grid reliability, the public policy drivers of energy cost, offshore wind, electric vehicles, carbon capture, nuclear energy, and climate change. 

Some background on New York’s OSW plans.  The New York State Energy Research & Development Authority (NYSERDA) issues competitive solicitations for offshore wind energy and contracts with offshore wind developers to purchase offshore renewable energy certificates.  Early last summer four previously approved New York OSW projects requested higher price guarantees as shown in the following table.  James Hanley wrote an article The Rising Cost of Offshore Wind that describes two issues affecting all OSW projects across the world that accounts for some of the cost increases requested:

But this recent growth in the offshore wind industry does not necessarily reflect its long-term health. Two substantial headwinds threaten to make projects uneconomical. One is the recent high inflation, which raised the costs of materials and labor across all industries, and the other is bottlenecked supply chains that are causing a bidding-up of the prices of materials and components needed for building wind turbines.

 Hanley explained the ramifications to the OSW projects in New York and linked to the request for increases:

Stevenson produced this summary of the costs associated with these requests for more money.

Requested increased price guarantees in New York

On October 12, 2023 the Public Service Commission turned down this request to raise the prices.  Times Union writer Rick Karlin summarizes:

At issue was a request in June by ACE NY, as well as Empire Offshore Wind LLC, Beacon Wind LLC, and Sunrise Wind LLC, which are putting up the offshore wind tower farms.

All told, the request, which was in the form of a filing before the PSC, represented four offshore wind projects totaling 4.2 gigawatts of power, five land-based wind farms worth 7.5 gigawatts and 81 large solar arrays.

All of these projects are underway but not completed. They have already been selected and are under contract with the New York State Energy Research and Development Authority, or NYSERDA, to help New York transition to a clean power grid, as called for in the Climate Leadership and Community Protection Act, approved by the state Legislature and signed into law in 2019.

Developer response suggests that “a number of planned projects will now be canceled, and their developers will try to rebid for a higher price at a later date — which will lead to delays in ushering in an era of green energy in New York”. Karlin also quotes Fred Zalcman, director of the New York Offshore Wind Alliance: “Today’s PSC decision denying relief to the portfolio of contracted offshore wind projects puts these projects in serious jeopardy,”

Later in October new projects were approved by NYSERDA with an average nominal cost/ MWh of $145.07 which compares to $167.07 in the table above.  Stevenson explains that the table prices were requested in December 2023 while the new projects bids were probably made in early 2023 and may not reflect the true cost needed to obtain financing today.  The original four projects cancelled most likely would have started construction in 2025 while the new projects are slated to start in 2030. 

Here is what NYSERDA reported about the recent projects that include Attentive Energy One at 1,404 MW, Community Offshore Wind at 1,314 MW, and Excelsior Wind at 1,314 MW:

“The weighted average strike price of the awarded offshore wind projects over the (25 year) life of the contracts is $96.72 per megawatt hour in 2023 (real) dollars, which equates to a nominal weighted average strike price of $145.07 per megawatt hour. The strike prices comprising the weighted average cited above are subject to certain adjustments in accordance with the terms of the awarded contracts, including, in some cases, adjustments based on certain price indices, interconnection costs and/or receipt of qualifying federal support.”

Stevenson said “it looks to me that the award allows prices to increase 3% a year”.  The strike price is the guaranteed price.  The premium payment to the wind developer will be reduced by any revenue they receive from selling the wholesale power and any capacity value which might total about $60/MWh over the life of the projects so the net premium price might be about $85/MWh.  In addition, there may be other inflation adders based on NYSERDA’s wording.

Soon after the Public Service Commission refused to approve the higher costs for four contracts last October, the Hochul Administration announced that expedited offshore wind solicitations for the state will be held early in 2024.

Projects that previously petitioned the New York State Public Service Commission for financial relief can choose to participate, though the solicitation will also emphasize competition between these and other projects, ensuring the integrity of the process and best value for New York electricity consumers, according to the press release.

The solicitations were announced in January and the deadline for submittals recently passed.  The results will be announced soon.

Stevenson also provided cost estimated for two new projects have been approved in New Jersey that he expects will be similar to the expedited New York solicitations.  The 2,400 MW Invenergy project will average $152.91/MWh, and the 1,342 MW Attentive One will average $187.83 over their twenty-year life considering their 2.5% and 3% per year allowed price increases.  In addition, each of the 2032 startups expect 30% federal Investment Tax Credits, and New Jersey is allowing up to 15% additional inflation adjusters that could bring average costs to $175.84 and $216.01/MWh.  The New York projects may have a similar inflator. 

He notes that Attentive Wind One is projecting a ridiculously high 56% capacity factor.  Most projects estimate capacity factors of 42% to 44%, like actual results from the five turbine Block Island and two turbine Coastal Virginia projects.  Two factors suggest much lower capacity factors for larger projects.  Below is the annual production curve for six years at Block Island.  Notice the highest generation occurs in the spring and fall when electric demand is lowest.  The Virginia turbines show a similar pattern.  With many large projects all doing the same the regional grids will not be able to take all the power produced so turbines will have to be shut down, or curtailed.  PJM expects average capacity factors will be 37% because of this curtailment.

European studies of offshore wind show a second impact known as the “Wake Effect”.  The first row of turbines absorb wing power leaving succeeding rows with less wind energy.  The impact could be to drop electric generation another 5% to 10%.  Lower generation means higher guaranteed prices will be needed.  We will most likely see future nominal strike prices routinely above $200/MWh.

Deadlines and Wind Deployment

Bud’s Offshore Energy blog  points out that unrealistic power generation deadlines should not be the focus of the Bureau of Ocean Energy Management (BOEM) leasing policy.  This argument also applies to the Climate Act’s arbitrary offshore wind deployment requirements.  In reference to wind leasing issues in Oregon he explained:

As concerns about wind leasing mount, it is becoming increasingly apparent that the rush to hold auctions may not be in the best long-term interest of the wind program. The primary objective should be cost-effective and responsible development, not gigawatt deadlines. The administration’s vision for wind energy capacity, particularly the 15 GW goal for floating turbines by 2035, is unlikely to be achieved and rushing the process is not helpful.

The current wind program is reminiscent of James Watt’s ill-fated approach to oil and gas leasing. Watt’s “lease-everything now” agenda had the opposite effect of that which was intended, the result being that 96.3% of our offshore land is now off-limits to oil and gas leasing.

Affected parties in Oregon have not held back in voicing their displeasure with BOEM’s wind energy announcement.

“BOEM wants offshore wind come hell or high water and they don’t care who they harm to get it.

Heather Mann, executive director of Midwater Trawlers Cooperative

The Confederated Tribes of Coos, Lower Umpqua and Siuslaw tribal council unanimously passed a resolution opposing offshore wind energy development off the Oregon coast.

“The federal government states that it has ‘engaged’ with the Tribe, but that engagement has amounted to listening to the Tribe’s concerns and ignoring them and providing promises that they may be dealt with at some later stage of the process. The Tribe will not stand by while a project is developed that causes it more harm than good – this is simply green colonialism.”

Coos, Lower Umpqua and Siuslaw tribal council Chair Brad Kneaper

Discussion

These two perspectives address my concerns about affordability and reliability.  The Climate Action Council got bogged down in its Scoping Plan review with ideological discussions.  For example, an inordinate amount of time was spent arguing whether natural gas should instead be called fossil gas in the Scoping Plan..  As a result, the Council never established criteria for affordability and reliability presuming that because the Integration Analysis projections supported their narrative that those issues would not arise. 

I believe that the issues are rapidly approaching the fan of reality and they will hit soon.  Soon the reality that the aspirational schedule is untenable, the costs are higher than admitted, and there are ramifications to reliability because no new fossil power are being built to replace the irreplaceable aging fossil plants before the magical resources are developed.  There is a safety valve that can be used by the Public Service Commission that gives me hope that this mess can be averted.   New York Public Service Law  § 66-p (4). “Establishment of a renewable energy program” includes safety valve conditions for affordability and reliability.   § 66-p (4) states: “The commission may temporarily suspend or modify the obligations under such program provided that the commission, after conducting a hearing as provided in section twenty of this chapter, makes a finding that the program impedes the provision of safe and adequate electric service; the program is likely to impair existing obligations and agreements; and/or that there is a significant increase in arrears or service disconnections that the commission determines is related to the program”.  The political ramifications of employing this would be enormous but the impacts of the failure to pause this absurd energy plan would be much worse.  I believe that the Public Service Commission should assure that New Yorkers can continue to have access to reliable and affordable electricity by defining standards for those affordability and reliability criteria.

Conclusion

I cannot over-emphasize how much I agree that the primary objective of offshore wind development “should be cost-effective and responsible development, not gigawatt deadlines”.  With the addition of evolving development costs as supply chain and infrastructure support requirements become clear, it is not in the interests of New York to continue the mad rush to try to meet arbitrary gigawatt deadlines.  This also applies to the development of ll solar and wind.   Legitimate affordability, reliability, and environmental concerns are being ignored in the rush to build as much as possible as soon as possible. 

Weather and Climate Revisited

I have been a persistent critic of the Hochul Administration’s consistent linking of any extreme weather event to climate change as rationale for the Climate Leadership & Community Protection Act (Climate Act).  In my articles responding to the claims I explain that according to the National Oceanic and Atmospheric Administration’s National Ocean Service “Weather reflects short-term conditions of the atmosphere while climate is the average daily weather for an extended period of time at a certain location.”  The referenced article goes on to explain “Climate is what you expect, weather is what you get.”  This post is in respond to a friend who says that he has “grappled with this statement in the past, but still don’t fully understand it”

I have followed the Climate Act since it was first proposed, submitted comments on the Climate Act implementation plan, and have written over 400 articles about New York’s net-zero transition. The opinions expressed in this post do not reflect the position of any of my previous employers or any other organization I have been associated with, these comments are mine alone.

Overview

The Climate Act established a New York “Net Zero” target (85% reduction in GHG emissions and 15% offset of emissions) by 2050.  It includes an interim 2030 reduction target of a 40% reduction by 2030 and a requirement that all electricity generated be “zero-emissions” by 2040. The Climate Action Council (CAC) is responsible for preparing the Scoping Plan that outlines how to “achieve the State’s bold clean energy and climate agenda.”  In brief, that plan is to electrify everything possible using zero-emissions electricity. The Integration Analysis prepared by the New York State Energy Research and Development Authority (NYSERDA) and its consultants quantifies the impact of the electrification strategies.  That material was used to develop the Draft Scoping Plan outline of strategies.  After a year-long review, the Scoping Plan was finalized at the end of 2022.  In 2023 the Scoping Plan recommendations were supposed to be implemented through regulation, PSC orders, and legislation.  Not surprisingly, the aspirational schedule of the Climate Act has proven to be more difficult to implement than planned and many aspects of the transition are falling behind.  In order to keep the public’s support for the transition the Hochul Administration links recent extreme weather events to climate change.

Weather vs. Climate

The link between extreme weather and climate is commonly made by the mass media egged on by climate activists.  In response I have a page devoted to rebuttals to these claims.  I also have another page addressing climate change attribution.  I have noted that the standard climatological average is 30 years.  In order to think about a change in today’s climate averages you really should compare the current 30 years against the previous 30 years.  In order to get a trend, you need to look at as much data as possible.  On the face of it that might seem easy but the reality is that the conditions for a representative trend are difficult to achieve.  Ideally you need to use the same instruments, the same methodology, and keep the conditions around the observing location the same.

My reader friend still doesn’t understand why I am so dismissive of these claims. He wrote:

Perhaps there is a different way for you to say it that I will understand.    It seems reasonable to conclude that an individual weather event can be plausibly linked to a changing climate, if the question can be asked: “But for ____  ______,   would this have happened?”  

I think that laypeople have heard the narrative that climate change is affecting weather today so often that it “seems reasonable that an individual weather event can be plausibly linked to a changing climate”.   When I did a search on the term “what conditions can impact the weather” all that came up were articles arguing that there is a link.  This story is everywhere so the presumption that there is a plausible link is logical.  I show why that is wrong below.

My Response

I have given some thought to his perception relative to mine.  For the record, I have a BS and a MS in meteorology, have been working in the field for 50 years, but have limited forecasting experience because my emphasis has been air pollution meteorology.  I think that as a result of my background I know what is involved with weather forecasting and when I weigh all the parameters affecting a weather event relative to the limited effects associated global warming, I dismiss claims that climate change can cause any weather events.  There might be a tweak in the observed observations but that is all.

Let me explain by considering what is involved with a weather forecast.  Weather.US lists results from different weather forecast models.  This link provides a response to the question what are weather forecast models?:

Numerical Weather Prediction

Weather models, known formally as “Numerical Weather Prediction” are at the core of modern weather forecasts. All the forecast information you see at weather.us is powered by weather models, do what are they and how do they work?

Weather models are simulations of the future state of the atmosphere out through time. Millions of observations are used as initial conditions in trillions of calculations, producing a three dimensional picture of what the atmosphere might look like at some time in the future. Massive computers are used to do these calculations at incredibly fast speeds to enable simulations to cover the entire globe, and extend up to two weeks into the future.

Global vs Regional models

There are two general types of weather models, global models and regional models. Global models produce forecast output for the whole globe, generally extending a week or two into the future. Because these models cover a wider area, and a longer timespan, they’re generally run at a lower resolution, both spatially (fewer forecast points per given area) and temporally (fewer time points get a forecast).

Regional models on the other hand have much higher resolutions, but only cover some part (region) of the globe, and only provide forecasts a couple days out in time. The advantage with these models is that their higher resolution lets them “see” features that the global models miss, most notably including thunderstorms.

Why are there so many models and how are they different?

Many different national weather centers have supercomputers that run weather models. Each of these is slightly different, using different equations to solve for various physical processes that shape our weather patterns. Many of them also have slightly different resolutions, and use slightly different combinations of initial data sources.

These slight differences multiply out through time because the atmosphere is a chaotic system. This also means any errors that the models make in the near term become exponentially larger with time. This is why the forecast for a week from now is far less accurate than the forecast for tomorrow.

Weather modelling centers attempt to control for the influence of chaos by running ensemble systems that each use slightly different initial conditions. Each ensemble “member” then produces a forecast as if its set of initial conditions were correct. This provides some way of quantifying how likely a given forecast outcome is, helping to show forecast uncertainty.

My education and background included an emphasis on measuring parameters that affect weather forecasts.  The discussion above notes that models start with initial conditions that are based on these meteorological variables.  The World Meteorological Organization Measurement of Meteorological Variables report describes measuring techniques for the following parameters that all affect weather forecasts:

  • Present weather
  • Past weather
  • Wind direction and speed
  • Cloud amount
  • Cloud type
  • Cloud-base height
  • Visibility
  • Temperature
  • Relative humidity
  • Atmospheric pressure
  • Precipitation
  • Snow cover
  • Sunshine and/ or solar radiation
  • Soil temperature
  • Evaporation

Keep in mind that the initial conditions must not only include the surface observations but also observations of wind, temperature, and humidity in layers above ground.  As noted above, there are many different types of forecasts and the use of these parameters is determined by the type of forecast.  For example, if I was forecasting the impacts of air pollution within 50 miles of a source, I would not be concerned about soil temperature and evaporation. 

In this response I am addressing whether individual extreme weather events (less than a week) can be linked to climate change associated with the greenhouse gas (GHG) effect.  Increased GHGs reduces long-wave radiation (earth surface temperature) creating warming.  No weather forecast model incorporates long-wave radiation measurements because the variation is so small over a week.  Claims that climate change is affecting weather events associated with the GHG effect presume that there is warming that affects the events. 

Given all the parameters that affect weather forecasts I do not think that a tweak in temperature can be linked to the cause of a specific event for two reasons.  The first is that the temperature effect associated with the greenhouse effect is only of many parameters associated with weather events and I don’t think it has a high impact on extreme events.  The second reason is related to the discussion above about the chaotic atmosphere.  It states that “Weather modelling centers attempt to control for the influence of chaos by running ensemble systems that each use slightly different initial conditions.”   The change in atmospheric radiation due to GHG emissions is smaller than the initial conditions variation.

Given my lack of forecasting experience it is appropriate to consider another source.  Presumably climate change would have the greatest impact on heat wave.  Dr. Cliff Mass describes the effect of global warming on the Pacific Northwest Heatwave of 2021.  His synopsis:

Society needs accurate information in order to make crucial environmental decisions. Unfortunately, there has been a substantial amount of miscommunication and unscientific handwaving about the recent Northwest heatwave, and this blog post uses rigorous science to set the record straight. First, the specific ingredients that led to the heatwave are discussed, including a high-amplitude ridge of high pressure and an approaching low-pressure area that “supercharged” the warming. Second, it is shown that global warming only contributed a small about (1-2F) of the 30-40F heatwave and that proposed global warming amplification mechanisms (e.g., droughts, enhanced ridging/high pressure) cannot explain the severe heat event. It is shown that high-resolution climate models do not produce more extreme high temperatures under the modest global warming of the past several decades and that global warming may even work against extreme warming in our region. Importantly, this blog demonstrates that there is no trend towards more high-temperature records. Finally, the communication of exaggerated and unfounded claims by the media, some politicians, and several activists are discussed.

Conclusion

The premise that it seems reasonable in the statement “It seems reasonable to conclude that an individual weather event can be plausibly linked to a changing climate, if the question can be asked: ‘But for ____  ______,   would this have happened?’  “ is flawed.  The greenhouse effect is only one of many parameters affecting weather and the change in atmospheric radiation due to GHG emissions is smaller than the initial conditions variation used to address chaotic atmospheric conditions means that there is no provable link.  The suggestion that climate change causes unusual weather events ultimately is an unfalsifiable hypothesis because no test can ever show that it is not real because it cannot be detected.