

I have been documenting the electric system impacts of the late-June/early-July 2026 heat wave in a series of posts (My take and NYISO take) that relied on New York Independent System Operator (NYISO) system-wide data. This post is different. Rich Ellenbogen, an engineer who runs a factory in Westchester County that is about 1.4 miles from his home in New Rochelle, on the Con Edison system, shared measured voltage, frequency, generator, and solar array data he collected at both locations during the heat wave. His data illustrate at the distribution system level exactly the kind of electric system stress that the NYISO documents describe in the bulk-energy system.
I am convinced that implementation of the Climate Leadership & Community Protection Act (Climate Act) net-zero mandates will do more harm than good if the future electric system relies only on wind, solar, and energy storage because of reliability and affordability risks. The opinions expressed in this article do not reflect the position of any of my previous employers or any other organization I have been associated with, these comments are mine alone. I used Perplexity AI to process commentary and data that Rich Ellenbogen shared with me and prepare a draft article.
Overview
Rich Ellenbogen owns Allied Converters, a factory in Westchester County, and lives in New Rochelle, both served by Con Edison. His home and factory are instrumented with data-logging systems — in his words, computers that have recorded operating parameters about twice a minute for the past 22 years — plus a behind-the-meter solar array at each site and a backup generator at the factory. Those systems captured voltage, frequency, solar output, and generator operation throughout the heat wave, giving a distribution system view of the same stress that shows up in NYISO’s system-wide numbers.
Ellenbogen’s observations line up with what I found in my own analysis and with what NYISO reported to its Operating Committee: narrow reliability margins, unavailable generation and transmission capacity in the downstate region, and heavy reliance on demand response and imports will impact the New York electrical grid. His data add something the system-wide numbers cannot: what those stresses actually looked like at the meter, at a home and at a factory, in real time.
Voltage and Frequency at the Ellenbogen Factory
Ellenbogen described a sustained period of degraded power quality at his factory covering roughly three days. In his words:
The voltage was ‘browned out’ from about 4 AM on July 2 until 3 AM on July 4, a period of about 47 hours, and it was system wide, not isolated to New Rochelle. The fluctuations throughout the day on July 4 indicate that the system wasn’t truly stable until about 4 AM on July 5, which increases the time frame to nearly 72 hours.
Figure 1 is Ellenbogen’s graph of the voltage measured at his factory from July 1 through July 21. All three phases sag well below the normal ~120 V band for extended periods around July 2–4, with a brief excursion down toward 104–108 V on one phase before recovering. He also noted a sharp voltage dip around 5 PM on July 2 that he says “scrambled” the inverters on his backup generator, his factory solar array, and his home solar array, shutting them all down — the same behavior that produced the widespread blackout in Spain and Portugal earlier in 2025, when grid parameters pushed inverters out of their operating window and they disconnected at one time.
Figure 1: Voltage Measured at the Ellenbogen Factory, July 1–21, 2026

Source: Data provided by Rich Ellenbogen
Ellenbogen drew a pointed conclusion about battery storage from this experience, responding to a news article in which a battery-industry representative argued that current Public Service Commission rules do not reflect batteries’ ability to turn on and off at short notice when the grid needs it:
Theoretically, they can be turned on and off at will, but that assumes that you have the energy to charge them. These battery systems are all rated for four-hour storage. Peak load periods run from 4 PM until 11 PM, or about 7 hours. So what happens after 8 PM? … How is a 4 hour or even the new 8 hour battery system going to bridge a 47 hour event? After the first eight hours, they will be useless and at other times, there is sufficient generation and the batteries aren’t needed.
He also argued that trying to recharge more batteries on an already overloaded, low-voltage grid would have made conditions worse, because at lower voltage the current — and the charging losses — both increase, and that a grid heavily reliant on battery inverters could have blacked out entirely when the July 2 voltage dip pushed those inverters out of their operating range all at once.
The July 2–4 Event at the Factory
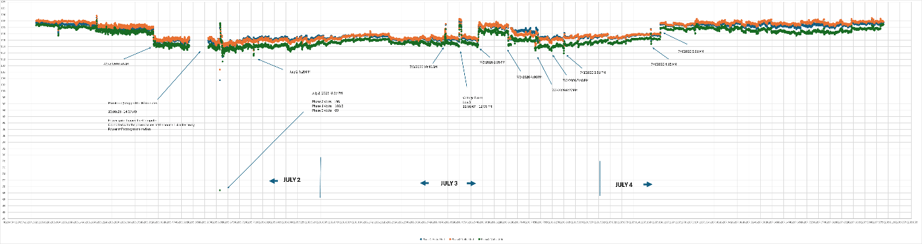
Ellenbogen also shared minute-by-minute data logged at the factory, about 1.4 miles from his house, covering the 72-hour period from July 2 through July 4. Figure 2 is his annotated graph of the three-phase voltage recorded there, with the July 2, 3, and 4 periods marked. He described it this way:
From looking at the graph, it is apparent that the system had major issues over a 51-hour period during the heat wave. From the first voltage dip at about 2 AM on July 2 until 5 AM on July 4.
Figure 2: Annotated Three-Phase Voltage at the Factory, July 2–4, 2026
Source: Data provided by Rich Ellenbogen
Figure 3 and Figure 4 are the corresponding factory frequency and solar output graphs for the same period. Ellenbogen noted that the power stayed stable enough to keep the factory’s inverters running through most of the event, and that the visible drops in solar output were due to clouds rather than any grid-side event.
Figure 3: Factory Grid Frequency, July 2–4, 2026

Source: Data provided by Rich Ellenbogen
Figure 4: Factory Solar Array Output, July 2–4, 2026

Source: Data provided by Rich Ellenbogen
The factory’s own logged data confirm the extent of the disturbance independently of Ellenbogen’s narrative. The 72-hour dataset for July 3 alone that he shared shows three-phase voltage swinging from a normal band near 118–122 V down to single digits — essentially a momentary loss of service — around 5:07 PM, with frequency simultaneously collapsing to about 47.65 Hz before recovering. The factory’s backup generator data show it running intermittently between roughly 1:11 PM and 5:11 PM that day, exactly the window when voltage and frequency were most unstable, which is consistent with the utility service becoming unreliable enough that the facility needed to generate its own power to ride through the disturbance.
Con Edison System Voltage on July 3
Figure 5 is Ellenbogen’s chart of Con Edison system voltage on July 3, again showing all three phases at his home. Voltage drifts down through the low 110s for most of the day — already below the nominal 120 V level — before a sharp collapse toward 100 V and below in the late afternoon, followed by a spike as high as roughly 130 V on recovery. He wrote:
You can see the voltage dropping throughout the day and the voltage dip that knocked out the solar array at 4:38 PM and then the spike to 130 volts. Then the blackout at 5:07 PM.
Figure 5: Con Edison System Voltage at Ellenbogen Home, July 3, 2026

Source: Data provided by Rich Ellenbogen
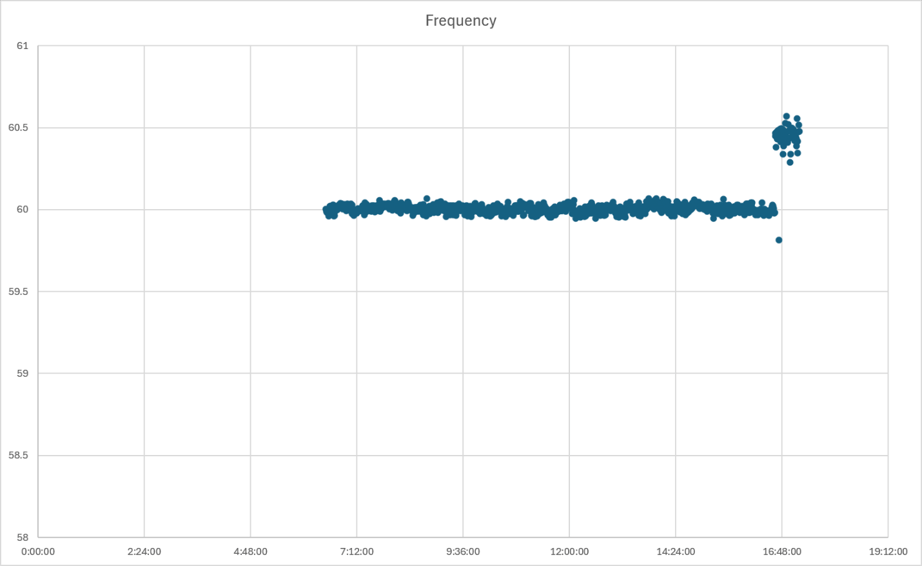
Figures 6 and 7 show the corresponding frequency data for that day, first at full scale and then “magnified” to show the deviation more clearly. Ellenbogen described normal system frequency variation as a thin, fuzzy line hovering near 60 Hz, but noted a roughly 0.5 Hz swing after 4:40 PM that he called “a lot of deviation,” culminating in the reading of 47.5 Hz that marks the moment the system failed at 5:07 PM.
Figure 6: Con Edison System Frequency at Ellenbogen Home, July 3, 2026

Source: Data provided by Rich Ellenbogen
Figure 7: Con Edison System Frequency at EllenbogenHome, July 3, 2026 (Magnified)
Source: Data provided by Rich Ellenbogen
Ellenbogen connected the voltage collapse to a growing reliance on inverter-based resources — solar and batteries — that disconnect from the grid when voltage or frequency moves outside their operating range:
Compounding the issues is that the system is getting so unstable that the Behind the Meter Solar (BTM) is shutting down, as it did at my home after the large spike … As the system is becoming reliant on the output of the BTM Solar, those shutdowns further compromise the system by reducing generation. Inverters on batteries will suffer the same fate so as the system becomes more reliant on these inverter-based technologies, it’s going to become even more compromised than it is now. The events of July 2 and 3 show how bad it has already gotten.
Home Solar Inverter Fault Log
Ellenbogen also provided the fault log from one of the inverters on his home solar array, which has more detailed logging than the older inverters at the factory. Of 353 total log entries recorded since the inverter was installed in January 2024, 54 — 15% of all entries logged over nearly 940 days of operation — occurred in just the 54-hour span between 11:26 AM on July 2 and 6:22 AM on July 4. As he put it, “the inverter was not happy.”
The fault log itself shows two distinct clusters of grid disturbances at the house. The first ran from about 11:26 AM to 1:01 PM on July 2 and logged repeated “Grid undervoltage very fast,” “Grid overvoltage fast,” and “Grid frequency disturbance” events, along with several “Phase(s) or neutral conductor not connected” faults as the inverter repeatedly disconnected and attempted to reconnect. The second cluster ran from about 4:39 PM on July 3 to 6:22 AM on July 4 — matching the timing of the voltage collapse Ellenbogen documented in Figure 5 — and shows the same pattern of undervoltage and frequency-disturbance events. There was a “Phase(s) or neutral conductor not connected” fault sequence, and finally a “Reconnection fault grid” entry at 6:38 PM on July 3 that did not clear until 6:22 AM the next morning. Each of these events represents the inverter automatically taking the solar array offline because grid conditions had moved outside the range it is designed to tolerate — exactly the behavior Ellenbogen warned would become more disruptive as the system leans more heavily on inverter-based solar and battery resources.
Broader Consequences
Ellenbogen argued that the July 2–3 power quality problems reached well beyond his own property. He pointed to a Lohud report (also archived here) that documented a failure at the Yonkers sewage treatment plant coincident with the power issues on July 2 and 3, which released 39 million gallons of raw sewage into the Hudson River over a holiday weekend and forced cancellation of numerous river events because of the resulting pollution. He noted the irony that the state Department of Environmental Conservation (DEC) cited the plant for violating its discharge permit, while, in his view, DEC’s own permitting decisions blocking new generating capacity have contributed to the grid conditions that caused the failure in the first place. A county spokesperson quoted in the article said there had been no prior issues with the plant’s emergency generators, adding: “This situation never occurred before, but also we never had [Con Edison] dip the power like that before.”
Ellenbogen reported that the same voltage surges and dips damaged equipment at his own home — destroying surge suppressors on his battery backups, frying an elevator controller, and knocking out a communications module for his light switches, for roughly $1,450 in direct repair costs — and that neighbors in the area reported having to replace air conditioners damaged during the same period. He said that in 22 years in his home, he had never previously experienced power quality problems of this severity.
Conclusion
Rich Ellenbogen’s measured data provide ground-truth confirmation, at the level of an individual home and factory, of the system-wide stress that NYISO reported to its Operating Committee for this heat wave. Where NYISO’s presentation described unavailable generating capacity, thin operating reserves, and reliance on emergency demand response in aggregate terms, Ellenbogen’s voltage and frequency traces show what those conditions actually did to power quality on the Con Edison system: sustained under-voltage for tens of hours, a sharp voltage collapse and frequency excursion to roughly 47.5–47.65 Hz on the afternoon of July 3, and a cluster of inverter faults that took behind-the-meter solar offline at the exact moments the grid needed it most. He also noted that his electrical systems had worked for 23 years but this heat wave caused something new on the electric system that had adverse impacts.
His central point is one I share: a fleet of four-hour or eight-hour battery systems cannot bridge a 47- to 72-hour period of degraded grid conditions, and inverter-based resources — solar and batteries alike — are prone to disconnecting from the grid precisely when voltage and frequency swing outside their normal operating range, removing generation at the worst possible time. As New York leans more heavily on these technologies to meet Climate Act mandates, this event is a warning that deserves serious engineering attention rather than the political dismissal Ellenbogen believes it has received so far.


