On April 13 the New York Department of Environmental Conservation (DEC) announced that “the Municipal Zero-Emission Vehicle (ZEV) Infrastructure Grant Program has awarded over $8.3 million in funding to 70 municipalities to install electric vehicle charging stations for public use.” This post looks at the cost details included in this component of the Climate Leadership & Community Protection Act (Climate Act) net zero transition plan.
I have been following the Climate Act since it was first proposed. I submitted comments on the Climate Act implementation plan and written over 300 articles about New York’s net-zero transition because I believe the ambitions for a zero-emissions economy embodied in the Climate Act outstrip available renewable technology such that the net-zero transition will do more harm than good. The opinions expressed in this post do not reflect the position of any of my previous employers or any other company I have been associated with, these comments are mine alone.
Climate Act Background
The Climate Act established a New York “Net Zero” target (85% reduction and 15% offset of emissions) by 2050 and an interim 2030 target of a 40% reduction by 2030. The Climate Action Council is responsible for preparing the Scoping Plan that outlines how to “achieve the State’s bold clean energy and climate agenda.” In brief, that plan is to electrify everything possible and power the electric gride with zero-emissions generating resources by 2040. The Integration Analysis prepared by the New York State Energy Research and Development Authority (NYSERDA) and its consultants quantifies the impact of the electrification strategies. That material was used to write a Draft Scoping Plan. After a year-long review the Scoping Plan recommendations were finalized at the end of 2022. In 2023 the Scoping Plan recommendations are supposed to be implemented through regulation and legislation.
Municipal ZEV Infrastructure Grant Program
According to the program fact sheet grants are available to municipalities for the purchase and installation of electric vehicle supply equipment or hydrogen fuel cell filling station components available primarily for public use. There is a match of 0 to 20 percent of the total project cost requirement based, in part, on the median household income of the municipality.
The DEC announcement for the program awards said:
The Department of Environmental Conservation (DEC) Municipal Zero-Emission Vehicle (ZEV) Infrastructure Grant Program has awarded over $8.3 million in funding to 70 municipalities to install electric vehicle charging stations for public use. The transportation sector is the second-largest source of greenhouse gas emissions in New York, and these electric vehicle charging stations will help the state achieve the greenhouse gas emission reduction requirements under the Climate Leadership and Community Protection Act (Climate Act) and provide more opportunities across the state for electric vehicle drivers to charge.
The 2022 round of the ZEV Infrastructure Grant Program made 131 awards to 70 municipalities totaling $8.38 million toward the installation of 454 Level 2 charging ports and 28 direct current fast charger pedestals throughout New York State, the largest award amount since the program began. More than 42 percent of the grant funding was awarded for projects located in disadvantaged communities based on the draft criteria. The Climate Justice Working Group recently finalized criteria for disadvantaged communities that will ensure 35 percent, with a goal of 40 percent, of overall benefits of spending on clean energy and energy efficiency programs – one of several ways the Climate Act prioritizes climate justice.
See the press release for a list of all 2022 ZEV Infrastructure Grant awardees.
ZEV infrastructure grants are available to cities, towns, villages, and counties across New York under the DEC Municipal ZEV Program. The program also offers rebates for zero-emission fleet vehicles. The 2022 rebate awards for municipal zero-emission fleet vehicles were announced in December. Since its inception in 2016, the Municipal ZEV Program has awarded more than $16 million in rebates and grants (including this round) towards the purchase of 114 plug-in hybrid vehicles and 182 all-electric vehicles, 1,076 Level 2 charging ports, 44 fast charge pedestals, and three hydrogen fuel cell filling nozzles.
View the full list of all 2022 Municipal Zero-Emission Program award recipients (PDF).
More information about the DEC Municipal ZEV Infrastructure Grant Program, as well as Municipal ZEV Rebates, is available on DEC’s website.
This grant program is part of the Final Scoping Plan Chapter 11 – Transportation transition strategy. The following component describes what is proposed:
Invest in and remove barriers for ZEV charging and fueling infrastructure: To support the level of ZEV adoption anticipated by 2030, New York must quickly increase the number of EV charging stations and hydrogen filling stations in the State. New York should fund rebates or investment in EV charging stations and hydrogen filling stations, either directly through programs run by NYSERDA and/or NYPA or through market-based mechanisms like the clean transportation standard discussed below that would generate resources for ZEV infrastructure. All focus on investments in Disadvantaged Communities, programs in this area should focus on charging at multi-unit dwellings, on-street charging, and convenient urban fast charging, especially in areas with less access to home charging. Strategies should also prioritize fast charging along travel corridors, especially in rural areas, and support market segments that have been slow to attract private investment, including hydrogen fueling stations for appropriate applications. Through the National Electric Vehicle Infrastructure formula program, DOT will identify opportunities to support the creation of a safe, reliable, convenient, and equitable EV fast charging infrastructure network to allow EV drivers to reach interstate, regional, and long-distance destinations. DOS should incorporate EV charging into building codes to ensure new construction is EV-ready.
Program Numbers
I copied the data provided in the press release list of awardees and put the data into a table. The grants total $8.4 million and fund 462 level 2 chargers and 29 DCFC pedestals (“fast chargers”). The level 2 charger costs averaged $10,713 and ranged from $41,090 to $3,326. I think that reflects an economy of scale when a whole bank of chargers is installed. The DCFC chargers averaged $125,715 and ranged from $250,000 to $40,316. In the following I extrapolate these cost estimates to the total needed for the total net-zero transition.
In the strategy quoted above it states that “All focus on investments in Disadvantaged Communities, programs in this area should focus on charging at multi-unit dwellings, on-street charging, and convenient urban fast charging, especially in areas with less access to home charging.” What does providing LMI car owners in Disadvantaged Communities entail? I assume that it means Level 2 charging systems must be provided despite the suggestion that convenient fast charging is a focus. According to Kelley Blue Book EV charging stations: everything you need to know:
“In broad terms, Level 2 charging stations charge at about 6 kilowatts (kW) or a little higher and can add about 20 miles of range in an hour of charging at home or using a public charging station. DC fast chargers use high-voltage direct current to charge at 50 kW and up to 350 kW if the car can accept that rate. It’s not uncommon for EVs to gain 80% charge in about 30 minutes or less during quick charging.”
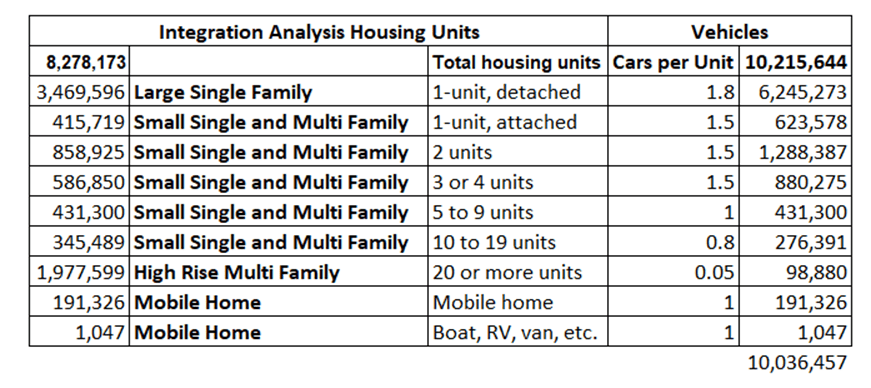
Not surprisingly there is insufficient detail in the Integration Analysis to determine how many Level 2 chargers are needed to fulfill this Scoping Plan target. I found that in the Open NY list of disadvantaged communities that the population distribution was 6,993,023 residents (36%) in disadvantaged communities and 12,579,296 in the other communities. According to the Integration Analysis there are 10,215,644 light duty vehicles in 2022. I assumed that the proportion of vehicles owned by residents in disadvantaged communities equals the total number of vehicles times 36% multiplied by an arbitrary 20% representing number of residents owning a vehicle to come up with an estimate of disadvantaged community vehicles: 729,993. I furthered assumed that one third of those vehicles will need a public charging station because they won’t have access to a private charger so 243,307 Level 2 chargers will be needed. At the average cost in the Municipal ZEV Infrastructure Grant Program awards, $2,607 million would be needed and even at the minimum cost $809 million would be needed just for Level 2 chargers.
I also made an estimate of the number of chargers needed throughout the state. The integration analysis lists the number of housing units for nine categories. I assumed the number of light duty vehicles (LDVs) per unit and calculated how many LDVs for each category.
In the next step I estimated the percentage of vehicles that would be charged at public charging stations for each residential category. For example, I assumed that no 1-unit detached homes would charge their electric vehicle at a public station but that 90% of the vehicles in high rise multi-family units would. I also estimated the percentage of level 2 chargers and DCFC chargers by housing unit type. The result was the number of level 2 and DCFC chargers that would be needed for residential public charging.
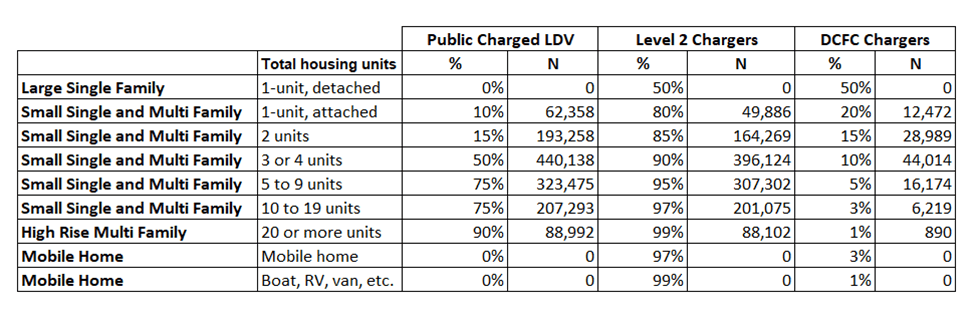
The number of charges was multiplied by the average and minimum cost for the Level 2 and DCFC systems to get a range of expected costs for public chargers based on the results of this announcement. I estimate that between $8.4 billion and $26.6 billion would be needed for residential public charging systems. Note that this does not include public charging systems for the traveling public or office parking lots.
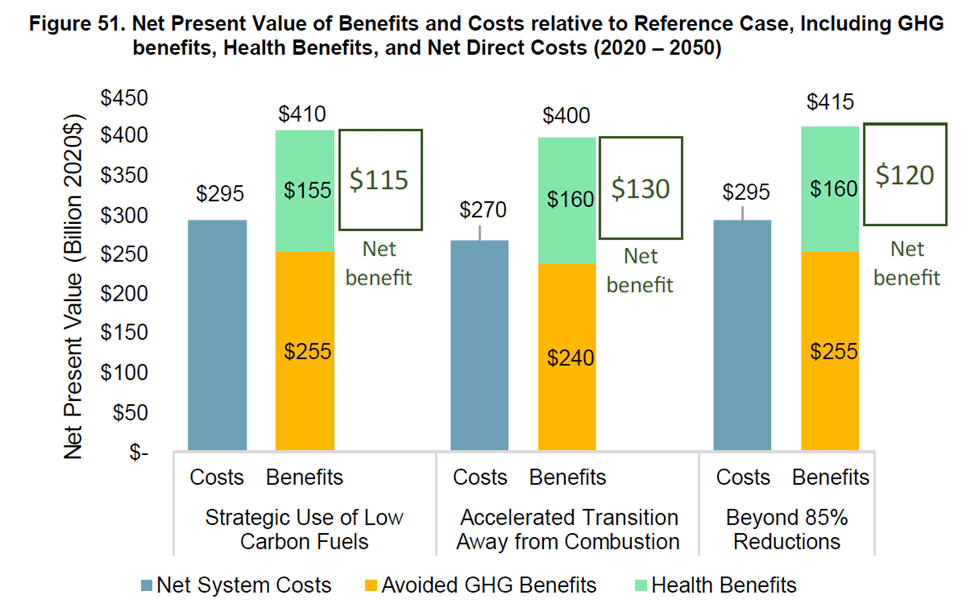
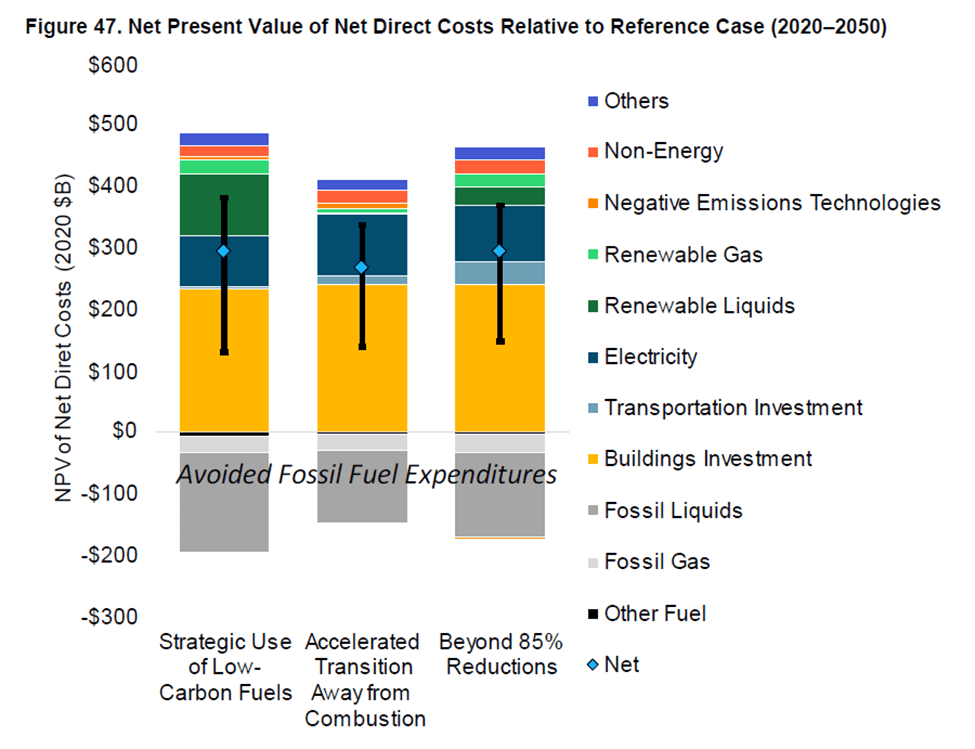
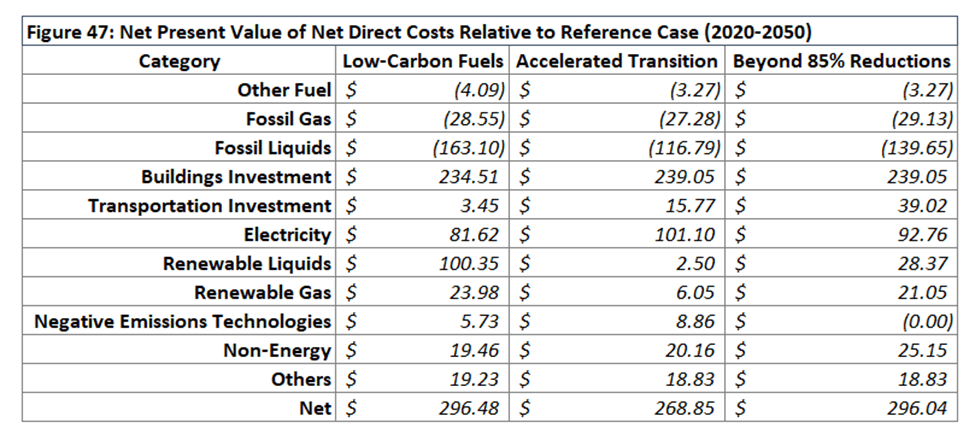
The Hochul Administration narrative is that the costs of inaction for the net zero Climate Act transition outweigh the costs of action but that statement is misleading unless the caveat that the costs in the Scoping Plan do not include the costs “already implemented” programs like the Municipal ZEV Infrastructure Grant Program. As far as I can tell the Integration Analysis did include the benefits of already implemented programs. In other words, the Administration claim does not include all the costs to transition to net-zero. According to the final scoping plan the societal benefits of the Climate Act net zero transition plan are greater than the costs by between $115 and $130 billion. Properly including this Grant Program as a necessary cost to get to meet the Climate Act mandates reduces the alleged benefits to between $89 and $122 billion. I believe that when all the other costs to electrify the transportation sector are included, the real costs will exceed the societal benefits.
Conclusion
Every component of the Climate Act that I have evaluated has turned out to be more complicated, the ease of transition more uncertain, and the costs greater than admitted in the Scoping Plan. In this example, the Scoping Plan does not differentiate or address the differences between home charging and the more complicated public charging requirements. The Scoping Plan suggests that implementation should “focus on charging at multi-unit dwellings, on-street charging, and convenient urban fast charging, especially in areas with less access to home charging” but does not acknowledge the uncertainties associated with finding the room for those assets. Finally, the Integration Analysis lists the cost for Light Duty Vehicle Battery Electric Vehicle Supply Equipment: Per-Vehicle Cost as $2,826 in 2022, but the minimum cost in the 2022 awards was $3,326 and the average cost was $10,713.
Given the complications, uncertainties and higher costs there is no way the Hochul Administration net-zero transition is going to work as glibly promised. For all the talk about inspiring other jurisdictions to follow New York’s lead and commit to the same GHG emission reductions targets the possibility that rushing ahead without addressing feasibility issues might end in a debacle that sets their cause back has been ignored. The Climate Act’s appeal to emotion and values rather than a rational energy policy is not going to end well for the state or their cause.