Last year I published an article describing the New York Independent System Operator (NYISO) Load & Capacity Data Report (also known as the “Gold Book”) and how I used it. This post uses the latest edition to determine the wind and solar capacity factors last year.
I have followed the Climate Act since it was first proposed, submitted comments on the Climate Act implementation plan, and have written over 400 articles about New York’s net-zero transition. The opinions expressed in this post do not reflect the position of any of my previous employers or any other organization I have been associated with, these comments are mine alone.
Overview
The Climate Act established a New York “Net Zero” target (85% reduction in GHG emissions and 15% offset of emissions) by 2050. It includes an interim 2030 reduction target of a 40% reduction by 2030 and a requirement that all electricity generated be “zero-emissions” by 2040. The Climate Action Council (CAC) was responsible for preparing the Scoping Plan that outlined how to “achieve the State’s bold clean energy and climate agenda.” In brief, that plan is to electrify everything possible using zero-emissions electricity. The Integration Analysis prepared by the New York State Energy Research and Development Authority (NYSERDA) and its consultants quantifies the impact of the electrification strategies. That material was used to develop the Draft Scoping Plan outline of strategies. After a year-long review, the Scoping Plan was finalized at the end of 2022. In 2023 the Scoping Plan recommendations were supposed to be implemented through regulation, PSC orders, and legislation. That process is falling behind as the enormity of the challenge becomes clearer.
Capacity Factor
The capacity factor is a useful metric to understand electric generation resources. The annual capacity factor for a generator equals the actual observed generation (MWh) divided by maximum possible generation (capacity in MW times the hours in a year). Projections for the amount of future wind and solar generation capacity needed for the Climate Act depend on capacity factor assumptions.
Not surprisingly, the aspirational schedule of the Climate Act has proven to be more difficult to implement than planned and many aspects of the transition are falling behind. Worse, there has not been any indication that the Scoping Plan is being refined to incorporate the lessons learned in the years since it was drafted or address any of the issues u raised in the comments. The capacity factor assumptions are a prime example of an issue that needs to be addressed.
Wind and Solar Capacity Factor Projections
I have previously summarized future resource projections. The New York Independent System Operator (NYISO) 2021-2040 System & Resource Outlook is part of the NYISO Comprehensive System Planning Process. That analysis included several scenarios for the future grid that includes capacity factor projections. The Integration Analysis also included several scenarios and capacity factor projections. In both instances the capacity factor projections determine how much wind and solar capacity will be needed in the future.
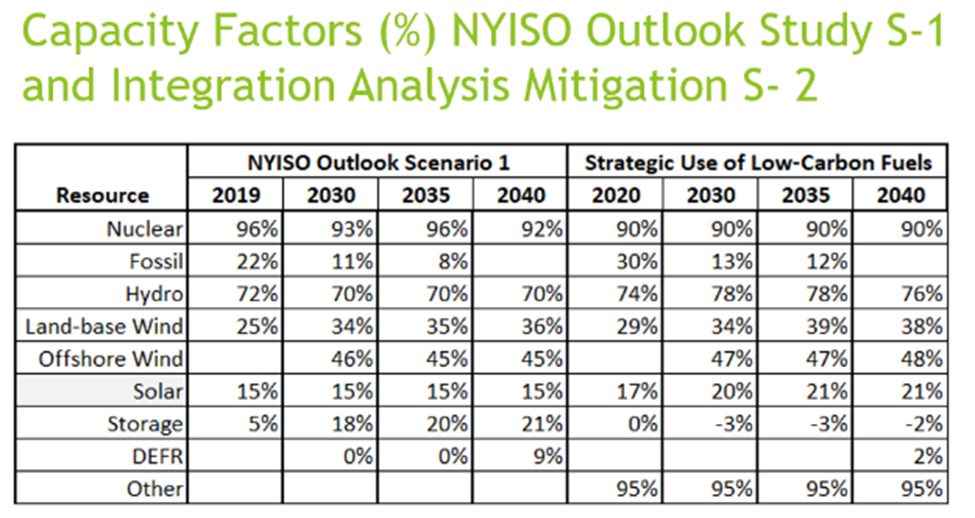
I am not the only one who submitted comments about the Scoping Plan capacity factors. I pointed out that the Integration Analysis land-based wind capacity factors were unrealistically high. The model projected the 2020 generation with a capacity factor of 29% but the 2021 observed capacity factor was only 22%. The Integration Analysis model could not even get the starting year correct. As a result, the Integration Analysis projections for the land-based wind capacity needed to meet the load are too low. It is particularly disturbing that the State has never attempted to reconcile the NYISO projections and assumptions with the Integration Analysis. For all renewable resources the Integration Analysis capacity factors are higher than the NYISO projections as shown below.
2023 Wind and Solar Observed Capacity Factors
The New York Independent System Operator (NYISO) 2024 Load & Capacity Data Report (also known as the “Gold Book”) is now available and has been posted on the NYISO website: 2024 Load & Capacity Data Report (Gold Book). Many of the most useful tables are also provided as spreadsheets. The following supplemental materials have also been posted:
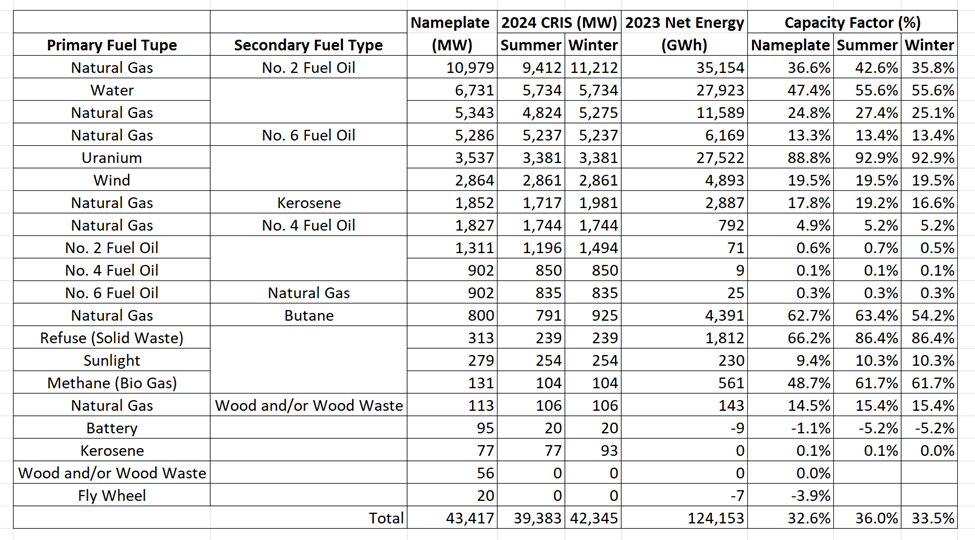
The Existing Generating Facilities spreadsheet was used to calculate New York capacity factors. The first table sums the capacities and net energy for all the combinations of primary fuel type and secondary fuel type for all the generators tracked by the NYISO. This includes units that are in the market system as well as others that are not. The nameplate capacity of generating units that use natural gas and can also burn number 2 fuel oil is the largest category in the state.
2024 NYISO Gold Book Tables III – 2a NYISO Market Generators and Table III – 2b Non-Market Generators 2023 Capacity, Energy, and Capacity Factors
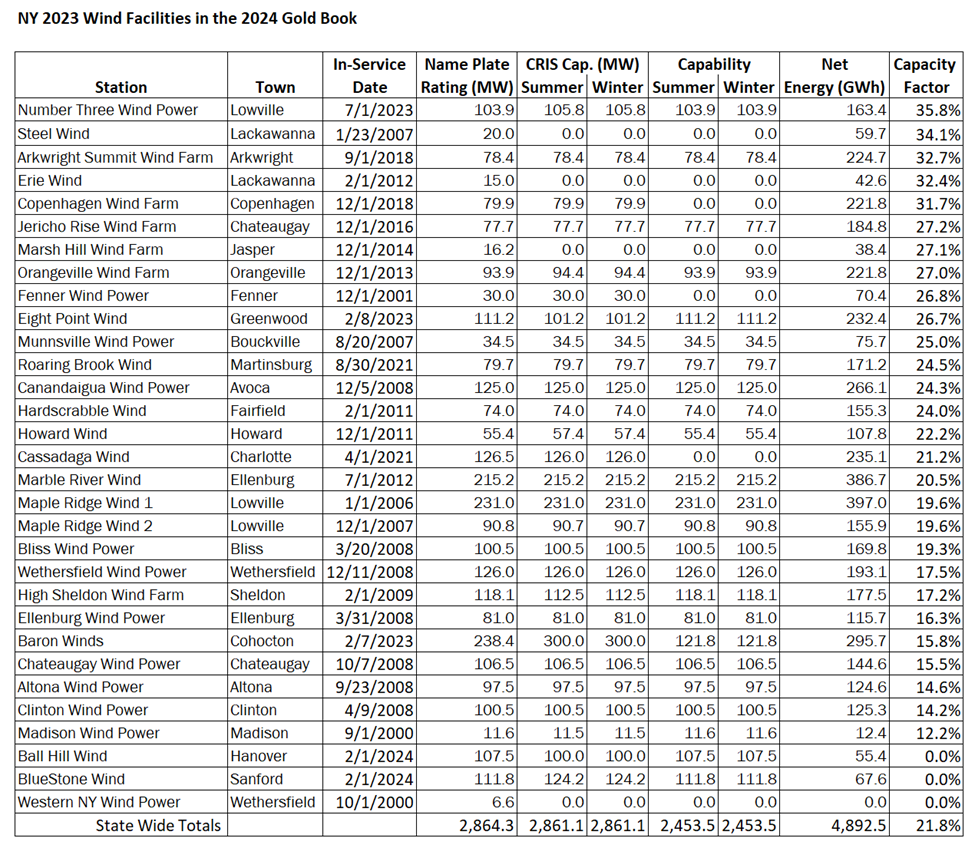
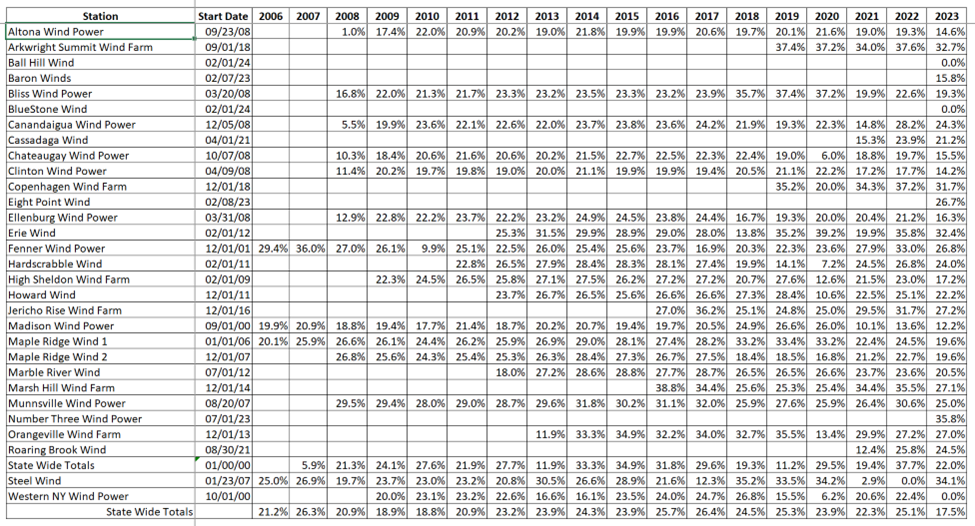
The next table lists the capacity data and net energy produced for the wind generating units in New York. Using that data, it is possible to calculate the capacity factors for each facility. The NYISO Resource Outlook and the Integration Analysis both assume a 34% capacity factor in 2030. Only two wind farms exceeded 34% and there were only three more that were over 30% capacity of the 31 wind farms in New York. The overall capacity factor was 21.8%. In order to achieve the assumed capacity factor for 2030 most of the existing wind farms will have to be replaced. The Integration Analysis does not retire any of the existing wind farms which I suspect is so that the cost estimate does not have to include those costs.
I have been tracking the wind farm capacity factors since 2006 as shown in the next table. There is nothing to suggest that 2023 was an abnormal year. In order to meet the 2030 projections these wind farms are going to have to be replaced or a large number of wind farms with much higher capacity factors that will bring the average up will have to be built. The data shown are also interesting as they show large interannual variation by site and the state overall. Finally note that the NYISO wind capacity factor for 2019 was modeled as 25% but the observed capacity factor was 22.3%. The Integration Analysis did not get their first year correct either. It modeled the 2020 capacity factor as 29% but the observed capacity factor was only 23.9%.
New York State Wind Facility Capacity Factors Based on NYISO “Gold Book” Load & Capacity Data Reports Table III-1
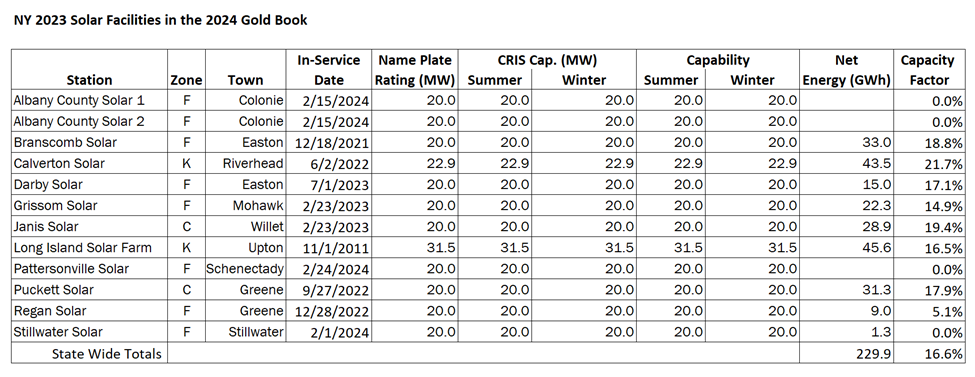
There is much less historical information available for solar facilities so only the 2023 data are presented. In 2023 the capacity factor of the solar facilities in New York was 16.8%, the highest capacity factor was 21.7% and the lowest credible capacity factor was 14.9%. The NYISO assumed a capacity factor of 15% from 2019 to 2040. On the other hand, the Integration Analysis assumed a capacity factor of 17% in 2020 increasing to 20% by 2030.
Discussion
The NYISO has interesting generation resource information available in its Gold Book. As shown here, that information can be used to calculate the capacity factors for wind and solar resources in New York. The annual capacity factors observed are consistently lower than the values used in the Integration Analysis which is being used to implement the state plan to meet the Climate Act mandates. As a result, The Scoping Plan is underpredicting the wind and solar resources necessary to generate the energy they project will be needed. That also means that their cost projections are too low.
It is troubling that the differences shown here between the NYISO capacity factors and the Integration Analysis capacity factors have not been reconciled. Worse, none of the differences between the two sets of projected resource projections have been addressed. This matters not only because the differences affect the projected outcomes and the costs, but also because Integration Analysis projections are being used for the New York Cap-and-Invest (NYCI) Program proposal. A key component of the NYCI plan is the trajectory for allowance allocations. NYCI’s reduction trajectory is based on the Integration Analysis and the overly optimistic capacity factors used means that they are projecting lower emissions than is likely to occur. That imbalance could have significant consequences to the allowance market.
One other point is that these are annual metrics. In order to assure that the electric grid will be able to provide energy when it is needed the most the NYISO must deal with resource availability over shorter periods. Think of it as the capacity factor over the coldest week of the year. That is a much more difficult issue and one that the Scoping Plan has not addressed.
Conclusion
This post documents the most recent wind and solar capacity factors observed in New York. It is notable that the wind data show a lot of interannual variation that should be considered when projecting future resource availability. These data have not been incorporated into an updated analysis of the generating resources needed to achieve the Climate Act goals.
I have long argued that the State’s plans for implementing the Climate Act mandates must include a feasibility study that could address the observed variability and lower capacity factors. Given the tremendous uncertainties like these shown here, I have recently decided that a feasibility study is not enough. No jurisdiction anywhere has successfully demonstrated an electric grid that depends on wind and solar to the extent that the Scoping Plan does. Before New York goes any further it should prove it can be done with a demonstration project. Anything less risks catastrophic blackouts and enormous costs.
Note: This documents all the slides in the Grid Planning to Meet Climate Act Goal presentation. I also prepared a summary of the material in this post.
In order to meet the Climate Leadership & Community Protection Act (Climate Act) mandates for a zero-emissions electric grid by 2040 a massive effort to deploy wind, solar, and energy storage resources and an enormous upgrade to the electric transmission system is needed. I have previously described issues associated with generating portion of this transition. This post documents the Alliance for Clean Energy New York (ACENY) webinar “Grid Planning to Meet Climate Act Goals” that addressed the transmission challenges in a lot of detail. A summary is also available.
I have followed the Climate Act since it was first proposed, submitted comments on the Climate Act implementation plan, and have written over 400 articles about New York’s net-zero transition. The opinions expressed in this post do not reflect the position of any of my previous employers or any other organization I have been associated with, these comments are mine alone.
Overview
The Climate Act established a New York “Net Zero” target (85% reduction in GHG emissions and 15% offset of emissions) by 2050. It includes an interim 2030 reduction target of a 40% reduction by 2030 and a requirement that all electricity generated be “zero-emissions” by 2040. The Climate Action Council (CAC) was responsible for preparing the Scoping Plan that outlined how to “achieve the State’s bold clean energy and climate agenda.” In brief, that plan is to electrify everything possible using zero-emissions electricity. The Integration Analysis prepared by the New York State Energy Research and Development Authority (NYSERDA) and its consultants quantifies the impact of the electrification strategies. That material was used to develop the Draft Scoping Plan outline of strategies. After a year-long review, the Scoping Plan was finalized at the end of 2022. In 2023 the Scoping Plan recommendations were supposed to be implemented through regulation, PSC orders, and legislation. Not surprisingly, the aspirational schedule of the Climate Act has proven to be more difficult to implement than planned and many aspects of the transition are falling behind.
ACENY Webinar
On April 11, 2024, Alliance for Clean Energy New York (ACENY) hosted a webinar entitled “Grid Planning to Meet Climate Act Goals” that was recorded on a video. The webinar was moderated by Chris Casey, from the NRDC and featured speakers from the Department of Public Service (DPS), New York Independent System Operator (NYISO), and National Grid. This article describes each speakers presentation and provides links to sections of the video so that readers can follow the presentations.
Chris Casey, a lawyer from the NRDC opened the webinar with an overview. It was not surprising that his Chris Casey, a lawyer from the NRDC opened the webinar with an overview. It was not surprising that his introduction ticked all the boxes. New York is on the “forefront of the transition to address the “impacts of destructive climate change”, increase access to “affordable” renewable energy, bolster “resilience against life-threatening extreme energy events”, all while “creating jobs and delivering substantial economic benefits”. Behind the rhetoric, however, reality lurks, and it does not look so grand. In the following sections I include slides and links to the section of the video that discusses the slide.
DPS Presentation
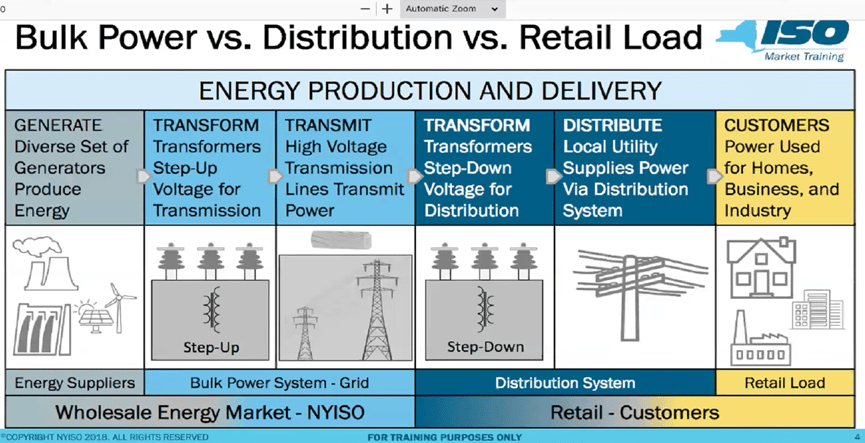
Elizabeth Grisaru (Senior Policy Advisor) from the DPS made the first presentation “Planning for Future Electric System Needs”. One of her main job responsibilities is transmission planning associated with the Climate Act transition. During her introduction she included a slide that illustrates the connections between generators and customers that were the focus of the webinar.
The “Impact of Climate Objectives” slide describes the general issues associated with the transition.
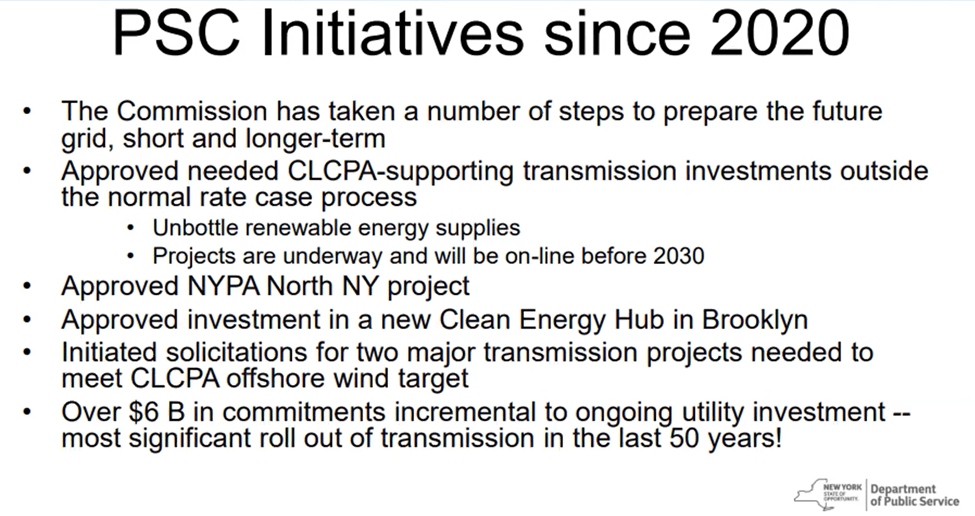
The description of the slide “PSC Initiatives since 2020” outlined projects costing over $6 billion that are over and above what is needed to keep the system running. The investments are for both Climate Act needs and reliability issues. What was not included was the breakdown between the two needs or any estimate of how much more will be needed. It is clear that many more investments will be required.
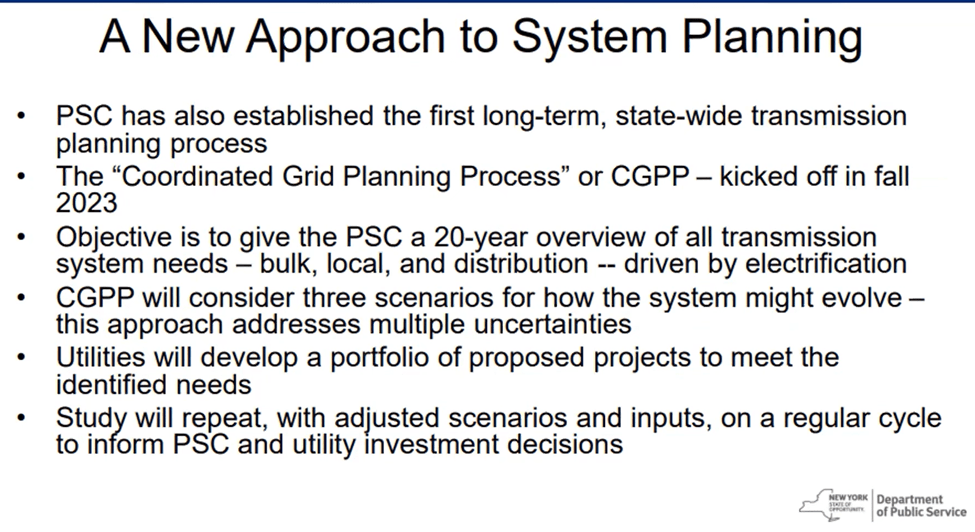
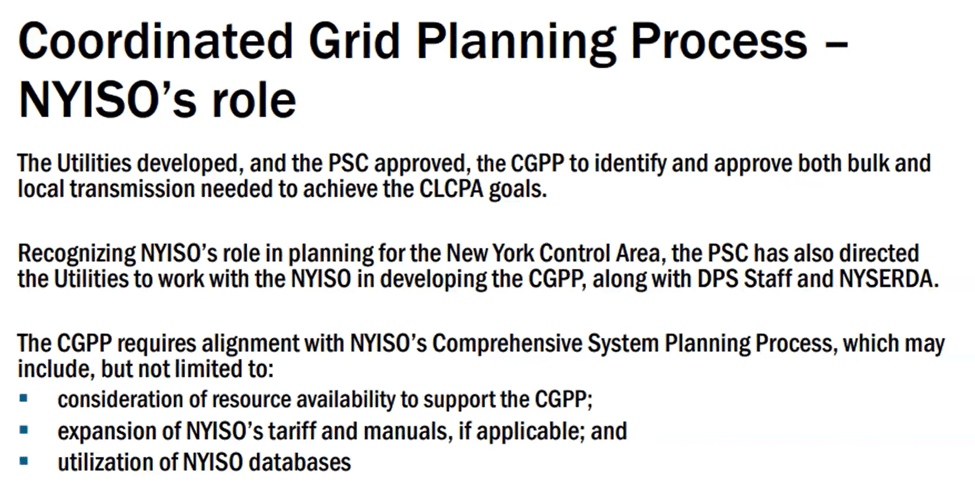
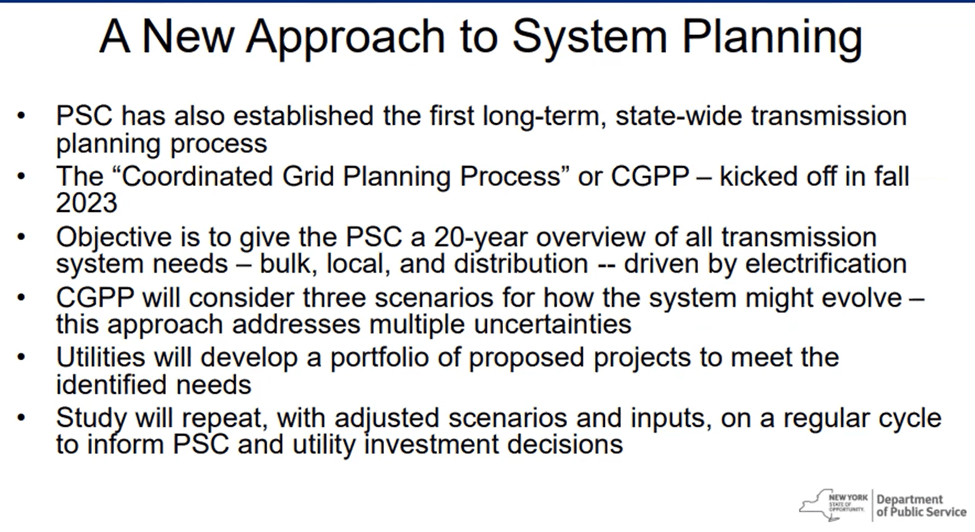
The transition to an electric system that depends upon diffuse wind and solar requires a significant upgrade to the transmission system. The PSC has a new “Coordinated Grid Planning Process” to address this issue.
Note, however, that the first of the new CGPP reports is not going to be available until the Fall of 2025. It is not clear if the CGPP is going to help at all to meet the 2030 target.
The DPS final slide addresses outstanding issues. On one hand existing sources of generation are being forced to retire while on the other hand electrification initiatives are increasing loads. She claimed that at the PSC “We all agree reliability is the most important thing we have to worry about”.
NYISO Presentation
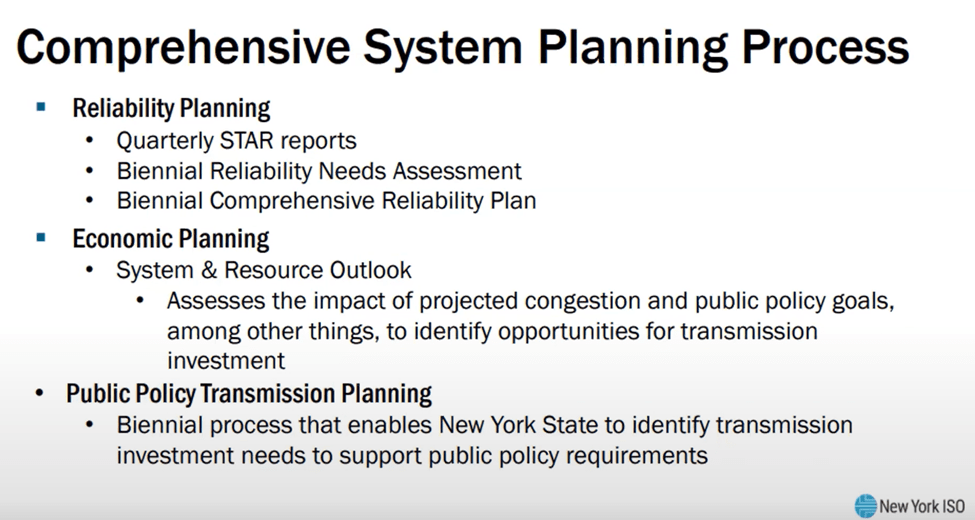
NYISO Director of System Planning Yachi Lin talked about their plans to implement a clean and reliable grid. Her introductory explanation gave a good overview of the NYISO. The following slide describes the planning process. There is a two-year cycle of reliability planning that includes quarterly checks on the status of the system.
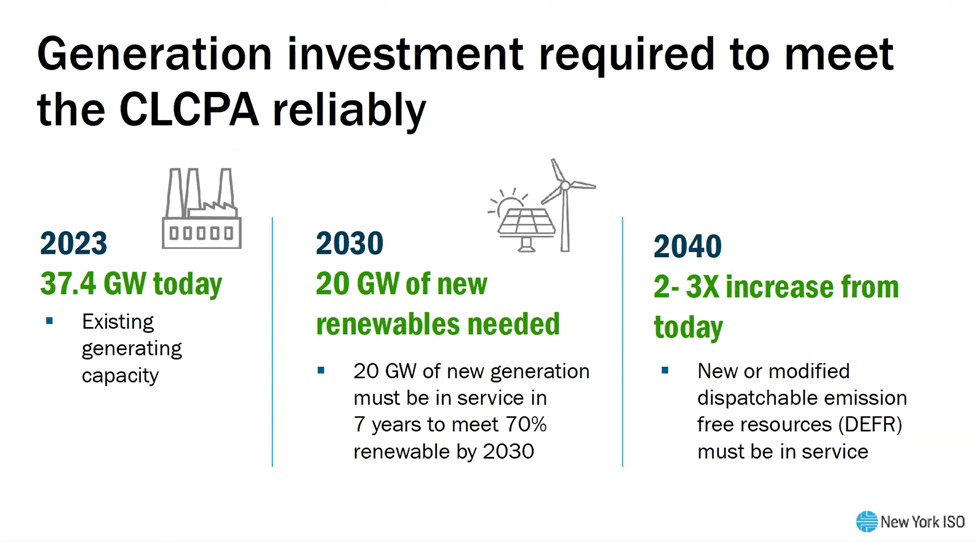
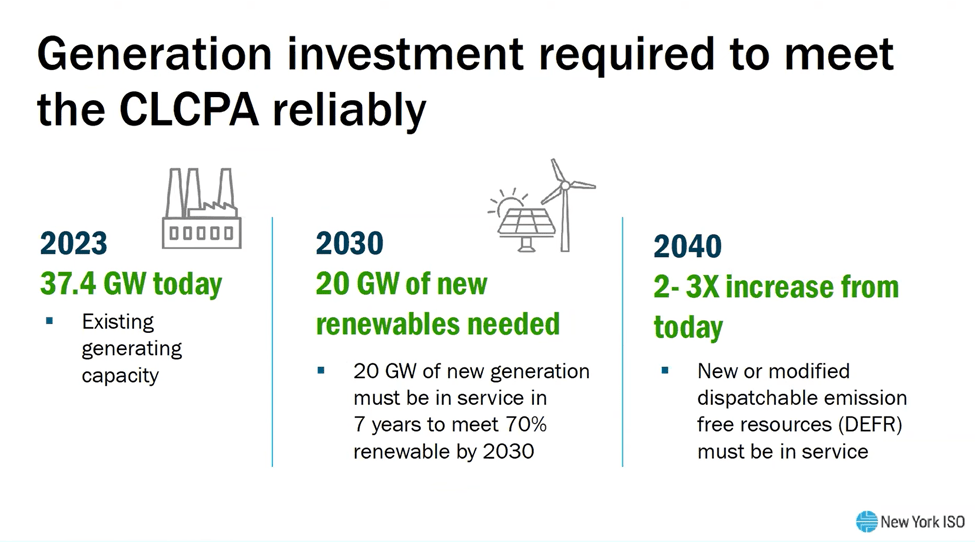
The following slide describes the generation system and the investments expected to be needed. Existing generating capacity is 37.4 GW, but an additional 20 GW must be in service in seven years to meet the 2030 goal. The unanswered question was whether this is feasible.
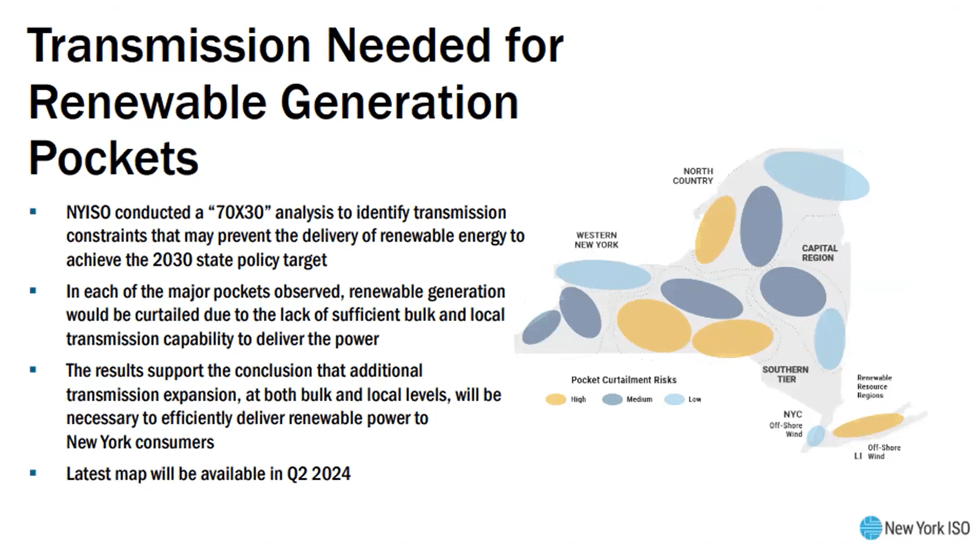
Lin explained that additional transmission is needed to meet the 2030 70% renewable energy goal. The following slide shows different areas of the state that do not have adequate transmission capabilities to prevent curtailments.
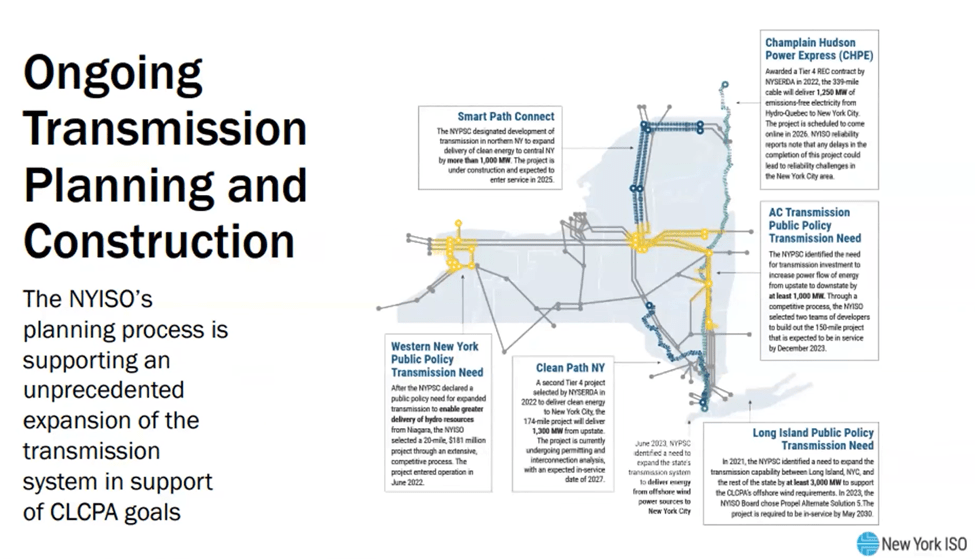
To respond to the need for additional transmission the NYISO planning process is supporting “unprecedented expansion”.
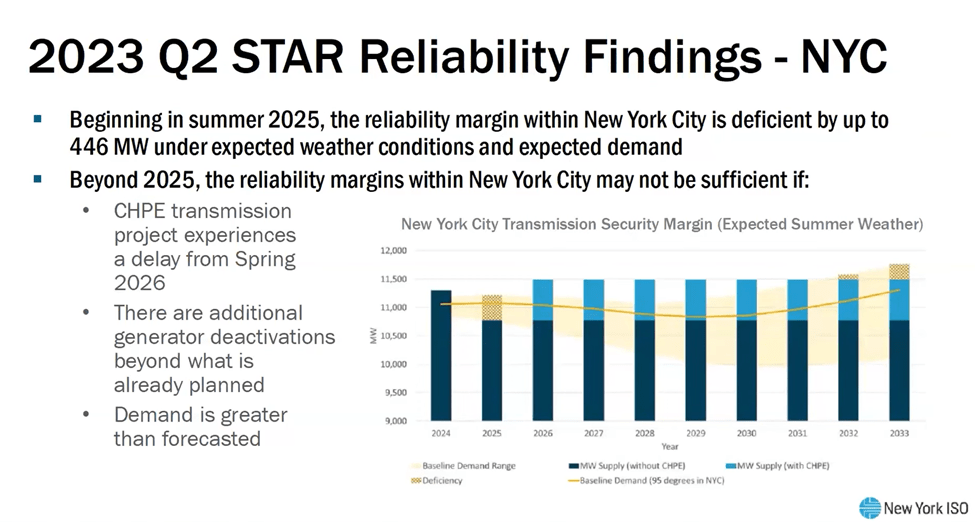
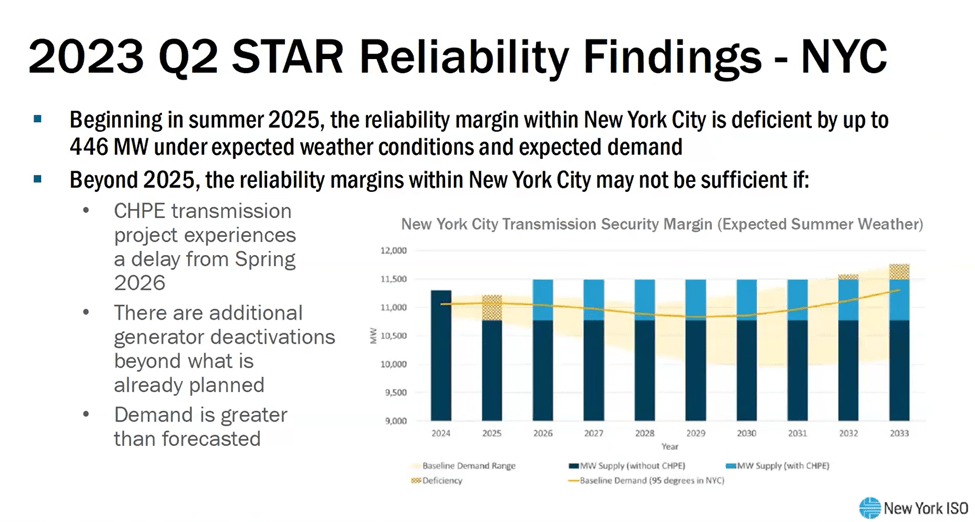
The quarterly Short-Term Assessment of Reliability (STAR) reports should be required reading for anyone interested in the New York electric system so Lin’s explanation is important. The following slide notes that last years second quarter report noted that there was a reliability deficit of 446 MW in the summer of 2025. The deficit was projected because of fossil unit deactivations. In response, NYISO opened a solicitation for market solutions or regulatory solutions. No feasible market solution was submitted.
To maintain reliability, NYISO had to resort to a regulatory solution. They designated two peaking generation plants as reliability needs and postponed their retirement for two years. The NY Department of Environmental Conservation “Peaker Rule” incorporates this provision and there is a potential for an additional two-year extension. If the Champlain Hudson Power Express transmission project is delayed beyond 2026 the additional extension might be required.
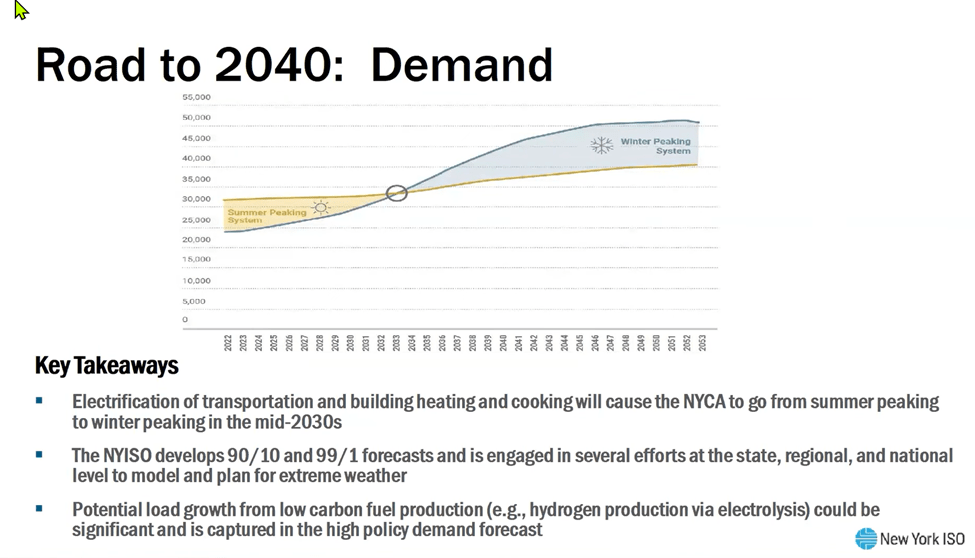
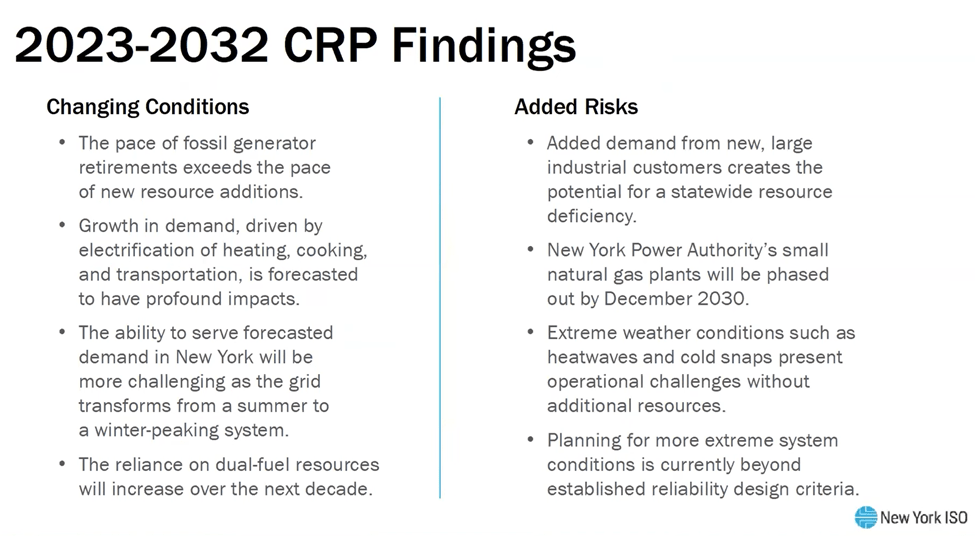
The Comprehensive Reliability Planning report incorporates changes associated with demand growth. In the following slide NYISO describes expected changes. As mentioned previously, fossil generator retirements and growth in demand are primary changes to the system. Part of the load demand shift changes the peak loads from summer to winter. This is troublesome because the winter diurnal peak will occur when there is no solar. She also mentioned the dual-fuel units. Many New York generating units normally burn natural gas because it is cheaper but have the capability to switch to oil firing when natural gas is needed by residential consumers. The increased reliance on these units which at the same time are targeted for retirement is a problem. The CRP analysis also identified added risks. The addition of the Micron chip fab plant near Syracuse will add load equivalent to the total load of Vermont and New Hampshire. The New York Power Authority operates small natural gas plants in New York City that are supposed to be phased out by December 2030 due to political pressure. Lin had to make the obligatory gesture to climate change extreme weather as a risk. Finally, the shift to a weather-dependent generating system mans that reliability design criteria need to be revised to account for extreme weather conditions outside current planning horizons.
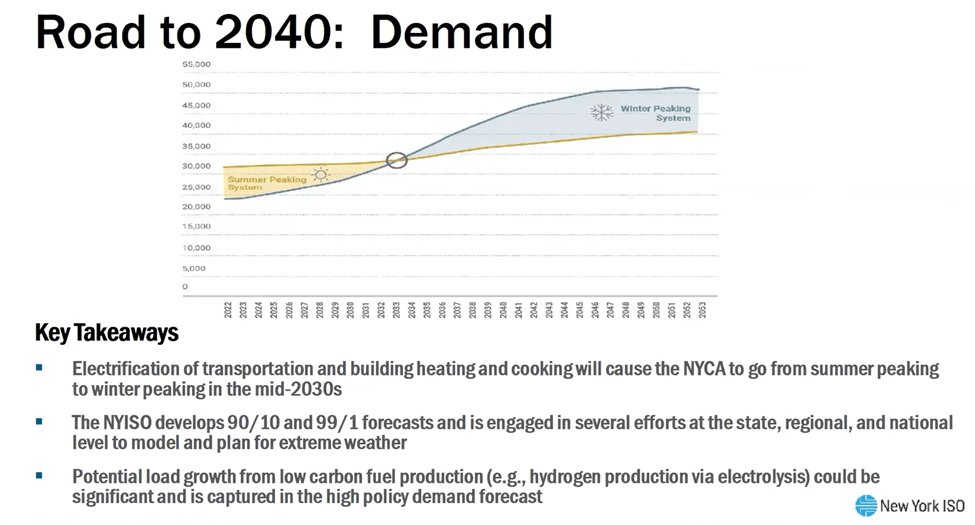
The next four slides summarize the challenges to meet the 2040 Climate Act mandate for a “zero-emissions” electric grid. The next slide repeats the points raised in the previous slide. Lin remarked that the year of the cross over from summer to winter peaking can only be guessed at this time. Depending on the trends in load it could be almost anytime in the next decade. The 90/10 and 99/1 forecasts are probability estimates for the likelihood of extreme weather events. The final bullet in the slide points out that there could be substantial load growth needed to provide reliability services. The NYISO includes a high load policy case that incorporates this load.
The next slide lists the challenges on the generation side. Lin makes the point that generation issues extend beyond simply evaluating the capacity needed to match the load projections. Wind, solar, and energy storage are inverter-based resources that require ancillary service support to make the transmissions system reliable. Weak-grid interconnection and common mode failures are issues that most people, including me, do not understand well. The key point is that all the people that I know understand these issues are worried but there was never any indication of concern by the Climate Action Council. Consequently, the Scoping Plan outline produced by the Hochul Administration to guide the energy transition is incomplete. Lin makes the little recognized point that the Dispatchable Emissions Free Resources are not needed just for the long periods of low renewable resource availability but also to provide these ancillary services.
The next slide addresses DEFR specifically. I will not discuss this much because I covered the Department of Public Service (DPS) two-day technical conference last December that focused on characterization of the potential “gap” caused by low renewable energy resource availability over long periods of time. I mentioned but did not emphasize the importance of providing the “reliability attributes of retired synchronous generation”.
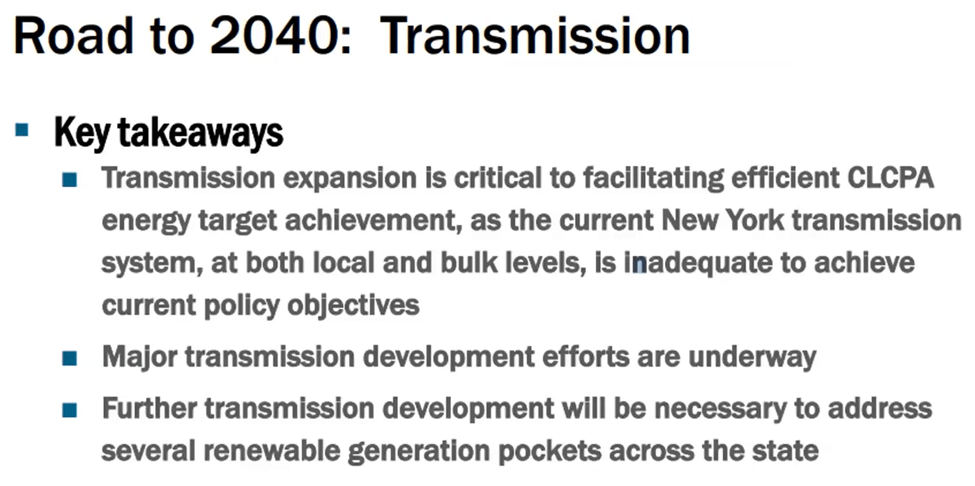
The focus of this webinar was on the transmission challenges as covered in the following slide. Lin explained that transmission expansion is required to get the diffuse wind and solar energy from where it is collected to where it is needed. The existing system is not adequate for this task.
In the next slide Lin explained how the NYISO is working with the PSC to identify the needed bulk and local transmission needed.
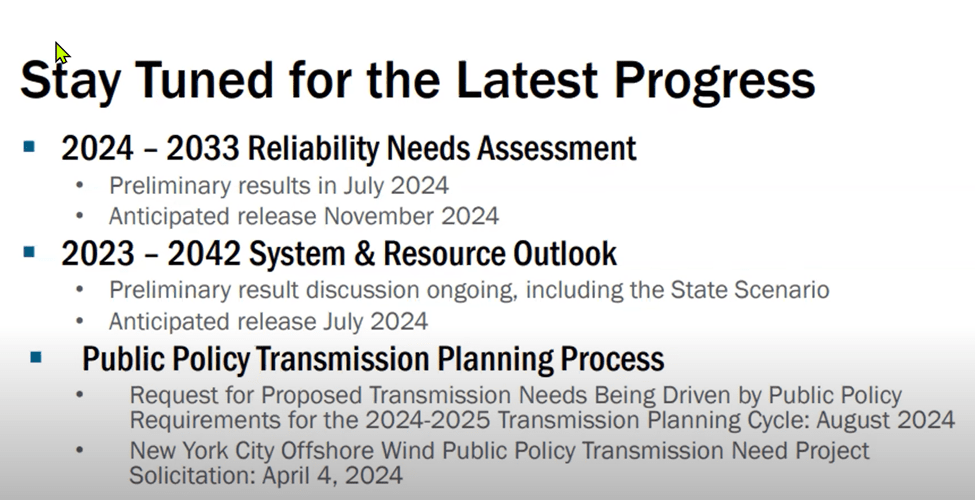
The final slide in Lin’s presentation presented the planning process expected progress. There is an enormous amount of work underway but the analysts have a big challenge dealing with changes in the development of resources. As noted earlier, the 2026 expectation is that the Champlain Hudson Power Express project will be online. Even after years of development work the right of way is still not fully permitted and there are numerous examples of supply chain issues delaying other projects so the planning process is subject to massive uncertainty.
National Grid Presentation
Brad Franey Vice President Clean Energy Development explained how National Grid is addressing the need for transmission support. As he points out the utilities receive funding for their transmission and distribution (T&D) system investments from rate cases. Those rate cases are, in no small part, influenced by politics. As a result, none of New York’s utility companies are going to overtly challenge the political narrative that the Climate Act objectives can be achieved on schedules mandated by the law. The following slide probably went through multiple iterations to achieve a description of plans that checks all the boxes for what the company thinks that the politicians want to hear.
I live in Upstate New York so I was particularly interested in the “Upstate Upgrade” described in the following slide. The following slide rationalizes the costs for the upgrades to over 1,000 miles of lines. In his description Franey gave the example of a town that attracts snow mobile tourists in the winter. The last two years there have been snow droughts because they “no longer have the snow like they used to.” Construction of a line nearby brought in a lot of business and locals said that those saved businesses. The entire slide is devoted to the mantra that the Climate Act will create jobs and investments. Last year I described the DPS rulemaking that foisted these projects on the Upstate ratepayers. This slide avoids the things I found: National Grid residential ratepayers will see their bills increase 3.8%, the fact that these upgrades are needed to get renewable energy to Downstate so don’t benefit the ratepayers directly, or that the percentage increase for upstate ratepayers will be greater than the increase for ratepayers who directly benefit from the investments.
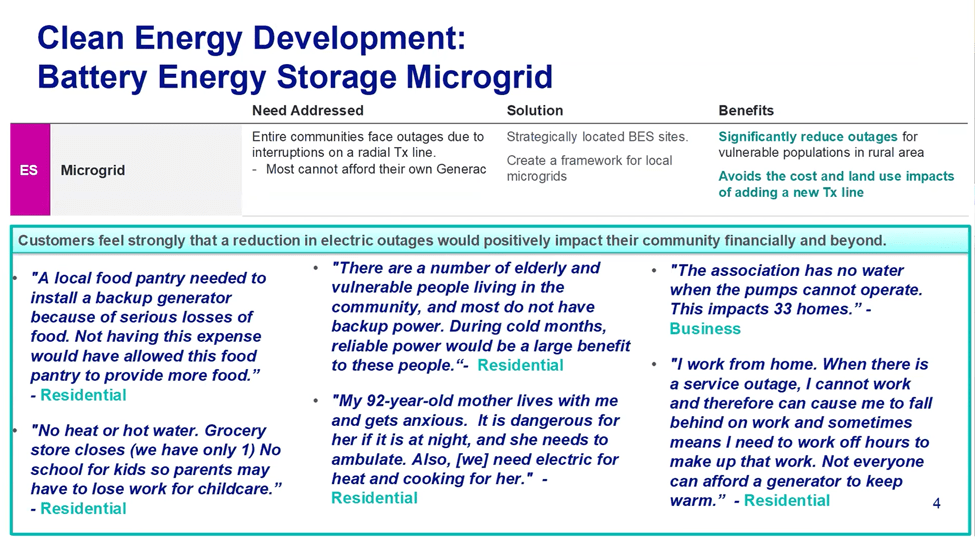
The next slide gives an example of their proposed reliability solutions. He included the obligatory argument that we are seeing more “frequent storms” that ignores the differences between weather and climate. He went on to give examples where a reduction in outages would positively impact their community. The proposed solution is a microgrid with battery energy storage. In my opinion, however, this is another example of a clean energy solution that works well most of the time but will fail when needed most. The problem here is the specification for battery storage. In the future New York system when home heating and transportation are both electrified the worst case will be an extended outage due to an extreme weather event like an ice storm. Specifying the battery storage for an ice storm event that occurs every 20 years will probably be too costly but when the inevitable ice storm does occur everyone in the microgrid will be at extreme risk because the energy storage system will run out of power. Fossil fuels are energy dense and can be stored making them much better for emergency backup.
Another initiative that National Grid is starting to support is public charging. Again ratepayers get to pick up the tab for something that most will not use and don’t ever want to use. Their analysis indicates that the load at the service plazas along the thruway could go up to 20 to 40 MW which is the same load as “a small town or major sports stadium.” In order to provide that load they need to upgrade the local infrastructure. They are planning to use mobile energy storage along the Thruway until infrastructure is developed. This bridge to wires solution is a pragmatic approach given the likely futility of heavy duty electric trucks.
The latest rate case included funding for smart meters. Franey describes this initiative in the next slide. Ostensibly this is supposed to help consumers better understand their energy use and facilitate outage response but the ability to try to reduce peak loads either through rate mechanisms or eventually managing electric use are certainly on the table.
Questions and Answers
The question and answer portion of the webinar was interesting. The first question asked was “Is reliability a prerequisite for everything else or is it co-equal with our policy objectives?” I have heard suggestions that policy objectives should be considered more than they are currently but anyone hoping to hear that there have been changes to protections in place to make sure that our policies don’t get ahead of reliability would have been disappointed in the answers. Elizabeth Grisaru from the DPS made it clear that reliability comes first, that there are “off ramps” for the implementation schedule and that the PSC will not let our zeal for meeting de-carbonization goals get out in front of reliability. Yachi Lin from the NYISO emphasized the point that they are constantly evaluating reliability. The quarterly Short term assessment of reliability and the longer term reliability needs assessment both address it. She admitted that we are going to have outages because the network is not built to be 100% risk-free or outage free. The alternative it “gold plating the system” which we cannot afford.
The next question asked about interconnections when the grid is not ready to take new renewables. How does that come into play and how will this be alleviated? Grisaru from the DPS acknowledged that if the system is not ready then developer has to pay for interconnection upgrades. They are trying to address this but it takes time. Franey from National Grid said that they are working on the issue but reliability has to be maintained.
There was a question about the different planning cycles. I think this question came before the NYISO described their processes. Grisaru from the DPS explained that the Coordinated Grip Plan Process is supposed to put it all together. Liu from NYISO explained that constant planning is responding to continual changes to the system. Every new development changes some aspect of the T&D system in some way.
The panel responded to the question how does the public policy planning processes differ. Grisaru explained that when the DPS sees a need on the bulk transmission system they contact the NYISO to start a process to look for a solution. The NYISO system outlook can also identify bulk transmission requirements.
A question about longer planning processes planning and deployment timing was also addressed. Liu explained that the NYISO resource adequacy process identifies risk factors and the timelines to develop the responses. Franey explained that the building component is the fastest but still takes years. The process has to determine what is needed and where before the planning permitting, and construction plans can be developed. Only when all that is done can construction begin but there are procurement and supply chain issues that also have to be addressed.
How can the state policies that affect energy use affect transmission planning. Climate activists are proponents of smart grids, energy efficiency, and other technologies that reduce energy use as a way to minimize the need for transmission development. In response, Grisaru explained that non-wires solution have been used for a long time and is incorporated into the Coordinated Grip Plan Process. The problem is that the de-carbonization transformation is going to require transmission solutions. Franey explained that urban city electrification (bringing rural diffuse renewables to the cities) is going to be the next challenge,
Discussion
My impression of the speakers at this meeting is that they were desperately trying to make the point that the transmission challenges for the Climate Act mandates and schedule were impossible goals without actually saying that. I believe that all the technical people who really understand the electric grid in the DPS, NYISO and the electric companies are being held hostage to the political narrative that “All is well”. That did not work out for Kevin Bacon in Animal House and it won’t work out here either.
The transmission challenges are different than the generation challenges. While it may not be necessary to develop and deploy a not yet commercially available technology like the generation sector to make this all work there still are inverter-based resource integration issues that need to be resolved. I have the utmost respect for the electric system engineers, but I fear that they will be hit by unanticipated combinations of conditions that they could not foresee. The result will be blackouts.
In my opinion the bigger problem is the scale of the transmission upgrades and additions needed. New York has already committed to $6 billion to start “unbottling” renewable resources which is code in New York for Upstate utilities paying for support for New York City access to renewables. New York also has plans for three major bulk transmission projects to get hydroelectric power from Quebec, another to collect the energy from part of Upstate to New York City, and the third to start the process of connecting the expected 9 GW of offshore wind into the grid. Nobody has admitted to the total costs.
The other New York problem that I suspect is common elsewhere is that the politicians who enacted these net-zero laws were more concerned with the optics of aspirational timelines and not the feasibility of those schedules. A question about longer planning processes planning and deployment timing made the point that the NYISO resource adequacy process that identifies specific need for transmission development, New York’s de-regulated market process to propose, bid, and choose the development, and the project planning, permitting, and construction plans development which all need to be completed before construction can begin takes a lot of time. Reading between the lines all the speakers are highly skeptical that the artificial deadlines of the Climate Act can be achieved.
One final point not addressed in the webinar but certainly affecting the viability of New York’s energy transition goal is the decarbonization of heating and transportation. That is going to require a complete rewiring of the distribution network.
Conclusion
The magnitude, costs, and technical challenges of the generation and transmission electric grid transition ensure that that there is no question that New York will hit the Green Energy Wall. The Hochul Administration has not provided a feasibility analysis that includes the expected costs, ensures that current reliability standards can be maintained, and documents the cumulative environmental impacts of the generation resources and the transmission and distribution deployments for the electric system to meet the 2030 70% renewable energy mandate. The fact that no jurisdiction anywhere has developed a system that depends on wind and solar as in the proposed New York system suggests that a proof of concept demonstration is appropriate.
Note: This is a summary of the presentation that is a version of a post at Watts Up With That. In order to prepare the summary, I documented all the slides and made that into another post.
In order to meet the Climate Leadership & Community Protection Act (Climate Act) mandates for a zero-emissions electric grid by 2040 a massive effort to deploy wind, solar, and energy storage resources and an enormous upgrade to the electric transmission system is needed. I have previously described issues associated with generating portion of this transition. This post summarizes the Alliance for Clean Energy New York (ACENY) webinar “Grid Planning to Meet Climate Act Goals” that addressed the transmission challenges in a lot of detail.
I have followed the Climate Act since it was first proposed, submitted comments on the Climate Act implementation plan, and have written over 400 articles about New York’s net-zero transition. The opinions expressed in this post do not reflect the position of any of my previous employers or any other organization I have been associated with, these comments are mine alone.
Overview
The Climate Act established a New York “Net Zero” target (85% reduction in GHG emissions and 15% offset of emissions) by 2050. It includes an interim 2030 reduction target of a 40% reduction by 2030 and a requirement that all electricity generated be “zero-emissions” by 2040. The Climate Action Council (CAC) was responsible for preparing the Scoping Plan that outlined how to “achieve the State’s bold clean energy and climate agenda.” In brief, that plan is to electrify everything possible using zero-emissions electricity. The Integration Analysis prepared by the New York State Energy Research and Development Authority (NYSERDA) and its consultants quantifies the impact of the electrification strategies. That material was used to develop the Draft Scoping Plan outline of strategies. After a year-long review, the Scoping Plan was finalized at the end of 2022. In 2023 the Scoping Plan recommendations were supposed to be implemented through regulation, PSC orders, and legislation. Not surprisingly, the aspirational schedule of the Climate Act has proven to be more difficult to implement than planned and many aspects of the transition are falling behind.
ACENY Webinar
On April 11, 2024, the Alliance for Clean Energy New York (ACENY) hosted a webinar entitled “Grid Planning to Meet Climate Act Goals” that was recorded on a video. The webinar was moderated by Chris Casey, from the Natural Resources Defense Council (NRDC) and featured speakers from the Department of Public Service (DPS), New York Independent System Operator (NYISO), and National Grid. This article describes each speaker’s presentation and provides links to sections of the video so that readers can follow the presentations.
Chris Casey, a lawyer from the NRDC opened the webinar with an overview. It was not surprising that his introduction ticked all the boxes. New York is on the “forefront of the transition to address the “impacts of destructive climate change”, increase access to “affordable” renewable energy, bolster “resilience against life-threatening extreme energy events”, all while “creating jobs and delivering substantial economic benefits”. Behind the rhetoric, however, reality lurks, and it does not look so grand. In the following sections I include slides and links to the section of the video that discusses the slide.
DPS Presentation
Elizabeth Grisaru (Senior Policy Advisor) from the DPS made the first presentation “Planning for Future Electric System Needs”. One of her main job responsibilities is transmission planning associated with the Climate Act transition. During her introduction she included a slide that illustrates the connections between generators and customers that were the focus of the webinar.
Since the inception of the Climate Act, DPS has begun several initiatives. These projects total $6 billion over and above what is needed to keep the system running. The investments are for both Climate Act needs and reliability issues. What was not included was the breakdown between the two needs or any estimate of how much more will be needed. Clearly many more investments will be required.
The transition to an electric system that depends upon diffuse wind and solar requires a significant upgrade to the transmission system. The PSC has a new “Coordinated Grid Planning Process” to address this issue. However, the first report will not be available until the fall of 2025. The Climate Act an interim 2030 electric grid target of 70% power from renewable sources by 2030 and a requirement that all electricity generated be “zero-emissions” by 2040. I have to say I don’t think the schedules match.
The DPS final slide addresses outstanding issues. On one hand existing sources of generation are being forced to retire while on the other hand electrification initiatives are increasing loads. Grisaru claimed that at the PSC “We all agree reliability is the most important thing we have to worry about”.
NYISO Presentation
NYISO Director of System Planning Yachi Lin talked about their plans to implement a clean and reliable grid. The following slide describes the NYISO planning process. There is a two-year cycle of reliability planning that includes quarterly checks on the status of the system. NYISO is constantly evaluating future reliability needs.
The following slide describes the generation system and the investments expected to be needed. Existing generating capacity is 37.4 GW, but an additional 20 GW must be in service in seven years to meet the 2030 goal. Note that the feasibility question has been studiously avoided by the state and the NYISO and utility companies have not overtly called the aspirational schedule out as impractical.
Lin explained that additional transmission is needed to meet the 2030 70% renewable energy goal. There are different areas of the state that do not have adequate transmission capabilities to move the solar and wind power out without curtailments. To address those needs the NYISO planning process is supporting “unprecedented expansion”.
One of the planning reports is the quarterly Short-Term Assessment of Reliability (STAR). Anyone interested in the status of the New York electric system would do well to listen to Lin’s explanation. The following slide notes that last year’s second quarter report noted that there was a reliability deficit of 446 MW in the summer of 2025. The deficit was projected because of fossil unit deactivations. In response, NYISO opened a solicitation for market solutions or regulatory solutions. No feasible market solution was submitted so they had to go to Plan B.
To maintain reliability, NYISO had to resort to a regulatory solution. They designated two peaking generation plants as reliability needs and postponed their retirement for two years. The NY Department of Environmental Conservation “Peaker Rule” incorporates this provision and there is a potential for an additional two-year extension. If the Champlain Hudson Power Express transmission project is delayed beyond 2026 the additional extension might be required.
The Comprehensive Reliability Planning (CRP) report incorporates changes associated with demand growth. In the following slide NYISO describes expected changes. As mentioned previously, fossil generator retirements and growth in demand are primary expected changes to the system. Part of the load demand shift changes the peak loads from summer to winter. This is troublesome because the winter diurnal peak will occur when there is no solar. She also mentioned the dual-fuel units. Many New York generating units normally burn natural gas because it is cheaper but have the capability to switch to oil firing when natural gas is needed by residential consumers. The increased reliance on these units, which at the same time are targeted for retirement is a problem. The CRP analysis also identified added risks. The addition of the Micron chip fab plant near Syracuse will add load equivalent to the total load of Vermont and New Hampshire. The New York Power Authority operates small natural gas plants in New York City that are supposed to be phased out by December 2030 due to political pressure. Lin had to make the obligatory gesture that climate changes to extreme weather was a risk. Finally, the shift to a weather-dependent generating system means that reliability design criteria need to be revised to account for extreme weather conditions outside current planning horizons.
The next four slides summarize the challenges to meet the 2040 Climate Act mandate for a “zero-emissions” electric grid. The next slide repeats the points raised in the previous slide. Lin remarked that the year of the cross over from summer to winter peaking can only be guessed at this time. Depending on the trends in load it could be almost any time in the next decade. The 90/10 and 99/1 forecasts are probability estimates for the likelihood of extreme weather events. The final bullet in the slide points out that there could be substantial load growth needed to provide reliability services. The NYISO includes a high load policy case that incorporates this possibility.
The next slide lists the challenges on the generation side. Lin makes the point that generation issues extend beyond simply evaluating the capacity needed to match the load projections. Wind, solar, and energy storage are inverter-based resources that require ancillary service support to make the transmissions system reliable. Weak-grid interconnection and common mode failures are issues that most people, including me, do not understand well. The key point is that all the people that I know who understand these issues are worried but there has not been any wavering of the official political position that all is well. Consequently, the Scoping Plan outline produced by the Hochul Administration to guide the energy transition is incomplete. Lin makes the little recognized point that the Dispatchable Emissions Free Resources are not needed just for the long periods of low renewable resource availability but also to provide these ancillary services.
The next slide addresses DEFR specifically. I will not discuss this much because I covered the Department The next slide addresses DEFR specifically. I will not discuss this much because I already covered the Department of Public Service (DPS) two-day technical conference last December that focused on characterization of the potential “gap” caused by low renewable energy resource availability over long periods of time. I mentioned but did not emphasize the importance of providing the “reliability attributes of retired synchronous generation”.
The focus of this webinar was on the transmission challenges as covered in the following slide. Lin explained that transmission expansion is required to get the diffuse wind and solar energy from where it is collected to where it is needed. The existing system is not adequate for this task.
The final slide in Lin’s presentation presented the planning process expected progress. There is an enormous amount of work underway, but the analysts have a big challenge dealing with changes in the development of resources. As noted earlier, the 2026 expectation is that the Champlain Hudson Power Express project will be online. Even after years of development work the right of way is still not fully permitted and there are numerous examples of supply chain issues delaying other projects, so this may not occur. Clearly longer-term planning is subject to massive uncertainty.
National Grid Presentation Brad Franey Vice President Clean Energy Development explained how National Grid is addressing the need for transmission support. As he points out the utilities receive funding for their transmission and distribution (T&D) system investments from rate cases. Those rate cases are, in no small part, influenced by politics. As a result, New York’s utility companies are held hostage and are not going to overtly challenge the political narrative that the Climate Act objectives can be achieved on schedules mandated by the law. The following slide probably went through multiple iterations to achieve a description of plans that checks all the boxes for what the company thinks that the politicians want to hear.
In the remainder of his presentation he described specific projects that the utility is doing in its service territory. If you are interested in that information, check out my post that covers all the slides.
Questions and Answers
The question and answer portion of the webinar was interesting. The first question asked was “Is reliability a prerequisite for everything else or is it co-equal with our policy objectives?” I have heard suggestions from climate activists that policy objectives should be considered more than they are currently but anyone hoping to hear that there have been changes to protections in place to make sure that those policies don’t get ahead of reliability would have been disappointed in the answers. Elizabeth Grisaru from the DPS made it clear that reliability comes first, that there are “off ramps” for the implementation schedule, and that the PSC will not let the zeal for meeting de-carbonization goals get out in front of reliability. Yachi Lin from the NYISO emphasized the point that they are constantly evaluating reliability. The quarterly short term assessment of reliability and the longer term reliability needs assessment both address it. She admitted that we are going to have outages because the network is not built to be 100% risk-free or outage free. The alternative it “gold plating the system” which we cannot afford.
that the NYISO resource adequacy process identifies risk factors and the timelines to develop the responses. Franey explained that the building component is the fastest but still takes years. The process has to determine what is needed and where before the planning permitting, and construction plans can be developed. Only when all that is done can construction begin but there are potential delays due to procurement and supply chain issues that also must be addressed.
Discussion
My impression of the speakers at this meeting is that they were desperately trying to make the point that the transmission challenges for the Climate Act mandates and schedule were impossible goals without actually saying that. I believe that all the technical people who really understand the electric grid in the DPS, NYISO and the electric companies are being held hostage to the political narrative that “All is well”. That did not work out for Kevin Bacon in Animal House and it won’t work out here either.
The transmission challenges are different than the generation challenges. While it may not be necessary to develop and deploy a not yet commercially available technology like the generation sector to make this all work there still are inverter-based resource integration issues that need to be resolved. I have the utmost respect for the electric system engineers, but I fear that they will be hit by unanticipated combinations of conditions that they could not foresee. The result will be blackouts.
In my opinion the bigger problem is the scale of the transmission upgrades and additions needed. New York has already committed $6 billion to start “unbottling” renewable resources which is code in New York for Upstate utilities paying for support for New York City access to renewables. New York also has plans for three major bulk transmission projects to get hydroelectric power from Quebec, another to collect the energy from part of Upstate to New York City, and the third to start the process of connecting the expected 9 GW of offshore wind into the grid. Nobody has admitted to the total costs.
The other New York problem that I suspect is common elsewhere is that the politicians who enacted these net-zero laws were more concerned with the optics of aspirational timelines and not the feasibility of those schedules. A question about longer planning processes planning and deployment timing made the point that the NYISO resource adequacy process that identifies specific need for transmission development, New York’s de-regulated market process to propose, bid, and choose the development, and the project planning, permitting, and construction plans development which all need to be completed before construction can begin takes a lot of time. Reading between the lines all the speakers are highly skeptical that the artificial deadlines of the Climate Act can be achieved.
One final point not addressed in the webinar but certainly affecting the viability of New York’s energy transition goal is the decarbonization of heating and transportation. That is going to require a complete rewiring of the distribution network.
Conclusion
The magnitude, costs, and technical challenges of the generation and transmission electric grid transition ensure that that there is no question that New York will hit the Green Energy Wall. The Hochul Administration has not provided a feasibility analysis that includes the expected costs, ensures that current reliability standards can be maintained, and documents the cumulative environmental impacts of the generation resources and the transmission and distribution deployments for the electric system to meet the 2030 70% renewable energy mandate. The fact that no jurisdiction anywhere has developed a system that depends on wind and solar as in the proposed New York system suggests that a proof-of-concept demonstration is appropriate.
In order to meet the Climate Leadership & Community Protection Act (Climate Act) the Hochul Administration has proposed the New York Cap-and-Invest (NYCI) program. The regulatory process to set up this market-based emissions trading program is underway. Not content to let the that process play out Assemblyperson Anna Kelles has introduced a bill to “amend the environmental conservation law and the public authorities law, in relation to establishing an economy-wide cap and invest program to support greenhouse gas emissions reductions in the state”. Unfortunately, the basis for this legislation is flawed because its authors do not understand what makes market-based emission reduction programs work.
I have followed the Climate Act since it was first proposed, submitted comments on the Climate Act implementation plan, and have written over 400 articles about New York’s net-zero transition. I have worked on every emissions trading program affecting electric generating facilities in New York since 1990 including the Acid Rain Program, Regional Greenhouse Gas Initiative (RGGI), and several Nitrogen Oxide programs since the inception of those programs. I also participated in RGGI Auction 41 and successfully won allowances which I held for several years. I follow and write about the RGGI cap and invest CO2 pollution control program and New York carbon pricing initiatives so my background is particularly suited for evaluating the NYCI proposal and this proposed legislation. The opinions expressed in this post do not reflect the position of any of my previous employers or any other organization I have been associated with, these comments are mine alone.
Overview
The Climate Act established a New York “Net Zero” target (85% reduction in GHG emissions and 15% offset of emissions) by 2050. It includes an interim 2030 reduction target of a 40% reduction by 2030 and a requirement that all electricity generated be “zero-emissions” by 2040. The Climate Action Council (CAC) was responsible for preparing the Scoping Plan that outlined how to “achieve the State’s bold clean energy and climate agenda.” In brief, that plan is to electrify everything possible using zero-emissions electricity. The Integration Analysis prepared by the New York State Energy Research and Development Authority (NYSERDA) and its consultants quantifies the impact of the electrification strategies. That material was used to develop the Draft Scoping Plan outline of strategies. After a year-long review, the Scoping Plan was finalized at the end of 2022. In 2023 the Scoping Plan recommendations were supposed to be implemented through regulation, PSC orders, and legislation. Not surprisingly, the aspirational schedule of the Climate Act has proven to be more difficult to implement than planned and many aspects of the transition are falling behind. NYCI is an example of a program that is taking longer to develop than is consistent with the mandates.
Capital Tonight Interview with Kelles
Susan Arbetter interviewed Kelles about her legislation on Capital Tonight. The description of the interview stated:
New York state Assemblymember Anna Kelles has introduced legislation that serves as an alternative to the state’s emerging cap and trade system.
Cap and trade is a program used to help meet climate goals by capping pollution and then authorizing tradable allowances between companies, creating a new market.
New York is currently creating a cap and trade system under its 2019 climate law.
Assemblymember Kelles is carrying legislation that would transform this system into what she’s calling a “cap and invest” system. She joined Capital Tonight’s Susan Arbetter to discuss her bill.
The video for the interview is embedded in the description. Arbetter introduced the interview with a slide “Cap and Trade” that made the following points:
Caps emissions in New York
Emissions credits for sale
Companies can sell emissions credits for profit
Proposal would reinvest revenues of credit sales in climate projects
Arbetter claims that the Kelles legislative proposal would make the market-based system a cap and invest program. There is disconnect here. The NYCI proposal is a cap-and-invest program as I have described previously. The program will cap emissions in New York. The permits to emit a ton of GHG emissions, known as allowances, will be distributed primarily though auctions. The proceeds will be used to invest in projects that reduce GHG emissions and prioritize investments in “frontline disadvantaged communities”. Arbetter’ s statement that companies can sell the allowances for profit is technically true, but the reality is that the affected companies buy what they need for their own compliance and do not purchase allowances at the auctions to play the market for profit. On the other hand, there are no limits to participation in the proposed NYCI design so traders can purchase allowances and try to make profits.
Arbetter asked Kelles what she was not happy with in the proposed NYCI design. The first reason she gave was that “instead of what we agreed to in last year’s budget to create a cap-and-invest program this is instead a cap-and-trade program”. As noted previously, the state plan is a cap-and-invest program. I think her mis-conception is that NYCI allows trading of the allowances, so it is “cap-and-trade”. NYCI also allows entities to bank or carry over unused allowances between compliance periods.
The Kelles legislation includes the following that upends the approach used in all previous market-based emission reduction systems:
§ 75-0123. Use of allowances.
1. Allowances must be submitted to the department for the full amount of greenhouse gas emissions emitted during a given compliance period. If greenhouse gas emissions emitted during a given compliance period exceed allowances submitted for such compliance period, such shortfall shall be penalized pursuant to section 75-0129 of this article.
2. Any allowances not submitted at the end of the compliance period in which they are issued by the authority shall automatically expire one hundred eighty days after the end of such compliance period if not submitted prior to such date of expiration.
3. Allowances shall not be tradable, sellable, exchangeable, or otherwise transferable.
In addition to these limitations in NYCI there is a three-year compliance period and in the Kelles legislation there is a one-year compliance period. These differences destroy the flexibility that has made market-based emissions control program successful. All programs include penalties if an affected source is unable to surrender an allowance for each ton emitted. The limitations that allowances not used expire and that allowances “shall not be tradable, sellable, exchangeable, or otherwise transferable” are incompatible with previous programs and would be unfair to market participants.
The NYCI proposal builds on the experience of RGGI which New York State claims has been successful and has worked for market participants. NYCI offers the allowances in quarterly auctions and compliance is for a three-year period. Participants in the program will develop a bidding strategy to purchase the number of allowances that they expect to use during the compliance period. Experience in the RGGI cap-and-invest program showed that a three-year compliance period enabled affected sources to effectively match their allowance needs with their emissions. Because GHG emissions are closely tied to energy use, emissions vary with weather conditions with more emissions and allowances needed in hot or cold years and less in average conditions. The ability to bank and trade allowances enables entities to correct their projections and account for inter-annual variation.
In the Kelles proposal if each individual source did not match their allowances purchases based on projected operations to their actual emissions, then they would be stuck with excess allowances that they cannot sell or trade and will expire. That is an unfair approach. In the first place, allowances are purchased in lots of 1,000. The odds of any source emissions being in multiples of 1,000 is nearly zero and many sources total emissions are less than 1,000. As it stands now, a company with multiple sources purchases allowances for them all and allocates them to individual accounts for compliance. This practice would be outlawed by the prohibition on trading. Many participants rely on emission marketers who purchase allowances at auction for resale or facilitate trades between those companies that have excess allowances and those that need them. Small companies rely on these marketers for their allowances because they don’t have the expertise to participate in the auctions. The RGGI cap-and-invest approach enables flexibility that makes compliance cost-effective.
Another issue that Kelles said she was not happy with is that NYCI “creates an extensive secondary market”. One example she gave was that the limit on the number of allowances purchased is 25% so you “could have a situation potentially where only four entities own all the allowances” and they could exert market control and sell them for profit. This has been an on-going concern with RGGI, but they included a market monitoring component expressly to address the concern. RGGI started in 2009 and the problem has not come up. NYCI proposes to use the same mechanism.
Kelles also said that her legislation would shift the emphasis to investments rather than profits which she wants to see. When you look at a market-based emissions system from the outside, the activist community that is providing information to Kelles only see dollar signs and believe that somehow industry is profiting from the program at the expense of consumers. I also think that academics have contributed to this perception because they believe that the allowances are treated as marketable commodities by the compliance entities. In reality, entities affected by these emissions trading programs prioritize compliance above all and rarely treat the allowances as a source of profit. It is simply wrong to think of these programs as evil because there are some profits involved. Those profits incentivize the flexibility that in the big picture reduces overall costs.
The activists who are influencing Kelles rank protections to disadvantaged communities very high. There are very few examples where emissions market programs have adversely affected those communities and most studies disagree. The bigger problem with this concern is that market-based emissions programs are not designed to address local issues. Kelles said that emitters are predominantly in disadvantaged communities, and it is “necessary to reduce the GHG emissions that are negatively impacting those communities”. Greenhouse gases do not have direct health-based air quality impacts so activists use co-pollutants for the adverse impacts claims. That ignores the fact that there are programs in place designed to address co-pollutants emitted by sources in disadvantaged communities. Clearly the reason we are reducing GHG emissions is to influence global climate change so claiming negative local impacts is a stretch. Moreover, it is necessary to put what we can do to affect climate change impacts in context. In 2021 CO2 emissions in the Chinese energy sector increased by 400 million tons. Total New York GHG emissions for all greenhouse gases and all sectors in 2021 were 268 million tons so eliminating New York emissions Anything we do will be completely replace by emissions elsewhere in less than a year.
Kelles also stated that she was not happy that NYCI is considering not obligating the electricity sector to participate in NYCI. She suggested that because there are power plants in disadvantaged communities that not including them eliminates the ability to protect residents there. I believe that the decision to exclude the electricity sector at the start is a practicality issue. They already are covered in RGGI and the agencies do not have sufficient resources to include them and everything else at the same time. My impression was that the electricity sector will be added later. With respect to her concern about the power plants in disadvantaged communities that whole issue is a contrived artifact of environmental justice activists. The presumption of egregious harm from power plants in disadvantaged communities is based on selective choice of metrics, poor understanding of air quality health impacts, and ignorance of air quality trends.
There also was a discussion of the emissions intensive and trade exposed industries provisions. These are industries that will be put to disadvantage when they try to compete against companies outside New York that do not have the NYCI costs. Kelles claims that her plan is to encourage them to transition to renewable energy infrastructure without acknowledging the competitive implications of that transition. I frankly have not followed the particulars of this aspect because I think it is hopeless. There will be inevitable increased costs and, at some point, industries will not be able to compete. The Business Council of New York memo in opposition to the legislation addresses these concerns.
Discussion
I am going to limit this article to the issues raised in the Arbetter interview. There are some other examples where the poor understanding of components of these programs that led to the success of previous programs will be hampered or destroyed by this legislation. The examples included are sufficient to show the legislation is flawed because its authors do not understand what makes market-based emission reduction programs work.
First, and foremost, market-based emission reduction programs are trading programs. The ability to buy, sell, or trade allowances and bank them for later use enables the flexibility that makes these programs a cost-effective solution. Eliminate them and there is no assurance that they will work like previous programs.
NYCI is called a cap-and-dividend program because the primary way that allowances will be distributed is through an auction. The proceeds from the auction are the dividends that will be invested to reduce emissions and minimize impacts to disadvantaged communities of the inarguably regressive energy costs necessary to implement the zero-emissions by 2040 Climate Act mandate.
In my opinion, the guardrails around the allowance costs are so inflexible that NYCI is basically a carbon tax. The Kelles legislation would remove any pretense that the program is anything but a tax. There are some advantages to that and some disadvantages too but I think that if there is any legislation is passed it should be to set a carbon tax because that is the responsibility of the legislature.
There is no question that disadvantaged communities have had disproportionate historical impacts. However, cap-and-invest programs are not the appropriate tool to protect them and reduce their environmental impacts because cap-and-invest programs are designed for regional and global pollutant reductions. There are regulations in place that address local impacts and the Department of Environmental Conservation is implementing additional regulations to strengthen and enhance those safeguards. The demands of environmental justice activists that have influenced this legislation unfortunately demand zero impacts without any consideration of pragmatic tradeoffs. For example, the focus on peaking power plants ignores the vital role those facilities play to keep the lights on despite results that show that the alleged impacts are over-stated.
Conclusion
The fundamental flaw in the Climate Act is the presumption by its authors that getting to net-zero emissions was only a matter of political will. There never has been an open and transparent feasibility analysis to clearly account for the necessary costs and threats to system reliability but all indications are that this cannot work as outlined in the Scoping Plan.
On the other hand, the NYCI proposal builds on the existing RGGI model. That program has shown how a cap-and-invest program can ensure compliance and raise money for investments fairly. The Kelles legislation ignores the factors that made RGGI work and eliminates them. That will ensure that the program does not provide any pretense of cost-effective reductions.
The presumption of the Hochul Administration and the Kelles legislation is that a cap-and-dividend program will work as well as previous programs. I think the real debate should be whether that is a justified position because I think the differences between the ambition of this program and previous programs is far greater. When the results of previous programs are considered the odds that NYCI will work as hoped are not very good.
I have great admiration for Roger Pielke, Jr and his work on addressing climate change. However, his recent post explaining why he is bullish on solar does not stand up to his usual standards. This post explains why I disagree with his optimism for solar in the context of New York’s net-zero transition.
I have followed the Climate Leadership & Community Protection Act (CLCPA) since it was first proposed, submitted comments on the CLCPA implementation plan, and have written over 400 articles about New York’s net-zero transition. I am convinced that the CLCPA will adversely affect affordability, reliability, and that the environmental impacts of the proposed transition are greater than the possible impacts of climate change. The opinions expressed in this post do not reflect the position of any of my previous employers or any other organization I have been associated with, these comments are mine alone.
Overview
The CLCPA established a New York “Net Zero” target (85% reduction in GHG emissions and 15% offset of emissions) by 2050. It includes an interim 2030 reduction target of a 40% reduction by 2030 and a requirement that all electricity generated be “zero-emissions” by 2040. The CLCPAion Council (CAC) was responsible for preparing the Scoping Plan that outlines how to “achieve the State’s bold clean energy and climate agenda.” In brief, that plan is to electrify everything possible using zero-emissions electricity. The Integration Analysis prepared by the New York State Energy Research and Development Authority (NYSERDA) and its consultants quantifies the impact of the electrification strategies. That material was used to develop the Draft Scoping Plan outline of strategies. After a year-long review, the Scoping Plan was finalized at the end of 2022. In 2023 the Scoping Plan recommendations were supposed to be implemented through regulation, PSC orders, and legislation.
I have documented issues with New York’s solar energy rollout and its issues. The Scoping Plan uses unrealistic estimates of the energy that can be produced by solar in New York so the estimate that New York will need 18.9 GW in 2030 and 43.4 GW in 2040 of solar capacity are too low. There is no policy in place to protect prime farmland from utility-scale solar development and over 8,000 acres of prime farmland have been lost. The last cumulative environmental impact assessment did not address the total solar capacity that is now expected.
Bullish on Solar
Pielke’s blog post gave three reasons why he is “very bullish on solar energy technologies — solar is scalable, solar is cheap and getting cheaper, and solar is safe, simple, and popular.” I am not bullish on solar for reasons that Pielke mentioned but did not follow through on. Importantly my primary concern is New York’s Climate Act net-zero transition and some of his caveats are inapplicable to New York. Pielke does not quality his bullishness relative to any geographical limitations.
First, I want to explain my overarching concern. My Climate Act issues are related reliability when the system depends on weather-related wind and solar for most of the electric power generation as outlined in the Scoping Plan. Electric system resource adequacy planning must address the worst-case conditions and this challenge is made more difficult when intermittent wind and solar resources are used. While Pielke recognizes the challenge of extended periods of low solar availability, I do not think Pielke’s enthusiasm for solar considers this challenge enough.
Scalable Solar
Pielke argues that solar can be installed incrementally from rooftops to massive utility-scale arrays. He points out that “in the U.S., the Energy Information Agency (EIA) reports that about one third of solar generation comes from small-scale solar (defined as less than 1 MW capacity)”. This gives unquestioned flexibility for the development of resource capacity but that comes at a system reliability cost.
The New York Independent System Operator (NYISO) is responsible for matching generation with load. Small-scale solar is “behind the meter” and cannot be controlled by the electric system operator. Instead, they analyze its capacity to reduce the load from those locations that have solar installations. The problem is that this capability fluctuates and cannot be always relied on. For example, roof top arrays can be affected by accumulated snow and the NYISO has no idea how much that will affect load in the winter.
The other scalability issue is that solar resource value is geographically limited. What works in low-latitudes and “sunshine” states will not work as well in New York’s high latitudes and cloudy regions downwind of the Great Lakes. In the worst case a solar array above the Arctic Circle may work well in the summer but is useless in the winter. New York is not as bad but, in the winter, the solar resource is much reduced and the NYISO does not count on any solar for the diurnal peak.
He includes a graph of the cost of solar modules with time that shows the module costs have declined 99.6% since 1976. Not mentioned is that solar modules lose efficiency over time and that their expected lifetimes are half those of conventional fossil plants. Pielke argues:
The low costs of solar energy, which are positioned to drop even further, has led some in the U.S. to question — quite fairly — why federal subsidies for wind energy are necessary today and far into the future. With or without U.S. subsidies, solar costs should be expected to continue to drop, motivating further deployment, which will lead to greater reductions in costs — a virtuous cycle.
I am worried about how solar energy can be used for the New York Climate Act net-zero transition, specifically the intermittency. Pielke acknowledges the issue:
Even if solar were free, the technology will always have an intermittency problem when the sun doesn’t shine. The New York Times explained last week that massive battery storage can smooth over demand, but it cannot address intermittency with today’s technologies:
Today’s lithium-ion batteries typically only deliver power for two to four hours before needing to recharge. If costs keep falling, battery companies might be able to extend that to eight or ten hours (it’s a matter of adding more battery packs) but it may not be economical to go far beyond that, said Nate Blair, an energy storage expert at the National Renewable Energy Laboratory.
That means additional long-duration storage technologies could be needed. If California wants to rely largely on renewable energy, it will have to handle weeklong periods where there’s no wind and little sun. Another challenge: There’s far more solar power available in summer than in winter, and no battery today can store electricity for months to manage those seasonal disparities.
I have three problems with claiming that solar is cheap and getting cheaper while ignoring the storage costs. Storage for solar is needed on different scales. As noted, there is a difference between summer and winter but there is even a daily difference. The expected annual output of solar is on the order of 25% of the total which means that a system to provide 100 MW of constant energy would need to overbuild solar to 400MW of capacity and roughly 300 MW of storage. That is the average annual need and when the worst-case long duration solar drought is considered energy storage becomes impracticable so a new dispatchable emissions-free resource is needed. In the real world, it is even more complicated, and every complication adds more capacity requirements. All these considerations add to the costs and are not considered by Pielke.
My second problem is that as Pielke notes today’s technology cannot address intermittency. His solution is pragmatic but not applicable to the Climate Act transition to zero-emissions electricity:
As solar gets cheaper, it will see continued expansion, but accompanying that expansion will be the associated costs of reliable back-up generation, which today means natural gas. Even though natural gas is a fossil fuel, the expanded use of solar backed up by gas has considerable potential to reduce emissions, especially in places where that combo displaces coal generation. The low costs of solar mean that we should expect to see more such displacement.
The third problem is that solar and energy storage are inverter-based resources. It turns out that solar, energy storage, and wind do not provide ancillary services needed to maintain the electric grid. If you have no idea what I am talking about I recommend the Practical Engineering You Tube channel video Connecting Solar to the Grid is Harder than You Think
New York’s aspirational goal is to eliminate fossil-fueled generation so natural gas backup is off the table. Even if natural gas backup were a potential solution, cost projections should consider all the costs of solar plus energy storage versus just using natural gas and nuclear. At some point a solar plus natural gas backup system will need new fossil generating units. That approach would necessitate over-built solar, energy storage, ancillary support services, and backup natural gas resources. If you just used natural gas you eliminate all those other components. However, using natural gas for baseload electricity is a waste of this valuable resource. Nuclear is a great zero-emissions baseload resource but has some deficiencies that are best resolved using natural gas units. In my opinion, a full life cycle analysis that incorporates the life expectancies of the resources would show that renewables would be the more expensive option and also require development of new resources.
Solar is Safe, Simple, and Popular.
Pielke’s argument for safety relies on a review by Our World in Data that finds that the safest source of energy production, as measured by deaths per terawatt-hour of production is solar. His arguments for simple and popular follow:
Searching Google Scholar, I have not been able to find a single paper addressing fears of solar energy. There are of course concerns about solar supply chains, solar waste, and risks to solar installations but these issues are common across all energy technologies.
A 2023 survey by Glocalities of 21,000+ people in 21 countries found solar energy to be the most favored energy technology, and overwhelmingly so, with 68% favoring solar over other technologies, as shown in the figure below.
The strong public support for solar and lack of public fears mean that among energy technologies, solar has strong political tailwinds that are unique in the energy space. Correspondingly, the ongoing expansion of solar generation will face much less opposition than proposed new wind and nuclear. Of course, the fact that effective solar deployment also means more gas back-up may result in greater opposition in the future from those who believe that we can just stop fossil fuel use.
Compared to solar energy technologies, wind technologies appear like a convoluted series of Rube Goldberg devices. To be sure, modern wind turbines are a testament to human ingenuity and technological prowess. But they are also massive installations with many moving parts often exposed to harsh conditions — offshore wind in particular. Solar technologies are elegantly simple in comparison.
I cannot document anything different. Anecdotally however, the “not in my backyard” folks are not enamored when a utility-scale solar development is built nearby. Given the space requirements for solar energy that is no small consideration. I do not disagree that in comparison to wind technologies solar is simpler but the additional technologies necessary to integrate solar to the grid are anything but simple and untested at commercial scale to boot.
Discussion
After years of research and study of the challenges of wind, solar, and energy storage I have evolved away from any support for those technologies in anything but niche applications. Ultimately, relying upon weather-dependent resources necessitates unacceptable risk. The weeklong periods where there’s no wind and little sun mentioned earlier introduces tradeoffs not present in the existing electric system. After decades of experience with the components of the existing electric system the electric planners at the NYISO and other regional operators have a very good understanding of resource availability. The key point is that they do not have to worry about correlated outages across the electric system. In the future, relying on wind and solar means that there will be correlated periods across vast areas when wind and solar resources are low. Furthermore, those periods correspond to the highest load demands at the same time the Climate Act wants to electrify everything possible.
The proposals for electric system resources in New York call for enormous additions of wind, solar, energy storage, and the as yet unidentified dispatchable emissions free resource. Just building it is an enormous challenge. The video Connecting Solar to the Grid is Harder than You Think notes that there are poorly understood aspects of the inverter-based resources on the grid. Despite my admiration for the capabilities of the electric planning community, the fact is that they will be in a steep learning curve and the odds favor learning by experience. That experience means blackouts.
That is not the worst of it. It is well recognized now that the long duration wind and solar droughts is a massive problem. However, what is not clear to many is the scale of the problem. In my opinion, the most dangerous future period will be an immense polar vortex that covers most of the North American Interconnect. In that case there will be no imports from where the wind is blowing, or the sun is shining. The problem is that you cannot build an electric system based on a one in fifty-year return period because the resources can never be paid off. But it will happen and when it does electricity will run out. Inevitably there will be a massive blackout that endangers the health and safety of millions of people.
I believe that the pursuit of zero-emissions electricity is a mirage. To justify this transition imaginary benefits are conjured up but the immense costs of trying to do it will be real. The conjured health benefits will be dwarfed by real deaths when there is no heat, no transportation, and no lights during the coldest period of the year.
Conclusion
Pielke’s optimism for solar neglects key considerations. There are geographical areas and niche applications where it may make sense to rely on solar. New York’s high latitude and cloudiness is one location where it does not. I do not disagree that it is scalable and safe. His arguments for solar cheapness ignore the expensive challenge to integrate solar energy into the electric grid when and where it is needed. Full consideration of the ancillary services requirements suggests that it will not be simple either. When enormous tracts of land are covered up with solar panels I think that its popularity will wane. I am not a New York solar energy optimist.
According to New York climate activist non-governmental organizations New York is “failing to lead on climate.” These organizations are lobbying very hard for the New York Home Energy Affordable Transition Act, or NY HEAT, legislation currently being considered. I recently described Rich Ellenbogen’s response to Sane Energy Voice claims that NY HEAT Act should be enacted. This post documents additional op-eds that argue this legislation not a good idea.
I have followed the Climate Leadership & Community Protection Act (CLCPA) since it was first proposed, submitted comments on the CLCPA implementation plan, and have written over 400 articles about New York’s net-zero transition. I am convinced that the CLCPA will adversely affect affordability, reliability, and that the environmental impacts of the proposed transition are greater than the possible impacts of climate change. The opinions expressed in this post do not reflect the position of any of my previous employers or any other organization I have been associated with, these comments are mine alone.
Overview
The CLCPA established a New York “Net Zero” target (85% reduction in GHG emissions and 15% offset of emissions) by 2050. It includes an interim 2030 reduction target of a 40% reduction by 2030 and a requirement that all electricity generated be “zero-emissions” by 2040. The CLCPAion Council (CAC) was responsible for preparing the Scoping Plan that outlines how to “achieve the State’s bold clean energy and climate agenda.” In brief, that plan is to electrify everything possible using zero-emissions electricity. The Integration Analysis prepared by the New York State Energy Research and Development Authority (NYSERDA) and its consultants quantifies the impact of the electrification strategies. That material was used to develop the Draft Scoping Plan outline of strategies. After a year-long review, the Scoping Plan was finalized at the end of 2022. In 2023 the Scoping Plan recommendations were supposed to be implemented through regulation, PSC orders, and legislation. NY HEAT is an example of Climate Act legislation. Not surprisingly, implementation is falling behind as the difficult challenges are addressed.
The purpose of the bill is to give the Public Service Commission the authority and direction needed to align gas utility regulation and gas system planning with the Climate Leadership and Community Protection Act (CLCPA) mandates. Overall, the bill removes the legal basis and subsidies driving the expansion of gas systems and requires the commission to adopt rules and develop a statewide gas service transition plan that is consistent with decreasing gas reliance and, where appropriate, decommissioning gas systems.
Fossil fuels burned in buildings for heating, hot water, and cooking account for approximately one-third of greenhouse gas emissions in New York State. Additionally, heating and cooking with fossil fuels like natural gas quietly impact our indoor air quality, contributing to cases of asthma and heart disease. The Public Service Law, as is, promotes gas system expansion in its stated obligation to serve customers and its business model. This undermines the important climate justice directives and binding emissions limits in the CLCPA. Instead of letting this incompatibility issue continue, this bill better aligns the rules and business practices of the Commission with reduced gas reliance, transition to more sustainable utilities, and prevents energy bill burden among low-income ratepayers.
The bill makes several amendments to the Public Service Law. One of which includes directing the Commission to integrate “the utility sector achievement of the CLCPA” as a core planning objective to its public service responsibilities. Notably, this bill codifies the state goal that low-to-moderate income customers must be protected from bearing energy burdens greater than 6% of their income, including those burdens imposed by the cost to purchase and operate electric equipment.
The overarching problem with NY HEAT is that it is another piece of energy legislation drafted by climate activist non-governmental organizations and pushed by gullible politicians. The biases of these constituencies and their lack of technical expertise has led to the situation where New York is mandated to meet an aspirational schedule that can only be met by revoking the laws of physics. Energy policy should not be dictated by politicians and NGOs that have no responsibilities for their actions.
Alternate Viewsfrom the Real World
This post provides three op-ed pieces that provide other reasons that NY HEAT is inappropriate. On Sunday May 12, the New York Daily News published pieces by NY State Senator George Borrello and one co-authored by Richard Ellenbogen and myself. Last week Dennis Higgins had another opinion piece published by All Otsego.
Senator Borrello’s paywalled opinion was titled: Don’t raise the N.Y. HEAT Act: We have to be honest about energy costs. Borrello represents the 57th state Senate District which includes Cattaraugus, Chautauqua, Genesee and Wyoming counties, as well as a portion of Allegany County. He is also a member of the Senate Energy Committee. He stated:
The failure of climate-related items to pass in the “Big Ugly” of the New York State budget was no accident. Reason prevailed among pragmatic lawmakers, and reality set in that the New York Home Energy Affordable Transition Act (NY HEAT) would have placed New Yorkers at risk and wreaked havoc with reliability and affordability.
However, advocates have regrouped and are waging a media campaign, arguing that NY HEAT is necessary to “save New Yorkers billions every year,” trying to confuse the public and pressure lawmakers into passing this horrendous piece of legislation. We cannot let ideology and a radical climate agenda override facts and real progress.
Unfortunately, false and misleading claims about the cost savings that New York ratepayers would realize under the NY HEAT Act are everywhere. Those perpetrating this narrative conveniently ignore the costs to New Yorkers that will come with a mandated conversion to an all-electric future for the state. These advocates also sell their drastic, one-size-fits-all solution as the only path forward.
The fact is, there is a more balanced approach that addresses pollution and environmental concerns without threatening safety, reliability, and affordability. The balanced approach clearly works: our state is already one of the greenest in the nation, ranking seventh in renewable-sourced electricity generation. Much of the credit goes to hydroelectric power, which supplies 21% of New York’s total in-state power generation.
While the HEAT Act would end the 100-foot rule requiring utilities to connect new customers within 100 feet of an existing gas pipeline, it should be noted that utilities are already taking steps in this direction. They are proposing provisions that would allow them to voluntarily make determinations on new service connections based on relevant factors.
While we all recognize the value in pursuing a cleaner energy future, we must acknowledge that utilities have a legal and moral obligation to replace aging pipe infrastructure to ensure safe, reliable service to all their customers and the communities they serve. Claims by advocates that the maintenance of natural gas infrastructure is a burden on ratepayers that would disappear under the HEAT Act are disingenuous, at best.
The reality is that ratepayers already subsidize the maintenance of all utilities — electric, water, and sewer. Utility maintenance costs will not disappear if the HEAT Act is enacted. Additionally, many of the cost estimates being cited for critical maintenance of gas infrastructure are grossly inflated, which only serves to further mislead the public.
The real factors fueling utility rate increases are largely driven by government. More than 70% of the bill for the average ratepayer is the result of the following: federal and state pipeline safety mandates, property tax increases, expanded energy efficiency programs, supports for low-income customers, state-mandated purchases of costly wind and solar energy, increases in the cost of capital, supply chain shortages and inflation.
The replacement of pipes, while a regulatory mandate, is not a major driver — and those costs are just a fraction of what’s to come once the impacts of renewables and new transmission lines hit customer bills later this decade.
Finally, NY HEAT Act advocates are conspicuously silent about the fact that electrifying homes is many times more expensive than pipe replacement, and residents often bear those costs on their own.
According to a recent analysis, electrifying just one co-op in Brooklyn took four years and cost nearly $1 million. Even with rebates, that comes out to $40,000 per apartment, and residents are now responsible for the full cost of heating their homes, rather than sharing costs with the entire building. The cost to operate those electrical systems to heat homes will cost more on a monthly basis than to heat that same home on natural gas.
The reality is that the most fervent advocates of New York’s aggressive climate agenda believe that no cost is too great to address the climate crisis. That is why they misrepresent the facts and mislead New Yorkers into believing a transition to all-electric will save them money. The truth is that New Yorkers are in for a far costlier and less reliable energy future if proposals like the HEAT Act are adopted.
Rich Ellenbogen and I had an op-ed published next to the Senator’s. The title of our paywalled piece was “Don’t raise the N.Y. HEAT Act: It threatens the safety of all New Yorkers”. We wrote:
The New York Home Energy Affordable Transition Act, or NY HEAT, is before the Legislature now. However, until questions regarding its feasibility, affordability, and reliability are answered, the HEAT Act should be allowed to lay dormant.
The Climate Leadership & Community Protection Act (NYS’s climate law) mandates that the electric grid be 100% zero emissions by 2040, and the law’s scoping plan projects that by 2040 more than 60% of the capacity and more than 69% of the energy will come from wind and solar.
This total transformation of New York’s energy production and use is being undertaken in spite of the fact that no jurisdiction anywhere in the world has yet succeeded in raising the percentage of the supply of electricity to its grid from wind and solar — beyond about 50% of total supply — on a consistent basis.
The reason for these limits is because both wind and solar are intermittent and therefore unreliable. As a result of these realities, the state Public Service Commission is considering what new technologies must be developed to address those coldest and hottest periods where there will be insufficient generation from existing wind, solar, and energy storage technologies.
Unfortunately, there is no commercially available technology that can be deployed in sufficient quantities today for this reliability requirement. As a consequence of these facts on the ground (and in the air), it is prudent for New York’s decisionmakers to determine the technological feasibility of the zero emissions transition before passing NY HEAT.
The Empire Center’s recent Green Guardrails describes why the Climate Law implementation plan is flawed. It notes that “The process that has played out in the five years since the law’s passage has been marred by a lack of transparency, with state officials failing to issue legally required cost estimates and crucial studies designed to guide state energy policy.” Before the state passes NY HEAT, a full, transparent accounting of all the costs, benefits, and emission reductions for the proposed control strategies is necessary.
It is premature — and unquestionably dangerous — to mandate the additional electrification requirements of NY HEAT. The mandate to deploy massive amounts of wind, solar, and energy storage resources, and simultaneously upgrade and expand the distribution and transmission systems, means that an enormous quantity of transformers, wires, and generating equipment will be required.
There already is a shortage of transformers which will inevitably get worse and spread to other infrastructure components. Even if the hardware is available, there is insufficient labor to execute the plan. There is also a shortage of both electricians and plumbers, and there are not enough people to train even if they could develop the training programs. Without these new resources, current reliability standards of the electric grid cannot be maintained.
NY HEAT removes the “obligation to serve,” a regulation that requires utilities to offer natural gas to any customer who requests it; and the bill also enables the network to be decommissioned in favor of neighborhood-scale electrification. In addition, it will codify a goal of protecting residential customers from paying more than 6% of their household income for energy bills.
When NY HEAT eliminates the obligation to serve, and enables the decommissioning of existing gas systems, it eliminates consumer choice and does not acknowledge — as the state’s scoping plan to implement the Climate Law does — that not all homes will be able to electrify home heating safely and affordably.
A political mandate to decommission a gas network is a drastic step that should only be undertaken until the full ramifications of New York’s total energy transformation is understood. Otherwise, we risk jeopardizing the safety of all New Yorkers.
Lastly, the HEAT bill’s proposal to limit energy bills to no more than 6% of a household’s income is an inadequate energy poverty safeguard. It does not cover household costs: to replace existing home heating equipment with the preferred heat pump alternatives; to upgrade building shells to eliminate or minimize the time that backup heating systems will be needed; to pay for backup heating systems if needed; or to pay for the upgrades to the electric service for the household to cover the increased electric load when the entire household is electrified.
The shortcomings of the HEAT bill are to some extent a product of its authors’ faulty assumptions, but they are exacerbated by the even more unrealistic and unachievable goals built into the larger Climate Law. Until these issues are properly addressed, we should set aside the HEAT bill because it will simply make a bad situation worse.
The proposed NY HEAT Act, which would mandate a rapid transition to air-source heat pumps, is yet another toxic plan, currently shunted to the back burner in Albany. Although it did not make it into the budget, with pressure from advocates it could be passed this session. NY HEAT, like its Climate Leadership and Community Protection Act launch pad, runs counter to sound engineering and responsible fiscal policy. What’s wrong with it? Let me count the ways.
A five-ton ASHP unit may cost $9,000.00. Installation in the New York City area would cost as much as the pump, assuming existing panel boxes could support the load. There is currently a shortage of plumbers and electricians to do that work. New panel boxes, wiring, and post-installation repair, combined with labor shortages, would serve to increase costs and undermine any timetable. Further, an ASHP may require 5,000 kilowatt-hours a year. Electric bills are already climbing, as rate-payers finance new transmission lines and utilities deal with gas shortages. For homes and apartments with new pumps, electric bills could double.
The independent system (grid) operator, the NYISO, is projecting a 450-megawatt capacity shortfall in the metro region as early as summer 2025, assuming normal weather conditions and without factoring in NY HEAT’s additional load. With building and vehicle electrification, the NYISO already expects demand to double in the next 25 years. But NY HEAT implementation would require a capacity-constrained grid to deliver lots more electricity in the very near term.
Increased electricity demand would in turn increase the load on every transformer in the state. Transformers would have to be replaced, but—as has been reported on National Public Radio and elsewhere—replacements do not exist. The increases to load would also require replacing transmission lines. This could take decades and would require lots of aluminum. Currently, there isn’t enough aluminum for beverage cans, let alone thousands of miles of wire.
Even ignoring the sluggish pace of buildout and lack of battery support, solar and onshore wind are intermittent and have low-energy density, rendering them unsuitable to support additional demand. Offshore wind will not help. Many of New York’s offshore wind projects were cancelled. Driving bid prices and cancellations, supply-chain and construction hurdles mean significant offshore installation may not happen this decade. The Jones Act prohibits foreign jack ships from installing turbines in U.S. waters. The U.S.’s first Jones-Act-compliant ship, Dominion’s Charybdis, may not be ready until early 2025 and is already booked for Virginia’s 2.6 gigawatt project.
Ultimately, increases in demand from ASHPs—a Micron factory, bitcoin mining, or AI hubs—will rely on our fleet of fossil-fuel power plants. The metro region is currently at capacity, so peaker plants will continue to be needed. Even before the NY HEAT proposal, NYISO indicated that deadlines for closing peakers will need to be extended. Gas supply constraints downstate mean Cricket Valley—a combined-cycle plant in Dover—can’t currently run at full capacity. Compression expansion projects on the Iroquois and Algonquin pipelines may be needed to fuel peakers and big plants at Ravenswood and Cricket Valley, as well as for private homes.
If California is a model for New York, it is also an admonition. California is 20 years ahead of us in solar and wind installations and has about 40 percent intermittent capacity. California can boast a solar capacity factor twice what New York gets and has deserts in which to put the panels. Nevertheless, it has extended deadlines for closing gas plants and, with an EPA waiver, has also built new ones. Even with the largest lithium-ion battery in the world, California can’t store summer solar and had to dump about three terawatt-hours of energy last year. Can New York do better? The state Energy Research and Development Authority’s storage projections would cost hundreds of billions of dollars for batteries that might last 10 years. And if all that storage were fully charged, we could not keep the lights on in New York City—let alone the rest of the state—for one day.
New York currently has only about eight percent renewable capacity. To meet a 70 percent-by-2030 renewable target, industrial solar and wind installed over the last 30 years would have to be multiplied six-fold in four years. There is no reason, beyond press releases, to believe this can happen. Rural opposition to solar and wind buildout has also grown. 2020 Executive Law 94-C established the Office of Renewable Energy Siting to speed up installation. ORES can ignore local legislation and even reasonable environmental safeguards in project permitting. Last year’s budget requires communities to use an assessment formula supplied by Albany, cutting tax revenue by up to 80 percent. As reported (4/30/2024 Times Union), a dozen towns in Schoharie are suing the state over the current assessment model. Combined with eminent domain authority for developers to run wire and poles—in this year’s budget—we can expect significantly more pushback from communities. Environmentalists concerned with preservation of farmland and forest, increasing eagle-and-bat deaths, as well as water supply threats from large wind installations, are also raising their voices.
Who will pay for NY HEAT? The cost of a $672-million bailout for a few of the hundreds of thousands of utility customers currently in arrears will be borne by other utility customers. Every New Yorker will help fund subsidies for industrial solar and wind projects which could gobble up a million acres and yet fail to provide reliable electricity.
It continues to be a mistake to let political appointees and Big Green organizers craft energy policy. CLCPA and NY HEAT do not meet the fiscal or engineering standards needed to shape a reliable, carbon-free grid.
Conclusion
This legislation was passed by both the Assembly and the Senate – remember that next November. It currently awaits a decision by Governor Hochul. I urge readers to call 518/ 474-8390 or email the Governor’s office urging her not to sign this legislation.
The lead to the Natural Resources Defense Council (NRDC) blog post Separating Fact from Fiction: Setting the Record Straight on New York’s Climate Law states “Don’t be fooled by the fossil-fueled campaigns to delay climate progress. The Climate Leadership and Community Protection Act is New York State’s chance for a cleaner, healthier future.” It goes on to refute four claims allegedly pushed by fossil fuel industry. I am only going to respond to one of the responses.
I have followed the Climate Leadership & Community Protection Act (CLCPA) since it was first proposed, submitted comments on the CLCPA implementation plan, and have written over 400 articles about New York’s net-zero transition. I am convinced that the CLCPA will adversely affect affordability, reliability, and that the environmental impacts of the proposed transition are greater than the possible impacts of climate change. The opinions expressed in this post do not reflect the position of any of my previous employers or any other organization I have been associated with, these comments are mine alone.
Overview
The CLCPA established a New York “Net Zero” target (85% reduction in GHG emissions and 15% offset of emissions) by 2050. It includes an interim 2030 reduction target of a 40% reduction by 2030 and a requirement that all electricity generated be “zero-emissions” by 2040. The CLCPAion Council (CAC) was responsible for preparing the Scoping Plan that outlines how to “achieve the State’s bold clean energy and climate agenda.” In brief, that plan is to electrify everything possible using zero-emissions electricity. The Integration Analysis prepared by the New York State Energy Research and Development Authority (NYSERDA) and its consultants quantifies the impact of the electrification strategies. That material was used to develop the Draft Scoping Plan outline of strategies. After a year-long review, the Scoping Plan was finalized at the end of 2022. In 2023 the Scoping Plan recommendations were supposed to be implemented through regulation, PSC orders, and legislation.
The NRDC blog post describes the Scoping Plan framework as “pathways for a planned and orderly transition to a clean, resilient energy future.” The Scoping Plan is just a list of potential control strategies that when combined are supposed to meet the CLCPA mandates. A feasibility analysis has never been completed to show that the list of strategies is practical. Furthermore, transparent accounting for the costs of the transition have not been provided and the Cumulative Environmental Impact Assessment has not been updated to account for the Scoping Plan estimates of the wind, solar, and energy storage resources needed.
The CLCPA will result in higher energy costs for ratepayers because it is costly to implement.
The CLCPA will reduce the reliability of energy delivered to homes and businesses.
Your gas stove is going to be taken away from you.
There will be an adverse impact on the state’s overall economic climate that will discourage new investments and job growth.
I am only going to address the response to the second claim that the CLCPA will “reduce reliability of energy delivered to homes and businesses”. The response to that claim states:
The framework outlined by the CLCPA-mandated Scoping Plan provides pathways for a planned and orderly transition to a clean, resilient energy future. The idea of a regenerative rather than an extractive economy strikes fear in the fossil fuel industry, which has been making record profits from recent price fluctuations and market volatility; in reality, reliability failures are often due to fossil-fueled superstorms and the historical lack of investment in our nation’s aging infrastructure. By contrast, homegrown renewable energy can and will be more resilient, more plentiful, and more cost-effective than finite oil and gas resources.
I will address each of these statements. The first sentence states “The framework outlined by the CLCPA-mandated Scoping Plan provides pathways for a planned and orderly transition to a clean, resilient energy future.” As noted previously there has never been a feasibility analysis to determine if the components of the Scoping Plan are practical. The Climate Action Council never resolved the discrepancy between the Council faction that believed that no new technology is needed for the transition and the experts responsible for the system that argued otherwise. A recent technical conference showed that the work of Prof. C. Lindsay Anderson, Chair of Department of Biological and Environmental Engineering Cornell; Zach Smith, VP System Resource Planning, New York Independent System Operator; and Kevin Steinberger, Director, Energy and Environmental Economics all found that a new resource that can be dispatched when needed, is firmly available, and has no emissions is needed. Technologies to meet this requirement are not commercially available at this time. Moreover, no jurisdiction anywhere has been able to convert their electric system to one that relies on wind, solar, and energy storage. Given the myriad technical issues that must be overcome to provide electricity when it is needed most, I think the most prudent course of action would be a demonstration project because the transition to the energy system mandated by the CLCPA would be unprecedented.
The second sentence unnecessarily questions the motivations of those who worry about reliability “The idea of a regenerative rather than an extractive economy strikes fear in the fossil fuel industry, which has been making record profits from recent price fluctuations and market volatility; in reality, reliability failures are often due to fossil-fueled superstorms and the historical lack of investment in our nation’s aging infrastructure.” The concern about profiting from price fluctuations and market volatility is naïve. When the electricity market is dominated by weather dependent generating resources the variability of wind and solar output will increase price fluctuations. The New York Independent System Operator will have to modify the electric market to address this volatility as they learn how this new aspect of the system affects prices. I have been involved with the weather-related impacts on the electric system for over 40 years and it has always been true that extreme weather has the greatest impact on system outages. A common theme throughout this blog post is that all weather events are necessarily related to climate change without acknowledging that extreme weather events exactly like those before the climate change would still have major impacts. Any increase in severity due to climate change is just a tweak and not the primary driver.
The final sentence got my attention: “By contrast, homegrown renewable energy can and will be more resilient, more plentiful, and more cost-effective than finite oil and gas resources.” I wondered how the author managed to claim that extreme weather will have more of an effect on today’s generators in weather proof buildings than the exposed wind turbines and solar panels. The more resilient reference was to the Babcock Ranch a Florida “solar town” that fared well during recent hurricanes. The article claims the town came out of Hurricane Ian “almost unscathed and notes that one resident says they survived ‘by design.’ Florida Power and Light is proud of the Babcock Ranch solar system:
Babcock Ranch’s clean energy efforts were taken to the next level when FPL created the largest solar-plus-storage system operating in the U.S. today. Each of the ten large gray steel battery storage units at the FPL Babcock Ranch Solar Energy Center can store 1 megawatt of power and discharge for 4 hours. The adjacent 440 acres with 330,000 solar panels can generate up to 74.5 megawatts of power. Currently the solar installation generates more power than the town needs, so the surplus goes into the electric power grid. The new battery storage system ensures a steady output of power even on partly cloudy days.
There are two resiliency features that matter: Babcock Ranch was built 30 feet above sea level and all power lines are buried underground to keep them safe from strong winds. New York’s net zero transition does not include buried power lines. The Babcock Ranch website refutes the claim that “homegrown renewable energy can and will be more resilient”:
Electric power always flows from the nearest generation, so during the day the town will use energy from the FPL Babcock Ranch Solar Energy Center. When the sun goes down and the solar plant is not generating energy, Babcock Ranch will pull electricity off the grid from the closest FPL natural-gas power plant.
Babcock Ranch is not clean energy self-sufficient as the Climate Act envisions the entire state will be. The NRDC response also claims that renewable energy is more plentiful and more cost-effective than finite oil and gas resources. It may be true that solar and wind energy is free but harvesting those resources, storing them for when they will be needed during an extended period of light winds in the winter when solar resources are low is an extraordinary challenge that requires the new resource described above. Like all the Green Energy solutions advocated by the NRDC, wind and solar may work well most of the time but when you really need them, they don’t work at all. The concern about finite oil and gas resources ignores the value of their storable concentrated energy and whether running out is a concern in the foreseeable future.
Conclusion
I believe I have shown that the NRDC fact-check claims that the CLCPA energy transition does not threaten reliability are invalid. Ignoring the mounting evidence that this may be an insurmountable challenge is not in the best interest of New Yorkers. At a minimum, CLCPA implementation should be delayed until we are sure that we can afford the CLCPA mandates, prove that the transition will not adversely affect reliability, and understand all the cumulative environmental impacts.
As is typical, whenever someone is screaming about misinformation it usually means that they are guilty of that charge. In addition, trying to respond to this tripe takes an order of magnitude more work to respond. Finally, whenever I make the effort to check the numbers I find the alarmists have their thumbs on the scale and are peddling a narrative to support their livelihoods. I only wish that they could be held accountable when reality slaps their aspirational net-zero transition dreams back to earth.
Pragmatic Environmentalist of New York Principle 6 is Roger Pielke Jr’s: Iron Law of Climate: “While people are often willing to pay some price for achieving climate objectives, that willingness has its limits.” A recent Facebook comment to a National Grid Facebook social media campaign post provides a perfect example related to New York’s Climate Leadership & Community Protection Act (Climate Act).
I have followed the Climate Act since it was first proposed, submitted comments on the Climate Act implementation plan, and have written over 400 articles about New York’s net-zero transition. The opinions expressed in this post do not reflect the position of any of my previous employers or any other organization I have been associated with, these comments are mine alone.
Overview
The Climate Act established a New York “Net Zero” target (85% reduction in GHG emissions and 15% offset of emissions) by 2050. It includes an interim 2030 reduction target of a 40% reduction by 2030 and a requirement that all electricity generated be “zero-emissions” by 2040. The Climate Action Council (CAC) was responsible for preparing the Scoping Plan that outlines how to “achieve the State’s bold clean energy and climate agenda.” In brief, that plan is to electrify everything possible using zero-emissions electricity. The Integration Analysis prepared by the New York State Energy Research and Development Authority (NYSERDA) and its consultants quantifies the impact of the electrification strategies. That material was used to develop the Draft Scoping Plan outline of strategies. After a year-long review, the Scoping Plan was finalized at the end of 2022. In 2023 the Scoping Plan recommendations were supposed to be implemented through regulation, PSC orders, and legislation. Not surprisingly, the aspirational schedule of the Climate Act has proven to be more difficult to implement than planned and many aspects of the transition are falling behind. There is growing evidence that the state will be unable to achieve its goals without significantly affecting the cost of living and doing business in New York and harming the reliability of its electric grid.
National Grid
In my opinion no company doing in business can publicly question the Climate Act narrative without facing the wrath of emotion-driven activists and getting crosswise with the Hochul Administration. Although the Public Service Commission utility rate-making process to establish “just and reasonable” rates is supposed to be apolitical, the old days when governors appointed Commissioners from both parties to maintain balance are gone. I have no doubt whatsoever that any utility that does not encourage electrification to save the environment at every opportunity would find itself not getting their rate case proposals approved. Moreover, an electric utility has incentives to sell more electricity. The problem is that electrification everywhere is not a pragmatic solution.
I am in the former Niagara Mohawk Power Corporation service territory now served by National Grid New York. Given the political climate of New York it is no surprise that National Grid advocates for the “Journey to net-zero”. I am not a big social media person but do get on Facebook occasionally. Frequently, there are posts from National Grid advocating for the latest and greatest gadgets for electrification. For example, the following recently showed up.
There were options for different “learn more” links. What caught my eye was the following comment to this post. It the perfect example of Pielke’s Iron Law:
The Iron Law can be described as wallets have limits. Beyond the simple cost impacts there is another concern. The National Grid Upstate New York Residential Gas Heating program is paused and not accepting rebate applications. National Grid is forgoing efficiencies now to encourage adoption of cold-climate heat pumps. This is disservice to National Grid ratepayers because it does not acknowledge thatthe State’s Scoping Plan to implement the Climate Act notes that not all homes will be able to electrify home heating safely and affordably. Exactly the case in this example. It is not only that there is a cost factor but there is a safety factor for electrification. Removing incentives for homeowners that have no other choices is short-sighted.
Conclusion
Implementation of the Climate Act is going to affect affordability and safety. The public is starting to catch on to these impacts. It is time to pause implementation until the Hochul Administration provides comprehensive and transparent cost estimates for the transition and the Public Service Commission provides a plan to ensure safe and reliable service to electric customers for an electric system that relies on wind and solar. The utility industry is not going to step up and ask for an implementation pause so it is up to the voters of the state to make their concerns known.
According to New York climate activist non-governmental organizations New York is “failing to lead on climate.” Sane Energy Voice claims that following Governor Hochul’s scrapping of major offshore wind projects, Assembly Speaker Heastie’s decision to ditch the popular NY HEAT Act signifies New York’s failure to lead on climate. Richard Ellenbogen responded to the press release with an email that I reproduce here.
Richard Ellenbogen recently submitted comments as part of the record for the Department of Public Service Proceeding 15-E-0302 related to the net -zero mandate of the Last spring “Order initiating a process regarding the zero-emissions target” that will “identify innovative technologies to ensure reliability of a zero-emissions electric grid”. His comments discuss “a viable, affordable, and rapidly executable Plan B to assist NY State in reducing its carbon footprint using technologies that actually exist at scale, unlike the technologies proposed by the CLCPA which only exist at scale in the fantasies of its proponents.” I think it is important that his message gets out to all New Yorkers to try to avert the inevitable collision between aspiration and reality.
Ellenbogen is the President [BIO] Allied Converters and frequently copies me on emails that address various issues associated with the Climate Leadership and Community Protection Act (CLCPA). I have published other articles by Ellenbogen, a description of his keynote address to the Business Council of New York 2023 Renewable Energy Conference Energy titled: “Energy on Demand as the Life Blood of Business and Entrepreneurship in the State -video here: Why NY State Must Rethink Its Energy Plan and Ten Suggestions to Help Fix the Problems”, another video presentation he developed describing problems with CLCPA implementation and a summary of his submitted comments as part of the record for the Department of Public Service Proceeding 15-E-0302 related to the CLCPA net -zero mandate. There are only a few people in New York that are trying to educate people about the risks of the CLCPA with as much passion as I am, but Richard certainly fits that description. He comes at the problem as an engineer who truly cares about the environment and how best to improve the environment without unintended consequences. He has spent an enormous amount of time honing his presentation summarizing the problems he sees but most of all the environmental performance record of his business shows that he is walking the walk.
CLCPA Overview
The CLCPA established a New York “Net Zero” target (85% reduction and 15% offset of emissions) by 2050. It includes an interim 2030 reduction target of a 40% reduction by 2030 and a requirement that all electricity generated be “zero-emissions” by 2040. The Climate Action Council (CAC) is responsible for preparing the Scoping Plan that outlines how to “achieve the State’s bold clean energy and climate agenda.” In brief, that plan is to electrify everything possible using zero-emissions electricity. The Integration Analysis prepared by the New York State Energy Research and Development Authority (NYSERDA) and its consultants quantifies the impact of the electrification strategies. That material was used to develop the Draft Scoping Plan. After a year-long review, the Scoping Plan recommendations were finalized at the end of 2022. In 2023 the Scoping Plan recommendations were supposed to be implemented through regulation and legislation. For the most part that did not happen so in 2024 organizations like Sane Energy Voice are lobbying for various legislation to advance their agendas.
NY Heats
According to a report released by NY Renews, the if the full NY Home Energy Affordable Transition bill were passed “the 25% of New York residents who have high energy burdens would cut their bills by over 44% and save an average of $136 a month.” The mission of Sane Energy Project is to replace fracked gas infrastructure with 100% democratically controlled, renewable energy in New York State. We build every campaign through a lens of racial, social, and ecological justice.
Richard Ellenbogen responded to this press release:
In a one-two punch this past week, a small group of corporate-backed Democratic legislators brought us closer to climate catastrophe by bowing to fossil fuel lobbyists and lawyers in shaping New York’s energy and economic policy. Now, more than ever, it’s time to fight hard and resist this insidious takeover.
Last Friday, under the leadership of Governor Kathy Hochul, the New York State Energy and Resource Development Authority (NYSERDA) rejected three major offshore wind projects that Sane Energy Project had championed since 2015 when we led the campaign to stop the construction of a massive offshore liquefied fracked gas port complex near the Rockaway Peninsula and Long Beach that would have foreclosed the development of these wind projects.
Also on Friday, the final New York State budget omitted the critical NY HEAT Act, which over 100 legislators co-sponsored. The New York Home Energy Affordable Transition Act would have facilitated an orderly transition from expensive and toxic fracked gas by ending subsidies that enrich the gas industry. Moreover, it would have capped energy bills for low- and middle-income households at 6% of their income, a crucial measure for safeguarding vulnerable New Yorkers.
Every year in Albany, a handful of officials determine the state’s future. Swayed by energy industry lobbyists, they disregard scientific evidence, the climate law, and constituents’ demands. Our elected officials’ failure to champion sound energy policy sets a dangerous precedent.
Kim Fraczek, Director of Sane Energy Project, said, “Governor Hochul and Assembly Speaker Carl Heastie have chosen to prioritize corporate interests over the well-being of New Yorkers by scrapping significant offshore wind projects and excluding the crucial NY HEAT Act from the state budget. Their inaction is further underscored by National Grid’s egregious proposal to increase monthly bills for downstate residents by at least $30 to maintain their outdated, polluting gas system. We hold Hochul and Heastie responsible for future utility bill hikes and climate disasters, as their decisions blatantly ignore the urgency to transition to renewable energy and protect the most vulnerable communities.”
Current negotiations surrounding National Grid’s proposed rate hike threaten to tighten the fossil fuel industry’s grip on New Yorkers. Sane Energy Project is focused on state regulators, who can choose energy efficiency and investment in thermal energy networks or perpetuate wasteful investments in National Grid’s antiquated gas system.
Before I describe Ellenbogen’s response I want to address the offshore wind projects. The emotion laden description of recent events: “Swayed by energy industry lobbyists, they disregard scientific evidence, the climate law, and constituents’ demands” is at odds with reality. NYSERDA did not want to reject the three major offshore wind projects. Instead, “GE Vernova’s decision to alter its offshore wind turbine product from the initially proposed 18 MW Haliade-X platform to a 15.5/16.5 MW platform resulted in significant changes to the projects proposed into the solicitation.” When NYSERDA announced the contract awards last October all the subcontractor agreements should have been clearly identified and signed off by all parties involved in the work, including things like what equipment, what labor costs, you name it. After an award there is some negotiation but that should not be a big lift because the details were already identified in the proposal/budget. The size of the turbines should have been specified in the proposal. If GE as a subcontractor then changed the deal it would make the whole proposal unfundable. This is the last thing NYSERDA and Governor Hochul wanted because it means a big delay in the timeline as they need to have go back for another round of approvals and new contracts.
Ellenbogen on NY Heats
Other than a few formatting edits the following is all by Ellenbogen.
While I appreciate your passion, the science behind your email is misguided. As someone that decarbonized my home and business over two decades ago as the two following links document, I can assure you that there is nothing “sane” about NY Heats. It will literally be a death knell for both NY State residents and the state economy with absolutely no benefit to the environment. FYI, I have absolutely no interests in the fossil fuel industry but as an engineer for over forty years, I have a firm belief that all public policies have to be based upon scientific accuracy. NY Heats and the CLCPA throw science and math out the window.
In a climate like NY State’s, NY Heats defies the Laws of Thermodynamics beyond there also being enormous logistical issues with implementing it.
It will double or triple the load on every transformer in the state meaning that they will all have to be replaced, except those transformers don’t exist and there is an acute transformer shortage in the entire US at the moment. The doubling or tripling of load will also mean replacing all of the wires in NY State which will take about 60 years. Further, that will require an enormous amount of aluminum and there isn’t enough aluminum available to make beverage cans, let alone millions of miles of electrical conductors. Three aluminum smelters have closed in the United States in the past two years because their electric rates were too expensive, which is indicative of a shortage of electricity driving up the prices. There have been numerous articles written recently that indicate that the United States is running out of energy.
That same electric shortage will also provide insufficient energy to operate the heat pumps that would be installed under Local Law 97 and NY Heats. Despite everyone’s wishful thinking, renewables are too intermittent and have too low of an energy density to successfully operate the expanded utility system that would be required under NY Heats. The NYS Public Service Commission is desperately looking for DEFR’s (Dispatchable Emission Free Resources) except with the exception of Nuclear which takes 17 years to get approved and sited, that technology does not exist and it is decades away so any increases in load that would result from NY Heats will increase fossil fuel generation where it is far less efficient than the onsite combustion of Natural Gas. The NYISO is already having difficulty meeting the scheduled deadline for closing the fossil fuel peaker plants and has extended their closing dates. That is going to be repeated extensively because there just isn’t enough energy and adding more solar panels and wind turbines will complicate that effort after a certain point. Look at what is currently happening in California. They are dumping solar because they over subsidized it and there is too much. The storage technology needed to utilize it is far too expensive to implement at that scale. If you look at NYSERDA’s 6 GW Enregy Storage report from 2022, they indicated that 1000+ hours would be needed to support the system. Even at 1000 hours for 6 GW at the price of storage in the report, that would cost $3.5 Trillion, or 15 times NY State’s annual budget and those batteries would last only ten years and have to be replaced. While battery costs have come down slightly since 2022, it has not been nearly enough to make them cost effective. The physics and the economics just don’t work. It has also been clearly documented that air source heat pumps double utility bills. That higher cost is a function of the holistic system wide energy inefficiencies of the air source heat pumps. Hydrogen storage technology is decades away at the utility scale needed. It is very difficult to store and transport and it presents its own GHG issues if it leaks.
There is insufficient labor to execute the plan. There is a shortage of both electricians and plumbers and worse, there are not enough people to train even if they could develop the training programs. There are currently 500,000 open manufacturing jobs in the US, the same cohort of people that would be used for renewable and heat pump installation. The unemployment rate is near historic lows. Further, one thing that no one should want is inexperienced people handling the refrigerants involved with heat pump installation as those have carbon footprints 300 – 1000 times higher than CO2 and 10 – 30 times higher than methane. The leakage that will result from inexperienced workers handling refrigerants would be devastating. A Columbia University study indicated that one-half of Arctic ice melt resulted from the use of refrigerants.
Regarding Offshore Wind, those bids were declined because the costs were far higher than the current electric rates. If the state has any hope of decarbonizing, alienating 60% of its population downstate with exorbitant electric rates is not the way to do it. That is especially true when 1.2 million downstate utility customers are already $1.8 billion in arrears. Further, the ships needed to install the offshore wind don’t exist at present. The first Jones Act compliant ship, the Dominion Charybdis left dry dock last week. The $650 million vessel is taking five years to build and will not be ready until late 2024/ early 2025. If they start another now, it will not be ready until 2028- 2029. The lack of the ships raises the installation costs far above where they otherwise would be which explains why the bids here are about double those in Europe where they have about 16-18 available jack ships. The balance of the world’s approximately 50 jack ships are in Southeast Asia. Energy cost increases resulted in the repeal of the Ontario, Canada energy plan after only 10 years. The same thing will happen in NY State if they aren’t careful.
Decarbonization is necessary but it must follow the Laws of Physics and be mathematically possible to implement. The NY State plan doesn’t adhere to those requirements. There are things that adhere to science and mathematical accuracy that can be done to reduce the state’s carbon footprint but the CLCPA and NY Heats do not fall within that criteria.
Conclusion
In an email Ellenbogen concludes that “For anyone that understands energy math, the bill is a farce. The points made in it also don’t adhere to economic reality for the residents of NY State.” I completely agree with his conclusions.
The New York State Department of Environmental Conservation (DEC) has proposed Amendments to Part 490, Projected Sea Level Rise andComments that are due on April 29. This post describes my comments on the proposed amendment and requests that New Yorkers who reading this before April 29 submit comments. Don’t worry, I will give language.
The proposed amendments revise the projections of future sea-level rise required by New York regulations. It is flawed because the methodology estimates an unrealistically high projected sea-level for the Community Risk and Resiliency Act flood risk management applications that will use the projections. Unless more realistic estimates are used permitting applications in areas near tidal zones will be required to incorporate flood levels that will not be expected in the lifetime of the project. That would be a hidden cost for the net-zero transition of the Climate Leadership & Community Protection Act (Climate Act).
I have followed the Climate Act since it was first proposed, submitted comments on the Climate Act implementation plan, and have written over 400 articles about New York’s net-zero transition. The opinions expressed in this post do not reflect the position of any of my previous employers or any other organization I have been associated with, these comments are mine alone.
Overview
The summary of the Part 490 proposed amendments states that: “The goal of the proposed amendments is to provide up-to-date science-based projections of future sea level rise.” This is another example of the many ways that the Climate Act is intruding on many aspects of society. The Climate Act established a New York “Net Zero” target (85% reduction in GHG emissions and 15% offset of emissions) by 2050. It includes an interim 2030 reduction target of a 40% reduction by 2030 and a requirement that all electricity generated be “zero-emissions” by 2040. The Climate Action Council (CAC) was responsible for preparing the Scoping Plan that outlines how to “achieve the State’s bold clean energy and climate agenda.” In brief, that plan is to electrify everything possible using zero-emissions electricity. The Integration Analysis prepared by the New York State Energy Research and Development Authority (NYSERDA) and its consultants quantifies the impact of the electrification strategies. That material was used to develop the Draft Scoping Plan outline of strategies. After a year-long review, the Scoping Plan was finalized at the end of 2022. In 2023 the Scoping Plan recommendations were supposed to be implemented through regulation, PSC orders, and legislation but implementation is behind schedule. The proposed amendments to the sea-level projections are a hidden aspect of the Climate Act that has significant potential impacts.
Part 490 Projected Sea-Level Rise
The Regulatory Impact Statement (RIS) for this proceeding describes the regulation’s statutory authority and legislative objectives, the proposed changes, needs and benefits, and costs. It explains:
On September 22, 2014, the Community Risk and Resiliency Act, Chapter 355 of the Laws of 2014 (CRRA), was signed into law. CRRA, among other things, established Environmental Conservation Law (ECL) § 3-0319. ECL § 3-0319 requires the Department of Environmental Conservation (Department) to adopt regulations establishing science-based sea level rise projections for New York State and to update them no less than every five years. The Department established a new Part 490 of Title 6 of New York Codes, Rules, and Regulations (6 NYCRR), “Projected Sea-level Rise” (Part 490) in February 2017 and is updating the regulation through the current rulemaking.
The proposed amendments are an update of the 2017 sea-level rise projections. While I am not absolutely sure I believe the reason that this amendment was delayed was because the primary reference, New York Research & Development Authority New York State Climate Impacts Assessment, was not available within the five-year period. Even so, the documents for the Assessment are all marked “Interim Version for Public Release” which calls into question their use for a policy document.
The goal of the proposed amendments is to provide up-to-date science-based projections of future sea level rise. Part 490 does not create a mandate on local governments. Part 490 does not impose any compliance obligations on any entity.
While technically and legally correct, the excuse not to include costs and the argument that there are no compliance obligations or mandates on local governments has significant ramifications. The fact is that there are compliance obligations that are affected by the Part 490 rulemaking. DEC selectively chose to emphasize analyses that support the “high-end storyline” without regard to how the sea-level rise projections will be used. There are relevant, plausibility, timing, and cost implications that I believe should be added to the Regulatory Impact Statement.
As originally enacted, the CRRA required applicants for permits or funding in a number of specified programs to demonstrate that future physical climate risk due to sea-level rise, storm surge and flooding had been considered in project design, and that DEC consider incorporating these factors into certain facility-siting regulations. The CLCPA amended the CRRA to include all permits subject to the Uniform Procedures Act. The CLCPA also expanded the scope of the CRRA to require consideration of all climate hazards, not only sea-level rise, storm surge and flooding, in these permit programs.
In my comments I argued that that while Part 490 may not directly create a mandate on local governments, all permits must consider the sea-level rise climate hazard which is essentially a mandate affecting all governmental agencies.
Part 490 Proposed Amendments
The RIS description of the proposed sea-level rise projection amendments with my annotated comments follows:
Table 4. Updated projections of sea level rise for three tidal regions of New York State, based on the Department’s proposed methodology. Projections are in inches, relative to a 1995-2014 baseline, and are based on a combination of the SSP2-4.5, SSP5-8.5-medium-confidence and SSP5-8.5-low-confidence projections, with the addition of a RIM scenario.
Part 490 is intended to give permitting authorities information on the full range of potential sea-level rise. In reality the CRRA design considerations that use the sea-level rise projections focus on the highest values. New York State Flood Risk Management Guidance for Implementation of the Community Risk and Resiliency Act states that “Applicants and programs are also encouraged to consider the following during project siting, design and review” states:
Applicants for projects involving new or replacement critical infrastructure should consider the full range of projected flooding, including the highest adopted projections of sea-level rise, during the expected service life of the project. Where adherence to the highest guideline is not feasible, due to practicality, costs, risk tolerance, and/or environmental effects, applicants should carefully describe and justify designs not adhering to the most restrictive guideline.
Note the requirement to use “the highest adopted projections of sea-level rise” includes the caveat to consider the “expected service life of the project”. That is missing piece in the RIS. The RIS emphasizes the point that the Intergovernmental Panel on Climate Change (IPCC) has not indicated the relative probabilities that any of the illustrative scenarios included in the latest assessment report (AR6) will occur. However, CRRA infrastructure applications need to consider the likelihood of sea-level rise levels to determine practicality, costs, risk tolerance, and/or environmental effects. The RIS argues that focusing on the most probable outcome has risks and warns of much higher potential sea-levels.
Furthermore, Hinkel et al. (2015) warn that sea level rise projections based on process-based models, such as those used by IPCC, are primarily intended for the purpose of understanding earth system physics and are not appropriate for risk-based decision making as they do not fully incorporate the effects of accelerated ice melt. They warn that projections based on the IPCC AR5 projections of mean global sea level rise of 11 to 39 inches by 2100 may not be adequate for risk management due to the intolerably high residual risk associated with rapid ice melting Parris et al. (2012) also cautioned that focusing only on the most probable outcome could lead to vulnerability or maladaptation.
The reference to “intolerably high residual high residual risk associated with rapid ice melting” ignores the expected service life of the project consideration. The RIS explains that the decision makers need to understand the full range of potential risk but does not acknowledge that their presentation of results discourages the use of anything but the high projections. The result is that development near the tidal shoreline is planning for extremely high projected sea-level rise. A New York City project to increase a park to handle 8 to 10 feet of sea-level rise is include in “a $1.45 billion flood protection project that backers say befits the nation’s largest city, a massive project that will include the construction of a 2.4-mile system of walls and gates along the East River”. That is only a fraction of the harbor front in the City so it makes sense to use more reasonable estimates of sea-level rise given the need to protect the entire harbor of New York, but it is easier for DEC to just recommend the biggest number to “be safe”.
Decision makers, including residents and local leaders, should understand the full range of potential risk. Communities and stakeholders in New York State that have been presented with the ClimAID projections have tended to adopt and plan for high levels of sea level rise rather than more moderate levels. These stakeholders have placed a high degree of importance on ensuring the viability of proposed infrastructure investments and the social and economic fabric of their communities from even unlikely eventualities.
The “science-based” regulation and the guidance did a disservice to New Yorkers because the risk management approach did not adequately address tradeoffs between costs and likelihood of “unlikely eventualities”. The sea-level rise projections rely on cherry-picked studies and ignoring any work that does not fit the extreme scenario used and that is not “science”. Unlikely things that just might happen in the distant future are not “eventualities”. All the extreme sea-level rise projections use the implausible high emissions scenario embodied in Representative Concentration Pathway (RCP) or Shared Socio-economic Pathways (SSP) RCP/SSP8.5. There is overwhelming evidence that the coal use, population growth, and neglect to consider any decarbonization policy assumptions in those scenarios are inconsistent with observed reality. The National Oceanic Atmospheric Administration (NOAA) Geophysical Fluid Dynamics Laboratory (GFDL) description of their globcal climate modeling approach that states “SSP5-8.5 is a very high greenhouse gas emissions scenario – and unlikely to happen – where carbon dioxide emissions triple by 2075″ and does not use it for their recommended projections.
Notwithstanding the arguments in the following paragraph from the RIS trying to justify its use, the fact is that using these projections are inappropriate to use in this context. I do not dispute that the potential for rapid ice melt exists that would cause a spike in sea levels. However, I maintain that is improper to use in this context because it is a low probability event but that in the time frame of CRRA infrastructure projects it is a much lower possibility. The argument that Part 490 guidance must address sea level rise that will “likely occur at some point” without consideration of the use of the projections is inappropriate. The State simply cannot afford the ramifications of the insistence to remove risk entirely.
Finally, as explained above, sea level rise will continue for many centuries as the earth system comes into equilibrium over many centuries or even millennia. Thus, the question for decision makers is not if a critical sea level will be reached, but when. Strauss (2013) calculated that historic emissions have already committed the globe to a mean sea level rise of 6.2 feet. Levermann et al. (2013) estimated that the current international target of 2°C warming will result in an eventual mean global sea level rise of more than 15 feet after 2000 years. Thus, a full range of projections in Part 490 that includes higher values is appropriate to allow for consideration of a level of sea level rise that will likely occur at some point, even if the timing of such occurrence is uncertain. The Department acknowledges that current GHG emissions policies would result in actual emissions lower than projected by SSP5-8.5. Thus, the inclusion of higher projections of sea level rise, especially those based on SSP5-8.5, could lead to consideration of conditions that are unlikely to occur, at least in the more immediate future. Unfortunately, current literature does not provide a basis for assessment of the emissions levels at which ice shelf and marine ice cliff instability, important factors in sea level rise in high emissions scenarios, such as SSP5-8.5, become significant.
This paragraph characterizes my concern that the purpose of the sea-level rise projections was not considered enough. Preparing for the next 2000 years for a city that was founded only 400 years ago is silly.
This gap in the literature, however, does not relieve decision makers from the responsibility to at least consider the potential consequences of future events about which scientific uncertainty remains. Adoption of several levels of projections allows for consideration of risk tolerance in decision making. The high or RIM projections might be used for long-term projects for which there is low risk tolerance, for example, while lower projections may be appropriate for consideration in situations in which risk tolerance is high. Inclusion of low-confidence, but plausible, projections provide benchmarks against which long-term decisions, e.g., those regarding critical infrastructure and land-use change, can be evaluated for high-consequence events. If Part 490 did not include higher projections of sea level rise, decision makers would not be able to even consider the possibility of such levels occurring. The Department proposes, therefore, to adhere to the recommendation of Stammer et al. (2019) to include “high-end storylines,” that reflect physical processes about which high uncertainty exists, i.e., the RIM scenario, with probabilistic projections.
The last paragraph in this section clearly describes the misguided DEC approach. There is no question that decision-making when there is high scientific uncertainty is difficult. From a risk management perspective all factors must be considered. In this instance, the recommendation to use the higher sea-level rise projections for long-term projects does not consider CRRA infrastructure life expectancies which are shorter than the time frame of the high-risk impacts. Furthermore, it can be argued that the “low” confidence sea-level rise estimates are “no” confidence events because they rely on SSP-8.5 which is implausible. I do not believe that a “high-end storyline” approach is appropriate for regulatory guidance.
Summary of My Comments
My detailed comments describe the observed sea-level rise at the Battery monitoring station in New York City, the methodology used to project sea-level rise, and compare the sea-level rise projections and observations (table below). The following table compares the projected sea-levels using the observed from 1850 to present and 1984 to present with the projections of sea-level rise. Importantly the observed sea-level rise is less than the 50th percentile, “medium confidence” Part 490 sea-level projections. In other words, the observations indicate that the medium confidence projections are conservative estimates of sea-level rise. I also found that comparing the acceleration of sea-level rise necessary to comport with the projected rates with the observations indicates that there is no sign that the “high-end storyline” projections are realistic.
Compare 2024 proposed sea level rise projections (inches of rise relative to 1995-2014 baseline) to sea-level rise projected using observed trends since 1850 and 2014 at the Battery Monitoring Station
The RIS argues that observed sea-level rise projections are not appropriate to use for future estimates because they do not account for projected global warming. To address this concern the Energy and Environmental Alliance of New York proposed a “pledge and review” alternative approach in 2016. My comments argue that this is a better approach. Given the uncertainties of modeling both global warming and the associated sea-level rise along with the model over-estimates of warming it is prudent to assume that the sea-level trend observed over the last 150 years will continue until the observations indicate otherwise.
There is a section in my comments that describes how the sea-level rise projections are intended to be used for flood risk management. The RIS does not consider that flood risk management must incorporate probability of occurrence. The Part 490 sea-level rise projections do not because of the emphasis on the “high-end storyline”. Even though the RIS appropriately describes all the scenarios and how the data were collected and used, the RIS risk analysis is flawed because it does not weigh potential results against benefits and consequences. The comments describe a more appropriate risk management approach.
Summary of Recommendations
The sea-level rise projections in the proposed amendment need to be reconsidered. The over-arching problem is that the low-likelihood, high-impact storyline that incorporates the rapid ice melt scenario is dependent upon the RCP/SSP 8.5 high emissions scenario and does not account for the near-term applicability of the sea-level projections for CRRA applications. Even the RIS acknowledges that “current GHG emissions policies would result in actual emissions lower than projected by SSP5-8.5.” Because the high greenhouse gas emissions are a necessary condition for the rapid ice melt low-likelihood, high impact scenario, that emissions scenario should not be used for sea-level rise recommendations. Furthermore, the timing of the rapid ice melt scenario is extremely unlikely to occur in the time frame of infrastructure projects in the New York State Flood Risk Management Guidance for Implementation of the Community Risk and Resiliency Act guidance that refers to Part 490 sea-level rise.
The RIS claims that because Part 490 “will not impose any costs on any entity because the regulation consists only of sea level rise projections and does not impose any standards or compliance obligations” that no costs are associated with Part 490. However, the pertinent cost issue is the difference between the recommended alternative and the alternatives described in the RIS. The “high-end storyline” approach has an impact on costs and the failure of the RIS to address them is a disservice to the citizens who will have to foot the bill. The RIS should be modified to compare costs with the alternatives included.
Any projection that uses the RCP/SSP 8.5 high emissions scenario overestimates sea-level rise values. Given the acknowledged uncertainties with sea-level projections and the over-predictions of global warming with current global climate models, the pledge and review approach should be used to determine if accelerated sea-level rise consistent with the “high-end storyline” projections are observed. The sea-level projections consistent with SSP2-4.5 should be used because these sea level rise projections are associated with the most likely conservative estimates of potential emissions and the numbers are consistent with observed sea-level rise. If future observations indicate that this scenario is no longer conservative then the projections can be modified accordingly.
How To Provide Written Comments
I encourage my New York readers to submit written comments by the 5:00 PM April 29, 2024 deadline. I have prepared a detailed explanation of the process at this link. The link also includes a condensed comment that addresses the key points described above.
Copy the comment text in the link into the body of your email.
Submit it
If you are inexperienced with the DEC rulemaking process let me explain what happens next. If you are lucky, you will get an acknowledgement that your comment was received. DEC staff are required to read the public comments and the rulemaking requires a response to comment document. At some point there will be a document that includes a response to each comment and recommendation. It would be especially useful if you have a specific example of a concern related to the projections to include that in your comments. If you prepare your own comments, then they will have to respond to that separately, but all the comments submitted using my recommendation will be consolidated. Reading comments and writing a response does not mean DEC will change anything in their proposed rulemaking.
I have submitted comments for countless proceedings over the last 40 years. Sadly, over the years DEC has become more and more politically driven to the point now that all rulemaking policy decisions are ultimately decided by the Administration regardless of the science. To increase the chance that any of the comments and recommendations will actually be implemented, I suggest sending a copy to your legislators. Like most of the Climate Act implementation components very few people know what is happening and the ramifications of the actions. If the legislators start asking the Administration questions about the use of implausible scenarios that will make development near the shorelines more expensive, there may be a political response towards consideration of tradeoffs. Absent that the only solace is the record will show that the State was warned that their policies were ill-advised when the proposed sea-level recommendations fall far below the observed rise.
The rule-making process includes a perfunctory public hearing. The Part 490 hearing was held on April 22. The hearing officer described the rule making process and Mark Lowery from DEC went through the following slide. That was all over in ten minutes. Two people signed up to give comments. I signed up but could not talk because of a persistent cough. The other person’s comments were totally unrelated. She wanted to thank DEC for setting up raptor nesting boxes. For the record all comments are considered equally so nothing was lost. In fact, I showed up for a hearing one time and a friend from DEC who was working on the proceeding basically said the hearings were a waste of time and that they preferred the written comments.
Conclusion
Given the poor turnout for the public hearing, there does not appear to be much interest in this rulemaking. I doubt that these comments and recommendations will have any effect on the rulemaking because there is too much institutional inertia. The record for some rulemakings makes a big deal about the number of comments that support their position. If the negative comments outweigh those supporting the proposal, then it will be interesting to see how the documentation spins that. In order to find out please, submit a comment. Thanks.