

This article was cross-posted at Watts Up With That
Cap-and-invest emission reduction programs are supposed to effectively reduce emissions and generate revenues. The Regional Greenhouse Gas Initiative (RGGI) is an electric sector cap-and-invest program in the NE United States that can provide insight into the potential of these programs. This post reviews the latest RGGI annual Investments of Proceeds report to determine how well the investments are producing emission reductions and the lessons that should be kept in mind from the observed results.
I have been following the Climate Leadership & Community Protection Act (Climate Act) since it was first proposed. I submitted comments on the Climate Act implementation plan and have written over 300 articles about New York’s net-zero transition. I also have been involved in the RGGI program process since its inception. I blog about the details of the RGGI program because very few seem to want to provide any criticisms of the program. The opinions expressed in this post do not reflect the position of any of my previous employers or any other company I have been associated with, these comments are mine alone.
Background
RGGI is a market-based program to reduce greenhouse gas emissions. According to RGGI:
The Regional Greenhouse Gas Initiative (RGGI) is a cooperative effort among the states of Connecticut, Delaware, Maine, Maryland, Massachusetts, New Hampshire, New Jersey, New York, Pennsylvania, Rhode Island, Vermont, and Virginia to cap and reduce power sector CO2 emissions.
RGGI is composed of individual CO2 Budget Trading Programs in each participating state. Through independent regulations, based on the RGGI Model Rule, each state’s CO2 Budget Trading Program limits emissions of CO2 from electric power plants, issues CO2 allowances and establishes participation in regional CO2 allowance auctions.
RGGI Proceeds Investment Report
The 2021 investment proceeds report was released on June 27, 2023. According to the press release:
The participating states of the Regional Greenhouse Gas Initiative (RGGI) today released a report tracking the investment of proceeds generated from RGGI’s regional CO2 allowance auctions. The report tracks investments of RGGI proceeds in 2021, providing state-specific success stories and program highlights. The RGGI states have individual discretion over how to invest proceeds according to state-specific goals. Accordingly, states direct funds to a wide variety of programs, touching all aspects of the energy sector.
In 2021, $374 million in RGGI proceeds were invested in programs including energy efficiency, clean and renewable energy, beneficial electrification, greenhouse gas abatement, and direct bill assistance. Over their lifetime, these 2021 investments are projected to provide participating households and businesses with $1.2 billion in energy bill savings and avoid the emission of 4.4 million short tons of CO2.
I reviewed the report on my blog. I did not submit that review for publication here because there was nothing notably different in the annual claims that RGGI successfully provides substantive emission reductions. The avowed purpose of the program is to reduce CO2 from the electric generating sector to alleviate impacts of climate change and the report provides data to support its “success”. However, the report does not directly provide the information necessary to determine annual emission reductions that can be used to compare with emission targets. New York, for example, has targets based on 2030 emissions relative to a 1990 baseline. Lifetime emission reductions are irrelevant to evaluate the status of that metric.
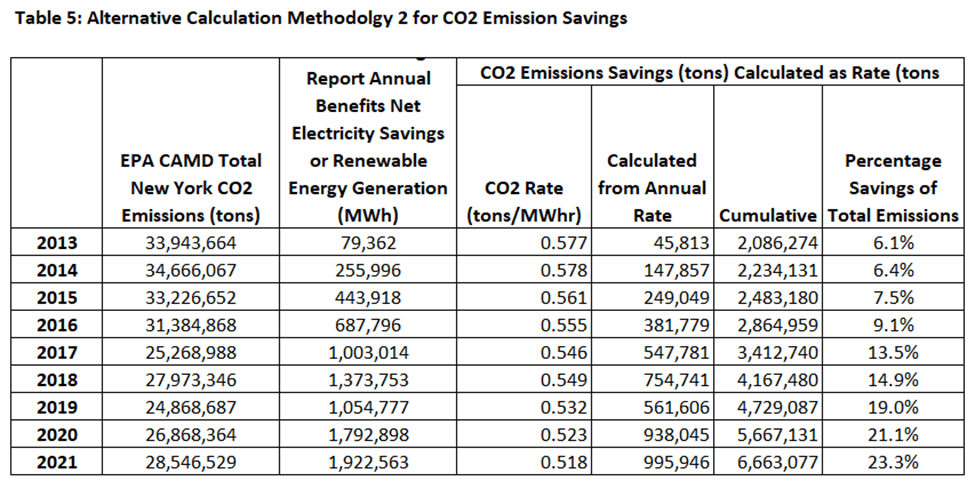
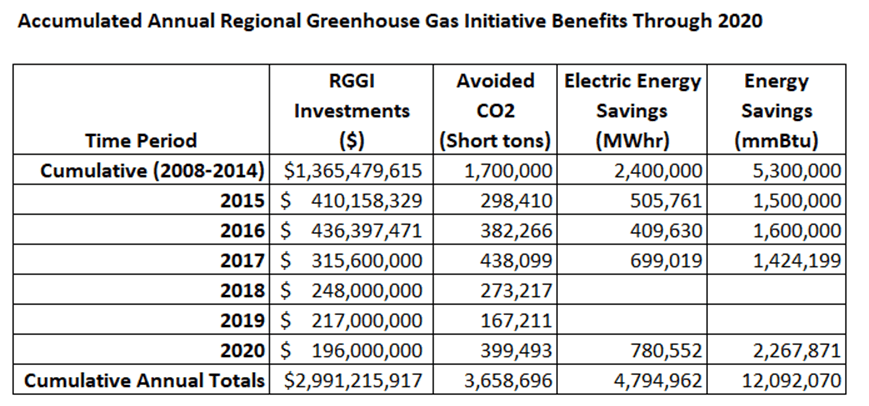
The press release and report claim 4.4 million short tons of avoided lifetime CO2 emissions. However, the sum of the annual CO2 emissions reductions is only 235,229 short tons. I found that since the beginning of the RGGI program RGGI funded control programs have been responsible for 6.7% of the observed reductions. When the sum of the RGGI investments is divided by the sum of the annual emission reductions the CO2 emission reduction efficiency is $927 per ton of CO2 reduced. I concluded that although RGGI has been effective raising revenues, it is not an effective CO2 emission reduction program.
New York is planning its version of cap-and-invest and when I started an evaluation of the different investments made, I wanted to make the point that some investments are more appropriate than others because of cost-effectiveness differences. During the analysis I realized that there were lessons to be learned that are relevant to all these programs so I submitted this article for publication here.
RGGI Investment Summary
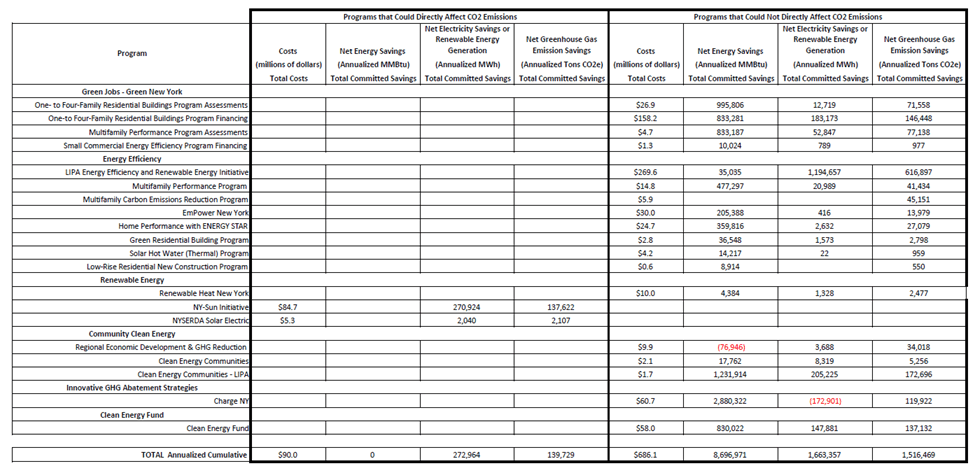
The 2021 investment proceeds report (“Investment Report”) breaks down the investments into five major categories. I summarized the claimed benefits of the RGGI investments in Table 1. The Investment Report only lists the percentage of revenues for each category so I calculated the investments per category by multiplying the total revenues by each percentage share.

In the following sections I discuss the results for each sector.
Energy efficiency
The Investment Report states:
Energy efficiency remains the largest portion of 2021 RGGI investments, at 51%. Over the lifetime of the installed measures, 2021 RGGI investments in energy efficiency are projected to save participants over $417 million on energy bills, providing benefits to more than 34,000 participating households and 570 participating businesses. They are also projected to avoid the release of 2.3 million short tons of CO2 (see Table 2).

The Investment Report explains how the investments are used:
Energy efficiency improvements can be achieved cost-effectively by upgrading appliances and lighting, weatherizing and insulating buildings, upgrading HVAC at offices, and improving industrial processes. For example, occupancy sensors automatically turn lights off when a room or building is not in use, saving significant amounts of energy. These programs allow consumers and businesses to take full advantage of modern appliances, heating, and cooling, increasing the comfort of homes, offices, and businesses while using less energy and saving on their energy bills.
Proponents of green energy investments always talk up the jobs created. Table 1 notes that $191 million was invested in energy efficiency projects and the following text claims that the projects created 427 direct job-years. Dividing the total revenues by the job-years yields that each job year cost $446,698.
Energy efficiency also creates jobs. Programs such as home retrofits directly spur employment gains in housing and construction, with 2021 RGGI investments projected to create an estimated additional 427 direct job-years across participating states. Lower energy costs also create numerous benefits across the economy, allowing businesses to expand and families to save and invest in other priorities.
The Investment Report goes on to extol the virtues of energy efficiency program benefits and claims that RGGI states have made the “region a leader in this field.” Not mentioned is that energy efficiency is not a very effective annual CO2 emission reduction tool. On an annual basis these investments reduced CO2 emissions by 114,547 tons and at a total cost of $191 million that means the reductions cost $1,665 per ton. New York must reduce its building sector emissions about 25 million tons by 2030. If energy efficiency were the only reduction strategy used the cost would be over $41 billion.
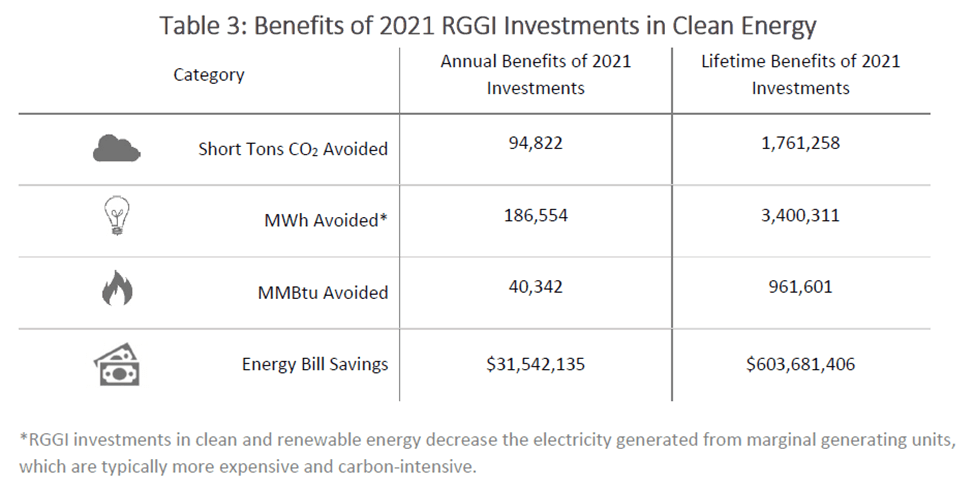
Clean and renewable energy
The Investment Report notes:
Clean and renewable energy represents 4% of 2021 RGGI investments in the region. Over the lifetime of the projects installed in 2021, these investments are projected to offset $604 million in energy expenses. They are also projected to avoid the release of nearly 1.8 million short tons of CO2 emissions (see Table 3).
Frankly I did not find the explanation in the Investment Report very useful describing what the projects cover:
Clean energy systems require labor to install, which creates jobs and boosts local economic activity. Energy expenditures that might otherwise flow to out-of-state fossil fuel resources stay within the region. As with energy efficiency, “behind-the-meter” programs also contribute to lowering wholesale electricity prices by lowering the demand for electricity at the wholesale level. As demand for electricity decreases, the most expensive power plants run less often, driving long-term prices down for all consumers. Households and businesses both with and without clean energy systems save money on bills.
Updated 7/3/2023 at 8:40 AM
I originally said:
Based on a skim of the state-by-state descriptions, I think clean energy projects refer to building electrification projects like installing heat pumps. However, the description of beneficial electrification explicitly refers to heat pump installations so I am not sure.
A comment by Nick Stokes on the Watts Up With That article cleared up my confusion:
“Based on a skim of the state-by-state descriptions, I think clean energy projects refer to building electrification projects like installing heat pumps. However, the description of beneficial electrification explicitly refers to heat pump installations so I am not sure.”
No, if you look down a bit further they clearly mean renewable generation:
“While RGGI investments are just a small part of widespread clean and renewable energy investments in the region, together these actions are having a measurable impact on the energy mix. Since 2008, RGGI states have increased their non-hydro renewable generation by 103%. In 2021 the RGGI states derived 60% of total generation from clean or renewable sources.“
The money they spent was only a small fraction of total investment. Goodness knows how they converted that to an annual saving.
I also corrected the following paragraph:
On an annual basis these investments reduced CO2 emissions by 94,822 tons and at a total cost of $15 million that means the reductions cost $158 per ton. New York must reduce its electric sector emissions about 18 million tons by 2030. If simple replacement of power capacity were the only conversion consideration, the cost to transition would be $2.8 billion. Unfortunately using averages has problems so this is a massive under-estimate.
Beneficial electrification
The Investment Report describes Beneficial Electrification thusly:
Beneficial electrification refers to programs that reduce carbon emissions by displacing direct fossil fuel use with electric power. In contrast to energy efficiency programs, which reduce electricity or fuels usage, beneficial electrification programs can increase MWh consumption, but result in a net reduction in carbon emissions. Examples include programs that promote the use of electric vehicles, reducing oil consumption, or the installation of electric heat pumps, reducing heating fuel and natural gas consumption.
Beneficial electrification represents 13% of 2021 RGGI investments in the region. Over their lifetime, the investments in beneficial electrification made in 2021 are expected to avoid 369,000 short tons of CO2 emissions and result in $164 million in customer bill savings. Beneficial electrification investments will yield even greater emissions reduction benefits over time, as renewables take up a larger portion of the electric grid composition. Investments in beneficial electrification programs, and the resulting bill savings, also lead to job creation and spur local economic activity.

On an annual basis these investments reduced CO2 emissions by 25,270 tons and at a total cost of $49 million that means the reductions cost $1,924 per ton. New York must reduce its building sector emissions about 25 million tons by 2030. If beneficial electrification of buildings was the only reduction strategy used the cost would be $48 billion.
There is a problem with the projects listed relative to the intent of the program. The description of the program states: “The Regional Greenhouse Gas Initiative (RGGI) is a cooperative, market-based effort among the states of Connecticut, Delaware, Maine, Maryland, Massachusetts, New Hampshire, New Jersey, New York, Pennsylvania, Rhode Island, Vermont, and Virginia to cap and reduce CO2 emissions from the power sector”, my emphasis added. All of the examples listed, “programs that promote the use of electric vehicles, reducing oil consumption, or the installation of electric heat pumps, reducing heating fuel and natural gas consumption” increase electric load. Most RGGI states have exhausted switching to lower carbon-content fuels that have provided most of the observed reductions to date. Future reductions in the electric sector will rely on the displacement of fossil fuel generation with added zero-emissions sources, primarily wind and solar. Funding programs that increase load works against that requirement.
Greenhouse gas abatement and climate change adaptation
The Investment Report states:
Greenhouse gas (GHG) abatement and climate change adaption (CCA) is a broad category encompassing other ways of reducing greenhouse gases, apart from energy efficiency and clean and renewable energy, as well as projects that focus on preparing for and addressing the impacts of climate change on local communities. Approximately 11% of 2021 RGGI investments supported GHG abatement and CCA programs. Over their lifetime, the investments made in 2021 are expected to avoid the release of over 10,000 short tons of CO2 (see Table 5).
Programs in the GHG abatement and CCA category may vary significantly and may drive GHG emission reductions in multiple sectors. For example, technology, research, and development programs are tracked as GHG abatement and CCA, as they may lead to advancements resulting in the reduction of greenhouse gases. Climate change policy research, coastal resilience, and flood preparedness programs are also tracked as GHG abatement and CCA.
GHG abatement and CCA programs vary in the types of benefits they provide. Some projects reduce electricity and fossil fuel use as part of their efforts to reduce overall emissions, generating economic benefits similar to those realized through energy efficiency and clean and renewable energy programs. Other projects may not return immediately trackable benefits within the scope of this report, but still provide important long-term benefits in climate preparedness and mitigation.
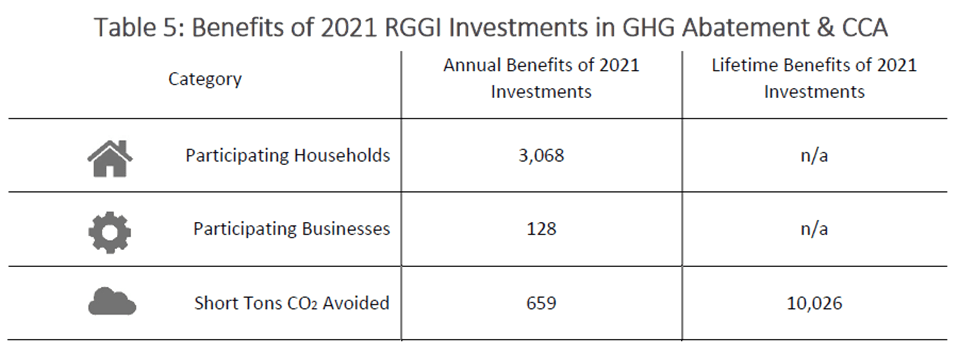
On an annual basis these investments reduced CO2 emissions by 659 tons and at a total cost of $41 million that means the reductions cost $62,468 per ton. However appropriate these programs are for responses to alleged climate change impacts, the programs are not helping reduce emissions at electric generating sources meaningfully.
Direct bill assistance
The Invest Report describes this sector:
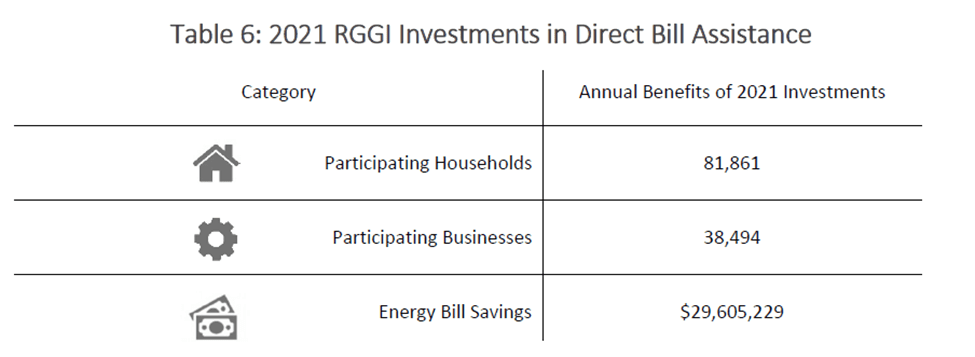
Direct bill assistance returns money to consumers as a rebate on their energy bills. Approximately 13% of 2021 RGGI investments have funded direct bill assistance. RGGI investments in direct bill assistance in 2021 returned $30 million in bill savings to energy consumers in over 81,000 households and 38,000 businesses (see Table 6)
These programs provide rate relief to electricity consumers in the RGGI region. Some programs provide assistance specifically to low-income families, while other programs provide small on-bill credits to all consumers.
Direct bill assistance typically appears as a credit on a consumer’s electricity bill. Direct bill assistance programs support economic activity by providing funds directly to consumers, who can then spend those funds on other priorities. Unlike energy efficiency or clean energy programs (which generate benefits for the lifetime of the installed measures), direct bill assistance programs provide benefits only for the length of the bill-assistance program. Direct bill assistance programs also do not reduce or affect wholesale electricity prices.
This category accounts for 13% ($49 million) of the $374 million total revenues that were invested in 2021. Obviously, there were no CO2 emission reductions associated with this category. There is no question that an increase in energy costs is very regressive so assisting those least able to afford higher energy costs is appropriate. On the other hand, if the intent of a price on carbon is to change behavior, then providing rebates reduces that incentive.
Administrative costs and the costs to support RGGI, Inc. add another $26 million to the funds that do not provide any CO2 emission reductions.
Overall, the RGGI states invested $374 million of the auction revenues in 2021. The goal of RGGI is to reduce electric sector emissions on an annual basis. The avoided CO2 on an annual basis totaled 235,298 tons at a rate of $1,589 per ton reduced.
Discussion
Politicians and climate activists have embraced cap-and-invest emission reduction programs as an effective solution to GHG emission reduction goals. The allure of a source of revenues and compliance certainty using climate policies that apparently have worked in the past is strong. The problem is these folks have not paid adequate attention to what made previous policies work and whether there are significant differences between their plans and existing programs.
In that regard there are lessons to be learned from the RGGI Investment Report for all cap-and-invest programs. RGGI effectively raised revenues. Chart 5: RGGI Investments as a Subset of Total Proceeds in the Investment Report shown below notes that through the end of 2021 the RGGI states raised $4.7 billion dollars. However, there is a lesson to be learned. The chart also reveals there is a problem with that much money and politicians. In 2021, none of the RGGI states diverted money to the general fund but that has occurred in the past to the tune of 6% of the revenues collected. The $282.5 million that went to general funds was political expediency pure and simple. Just because there was no longer a line item does not mean that the practice no longer occurs. At least in New York, agencies are using RGGI funds as a slush fund to cover administrative costs that should be covered elsewhere.

There is an unacknowledged dynamic lesson to be learned. The rationale for this kind of pollution control program is to reduce emissions. GHG emission reductions require investments because the reality is that most control options are not cost-effective by themselves. However, the success of these programs in raising money has attracted all sorts of interest beyond pollution control. While there are inappropriate uses for this money there are also proper uses like direct bill assistance. The problem is that there is so much pressure for the revenues raised that I believe it is likely that there will be insufficient money available to fund the necessary emission reductions. Furthermore, environmental justices is a prominent feature of recent cap-and-invest programs included to “benefit those communities that bear the most environmental burdens”. This will put even more pressure on using auction revenues for purposes that do not directly reduce emissions.
One of the features of cap-and-invest programs is that they offer compliance certainty with emission targets. The unrecognized problem is that previous programs included feasibility analyses to set the caps. For example, EPA’s latest multi-state emission trading programs evaluated the existing control equipment at each electric generating station in most of the country and established its cap based on that analysis. GHG emission targets established by legislation did not include unbiased feasibility analyses and relied on political aspirations.
This has not been a problem in the RGGI program yet. The aspirations for emission reductions were low when the program started in 2009. To date the emission permits or allowances have been comfortably in excess of the cap on emissions but that is no longer the case. So far, the poor performance of RGGI auction proceeds reducing CO2 has not been an issue. In the future, however, reductions from RGGI investments must be improved to meet proposed program goals.
I evaluated the influential book Making Climate Policy Work analysis of RGGI. Authors Danny Cullenward and David Victor show how the politics of creating and maintaining market-based policies render them ineffective nearly everywhere they have been applied. They recognize the enormity of the challenge to transform industry and energy use on the scale necessary for deep decarbonization. They write that the “requirements for profound industrial change are difficult to initiate, sustain, and run to completion.” Because this is hard, they call for “realism about solutions.” Their book includes an evaluation of RGGI. I agree with the authors that the results of RGGI and other programs suggest that programs like the NYCI proposal will generate revenues. However, we also agree that the amount of money needed for decarbonization is likely more than any such market can bear.
In the future, the diversion of funds away from emission reduction efforts and the amount of money needed means that the compliance certainty feature could cause a big problem. Fossil fuels and GHG emissions are closely linked to energy use. The ultimate compliance strategy for any GHG emission limitation program is stop using fossil fuels. If there is no replacement energy available that means that compliance will lead to an artificial energy shortage unless there is a safety valve or affected sources pay a penalty. My concern is that the pressure to spend money on programs that do not reduce emissions could result in insufficient money to make the necessary reductions.
Conclusion
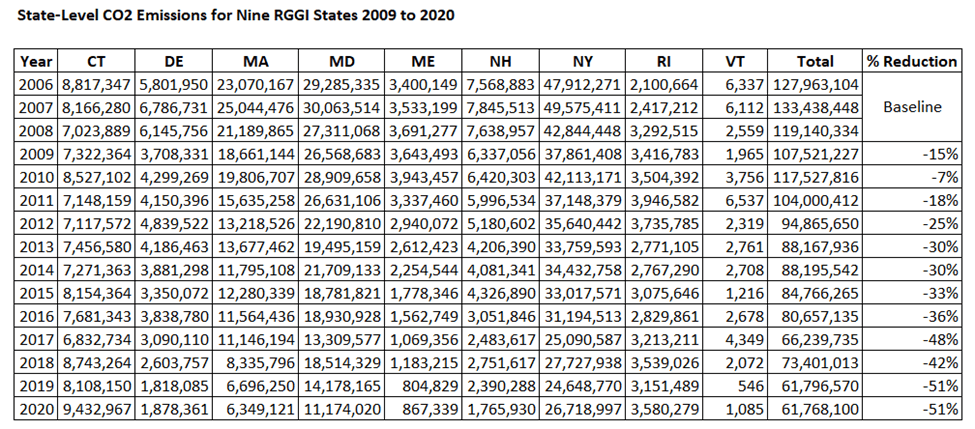
The lessons of RGGI should be concerning for all cap-and-invest programs. The benefits of RGGI are not as successful as alleged and I believe that other cap-and-invest programs will have similar results. Jobs created is touted as a benefit but they are expensive. Politicians and money must be watched closely or the money will be diverted to unintended uses. Although CO2 emissions in the RGGI region are down around 50% since the start of the program, RGGI funded control programs have only been responsible for 6.7% of the observed reductions. When the sum of the RGGI investments is divided by the sum of the annual emission reductions the CO2 emission reduction efficiency is $927 per ton of CO2 reduced. That value is far in excess of the social cost of carbon societal benefits.
I started this analysis because I thought it would identify RGGI investment programs that have effectively reduced GHG emissions. There aren’t any. The latest Investment Report only identifies a single category with a control effectiveness under a thousand dollars and that one is in excess of all Social Cost of Carbon costs. Those who claim that cap-and-invest programs are an effective solution are not considering all the results of RGGI.


