This is a guest post by Mark Stevens, a regular reader at this blog. Mark is a retired science and technology teacher from Long Island. He has put together a good overview of issues associated with Long Island wind power.
The stampede to build offshore wind turbines to replace fossil fuel generation is loaded with concerns that have not been thought through or been resolved.
1- There is no climate crisis: thousands of scientists and meteorologists around the world have published studies that LOCAL extreme events are caused by cyclical weather (decades, centuries, millennia): solar activity, ocean cycles, cosmic ray intensity, volcanic activity (surface and undersea), orbital cycles and planetary cycles to name some. CO2 is NOT causing global warming. In fact, its role is trivial and it is enabling record plant, forest, and crop production. Sea level rise is often due to land subsidence (sinking). There is record polar ice, polar bears are flourishing, and the earth has cooled over the last decade. Coral reefs are fine and Pacific Islands are increasing in area. United Nations Intergovernmental Panel on Climate Change (IPCC) doom and gloom reports have been crying for decades that the end of the planet is here; the reports use faulty input data, have extreme projections divorced from reality, and are written by people with political and career agenda.
2- The call to close reliable, cost-effective fossil and nuclear power plants will lead to blackouts and higher costs. In 2021 New York onshore wind nameplate capacity output was 22% and utility-scale solar nameplate capacity was 18%. Although the Scoping Plan claims higher values in the future, the sun does not always shine and the wind does not always blow. The wind turbines need 10 times more steel, concrete and rare earths (foreign sourced) than conventional power. Mining and refining the massive amounts of copper, aluminum, rare earths and steel disrupts the environment and emits many times more CO2 than the manufacture of conventional generation. They shut down in weather extremes (Texas and N. Carolina) and have a significantly shorter life in the harsh marine environment. End-of-life disposal of giant turbine blades is expensive and difficult.
3- Thousands of miles of redundant new transmission cables and towers must be built (increasing pollution emissions) and billions spent in backup battery power when the unreliables (renewable wind and solar) fail. Several battery storage facilities have ignited in unquenchable, toxic fires. Fossil plants must be constantly running anyway for spinning reserves when unreliable wind and solar fail. Starting and stopping loads increases emissions in the fossil-fueled generators.
4- The recent mass deaths of whales and dolphins from New England to Mid-Atlantic is directly correlated with offshore wind site surveys. Seismic surveys, machine gun sonar, pile driving, blasting and other construction sounds are greatly amplified and transmitted underwater to mammals like whales and dolphins. They become deaf, have nervous system infections, and get disoriented which facilitate beaching and ship collisions. Even if it turns out that the mapping activities are not the cause, construction activities are different and there are no plans to evaluate those concerns before construction begins.
5- The massive turbines create subsonic sounds which are vastly amplified via underwater transmission and injure whales’ and dolphins’ hearing.
6- The huge turbine blades kill thousands of sea and land birds, including Bald Eagles and bats each year.
7- The turbine blades weighing hundreds of tons, are not recyclable and pose a massive disposal problem.
8- Wind and solar require hundreds of times more seabed and land area than the equivalent fossil generation. This area is forever damaged for natural purposes.
9- Europe and the UK, especially Germany, have embraced wind and solar for years. The power delivery has been so poor that they are reopening many coal power plants. The price of electricity has increased 600% rendering Europe’s industry non-competitive and many factories have shuttered.
10- If unreliables (wind and solar power) were so good, they would not need hundreds of billions of taxpayer subsidy dollars shoved into foreign and domestic companies.
11- With Russia, China, India and other countries opening hundreds of fossil fuel and nuclear plants, a zero-emission New York State will have NO measurable effect on global pollution.
12- The Governor’s plan to electrify heating, cooking and vehicles in New York will require quantities of electricity and backup storage that will be impossible to obtain and afford. Europe has tried it resulting in electricity costs so high and unreliable that businesses and manufacturing have closed and many must choose between heating and buying food. Before our leaders see the disaster, they caused, we can only work toward reversing this coming disaster.
13- Fossil and nuclear power plants must remain open and running (spinning reserves) to plug the frequent gaps in solar and wind generation. There is little or no emissions reduction and rates shoot up to pay for both systems of generation.
14- The Unreliables (wind and solar) industry, foreign and domestic, have spent millions lobbying for these projects. Gore, Kerry, Bloomberg and others have made billions trading carbon credits and investing in “green” companies. Foreign and domestic wind and solar companies are making a windfall in government taxpayer subsidies. They will get rich while we burn candles.
On April 13 the New York Department of Environmental Conservation (DEC) announced that “the Municipal Zero-Emission Vehicle (ZEV) Infrastructure Grant Program has awarded over $8.3 million in funding to 70 municipalities to install electric vehicle charging stations for public use.” This post looks at the cost details included in this component of the Climate Leadership & Community Protection Act (Climate Act) net zero transition plan.
I have been following the Climate Act since it was first proposed. I submitted comments on the Climate Act implementation plan and written over 300 articles about New York’s net-zero transition because I believe the ambitions for a zero-emissions economy embodied in the Climate Act outstrip available renewable technology such that the net-zero transition will do more harm than good. The opinions expressed in this post do not reflect the position of any of my previous employers or any other company I have been associated with, these comments are mine alone.
Climate Act Background
The Climate Act established a New York “Net Zero” target (85% reduction and 15% offset of emissions) by 2050 and an interim 2030 target of a 40% reduction by 2030. The Climate Action Council is responsible for preparing the Scoping Plan that outlines how to “achieve the State’s bold clean energy and climate agenda.” In brief, that plan is to electrify everything possible and power the electric gride with zero-emissions generating resources by 2040. The Integration Analysis prepared by the New York State Energy Research and Development Authority (NYSERDA) and its consultants quantifies the impact of the electrification strategies. That material was used to write a Draft Scoping Plan. After a year-long review the Scoping Plan recommendations were finalized at the end of 2022. In 2023 the Scoping Plan recommendations are supposed to be implemented through regulation and legislation.
Municipal ZEV Infrastructure Grant Program
According to the program fact sheet grants are available to municipalities for the purchase and installation of electric vehicle supply equipment or hydrogen fuel cell filling station components available primarily for public use. There is a match of 0 to 20 percent of the total project cost requirement based, in part, on the median household income of the municipality.
The Department of Environmental Conservation (DEC) Municipal Zero-Emission Vehicle (ZEV) Infrastructure Grant Program has awarded over $8.3 million in funding to 70 municipalities to install electric vehicle charging stations for public use. The transportation sector is the second-largest source of greenhouse gas emissions in New York, and these electric vehicle charging stations will help the state achieve the greenhouse gas emission reduction requirements under the Climate Leadership and Community Protection Act (Climate Act) and provide more opportunities across the state for electric vehicle drivers to charge.
The 2022 round of the ZEV Infrastructure Grant Program made 131 awards to 70 municipalities totaling $8.38 million toward the installation of 454 Level 2 charging ports and 28 direct current fast charger pedestals throughout New York State, the largest award amount since the program began. More than 42 percent of the grant funding was awarded for projects located in disadvantaged communities based on the draft criteria. The Climate Justice Working Group recently finalized criteria for disadvantaged communities that will ensure 35 percent, with a goal of 40 percent, of overall benefits of spending on clean energy and energy efficiency programs – one of several ways the Climate Act prioritizes climate justice.
ZEV infrastructure grants are available to cities, towns, villages, and counties across New York under the DEC Municipal ZEV Program. The program also offers rebates for zero-emission fleet vehicles. The 2022 rebate awards for municipal zero-emission fleet vehicles were announced in December. Since its inception in 2016, the Municipal ZEV Program has awarded more than $16 million in rebates and grants (including this round) towards the purchase of 114 plug-in hybrid vehicles and 182 all-electric vehicles, 1,076 Level 2 charging ports, 44 fast charge pedestals, and three hydrogen fuel cell filling nozzles.
More information about the DEC Municipal ZEV Infrastructure Grant Program, as well as Municipal ZEV Rebates, is available on DEC’s website.
This grant program is part of the Final Scoping Plan Chapter 11 – Transportation transition strategy. The following component describes what is proposed:
Invest in and remove barriers for ZEV charging and fueling infrastructure: To support the level of ZEV adoption anticipated by 2030, New York must quickly increase the number of EV charging stations and hydrogen filling stations in the State. New York should fund rebates or investment in EV charging stations and hydrogen filling stations, either directly through programs run by NYSERDA and/or NYPA or through market-based mechanisms like the clean transportation standard discussed below that would generate resources for ZEV infrastructure. All focus on investments in Disadvantaged Communities, programs in this area should focus on charging at multi-unit dwellings, on-street charging, and convenient urban fast charging, especially in areas with less access to home charging. Strategies should also prioritize fast charging along travel corridors, especially in rural areas, and support market segments that have been slow to attract private investment, including hydrogen fueling stations for appropriate applications. Through the National Electric Vehicle Infrastructure formula program, DOT will identify opportunities to support the creation of a safe, reliable, convenient, and equitable EV fast charging infrastructure network to allow EV drivers to reach interstate, regional, and long-distance destinations. DOS should incorporate EV charging into building codes to ensure new construction is EV-ready.
Program Numbers
I copied the data provided in the press release list of awardees and put the data into a table. The grants total $8.4 million and fund 462 level 2 chargers and 29 DCFC pedestals (“fast chargers”). The level 2 charger costs averaged $10,713 and ranged from $41,090 to $3,326. I think that reflects an economy of scale when a whole bank of chargers is installed. The DCFC chargers averaged $125,715 and ranged from $250,000 to $40,316. In the following I extrapolate these cost estimates to the total needed for the total net-zero transition.
In the strategy quoted above it states that “All focus on investments in Disadvantaged Communities, programs in this area should focus on charging at multi-unit dwellings, on-street charging, and convenient urban fast charging, especially in areas with less access to home charging.” What does providing LMI car owners in Disadvantaged Communities entail? I assume that it means Level 2 charging systems must be provided despite the suggestion that convenient fast charging is a focus. According to Kelley Blue Book EV charging stations: everything you need to know:
“In broad terms, Level 2 charging stations charge at about 6 kilowatts (kW) or a little higher and can add about 20 miles of range in an hour of charging at home or using a public charging station. DC fast chargers use high-voltage direct current to charge at 50 kW and up to 350 kW if the car can accept that rate. It’s not uncommon for EVs to gain 80% charge in about 30 minutes or less during quick charging.”
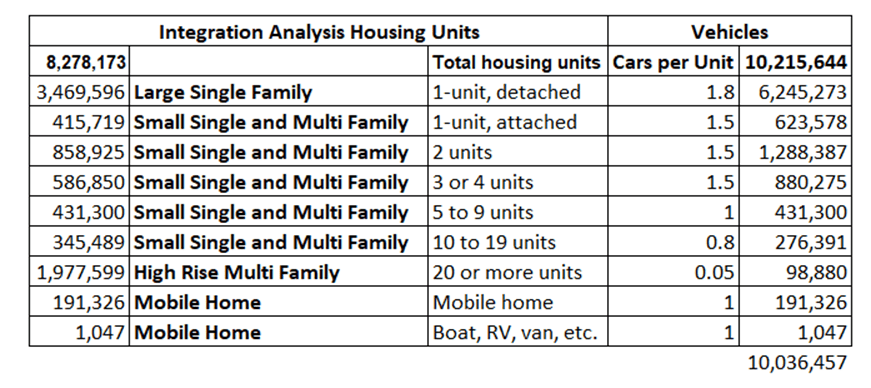
Not surprisingly there is insufficient detail in the Integration Analysis to determine how many Level 2 chargers are needed to fulfill this Scoping Plan target. I found that in the Open NY list of disadvantaged communities that the population distribution was 6,993,023 residents (36%) in disadvantaged communities and 12,579,296 in the other communities. According to the Integration Analysis there are 10,215,644 light duty vehicles in 2022. I assumed that the proportion of vehicles owned by residents in disadvantaged communities equals the total number of vehicles times 36% multiplied by an arbitrary 20% representing number of residents owning a vehicle to come up with an estimate of disadvantaged community vehicles: 729,993. I furthered assumed that one third of those vehicles will need a public charging station because they won’t have access to a private charger so 243,307 Level 2 chargers will be needed. At the average cost in the Municipal ZEV Infrastructure Grant Program awards, $2,607 million would be needed and even at the minimum cost $809 million would be needed just for Level 2 chargers.
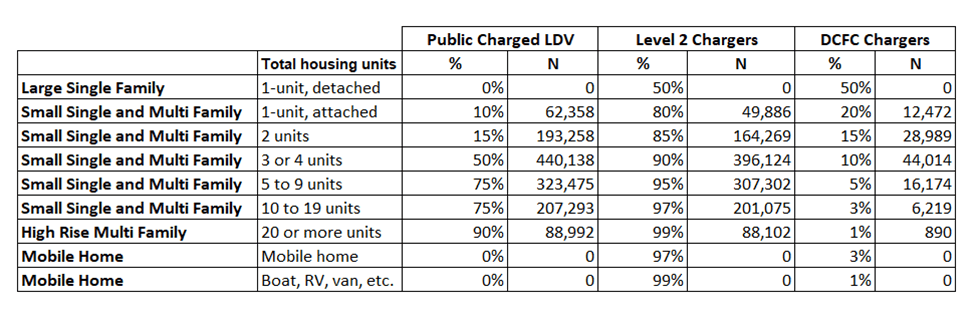
I also made an estimate of the number of chargers needed throughout the state. The integration analysis lists the number of housing units for nine categories. I assumed the number of light duty vehicles (LDVs) per unit and calculated how many LDVs for each category.
In the next step I estimated the percentage of vehicles that would be charged at public charging stations for each residential category. For example, I assumed that no 1-unit detached homes would charge their electric vehicle at a public station but that 90% of the vehicles in high rise multi-family units would. I also estimated the percentage of level 2 chargers and DCFC chargers by housing unit type. The result was the number of level 2 and DCFC chargers that would be needed for residential public charging.
The number of charges was multiplied by the average and minimum cost for the Level 2 and DCFC systems to get a range of expected costs for public chargers based on the results of this announcement. I estimate that between $8.4 billion and $26.6 billion would be needed for residential public charging systems. Note that this does not include public charging systems for the traveling public or office parking lots.
The Hochul Administration narrative is that the costs of inaction for the net zero Climate Act transition outweigh the costs of action but that statement is misleading unless the caveat that the costs in the Scoping Plan do not include the costs “already implemented” programs like the Municipal ZEV Infrastructure Grant Program. As far as I can tell the Integration Analysis did include the benefits of already implemented programs. In other words, the Administration claim does not include all the costs to transition to net-zero. According to the final scoping plan the societal benefits of the Climate Act net zero transition plan are greater than the costs by between $115 and $130 billion. Properly including this Grant Program as a necessary cost to get to meet the Climate Act mandates reduces the alleged benefits to between $89 and $122 billion. I believe that when all the other costs to electrify the transportation sector are included, the real costs will exceed the societal benefits.
Conclusion
Every component of the Climate Act that I have evaluated has turned out to be more complicated, the ease of transition more uncertain, and the costs greater than admitted in the Scoping Plan. In this example, the Scoping Plan does not differentiate or address the differences between home charging and the more complicated public charging requirements. The Scoping Plan suggests that implementation should “focus on charging at multi-unit dwellings, on-street charging, and convenient urban fast charging, especially in areas with less access to home charging” but does not acknowledge the uncertainties associated with finding the room for those assets. Finally, the Integration Analysis lists the cost for Light Duty Vehicle Battery Electric Vehicle Supply Equipment: Per-Vehicle Cost as $2,826 in 2022, but the minimum cost in the 2022 awards was $3,326 and the average cost was $10,713.
Given the complications, uncertainties and higher costs there is no way the Hochul Administration net-zero transition is going to work as glibly promised. For all the talk about inspiring other jurisdictions to follow New York’s lead and commit to the same GHG emission reductions targets the possibility that rushing ahead without addressing feasibility issues might end in a debacle that sets their cause back has been ignored. The Climate Act’s appeal to emotion and values rather than a rational energy policy is not going to end well for the state or their cause.
The New York State Department of Environmental Conservation held an informational webinar (presentation slides and recording) on April 11, 2023 on the proposed solid waste management plan for New York State. This post looks at the relationship between this plan and the Climate Leadership & Community Protection Act (Climate Act). The Climate Act mandates emission reductions from all sectors of the economy but has not provided analyses supporting the feasibility of achieving those reductions on the schedule required.
I have been following the Climate Act since it was first proposed. I submitted comments on the Climate Act implementation plan and written over 300 articles about New York’s net-zero transition because I believe the ambitions for a zero-emissions economy embodied in the Climate Act outstrip available renewable technology such that the net-zero transition will do more harm than good. The opinions expressed in this post do not reflect the position of any of my previous employers or any other company I have been associated with, these comments are mine alone.
Climate Act Background
The Climate Act established a New York “Net Zero” target (85% reduction and 15% offset of emissions) by 2050 and an interim 2030 target of a 40% reduction by 2030. The Climate Action Council is responsible for preparing the Scoping Plan that outlines how to “achieve the State’s bold clean energy and climate agenda.” In brief, that plan is to electrify everything possible and power the electric gride with zero-emissions generating resources by 2040. The Integration Analysis prepared by the New York State Energy Research and Development Authority (NYSERDA) and its consultants quantifies the impact of the electrification strategies. That material was used to write a Draft Scoping Plan. After a year-long review the Scoping Plan recommendations were finalized at the end of 2022. In 2023 the Scoping Plan recommendations are supposed to be implemented through regulation and legislation.
Solid Waste Proposed Plan
This section lists material from the DEC Draft New York State Solid Waste Management Plan website. This plan is subtitled: Building the Circular Economy Through Sustainable Materials Management (2023 – 2032). DEC writes:
To protect communities and mitigate the effects of climate change, the New York State Solid Waste Management Plan (Plan) builds upon sustained efforts to reduce waste and advance the state’s transition to a circular economy, helping to change New Yorkers’ understanding of waste and their relationship to it. The Plan intends to guide actions over the next decade, from the beginning of 2023 to the end of 2032, and builds upon the State’s 2010 Beyond Waste Plan.
The Plan sets forth six major Focus Areas with goals and action items to move the circular economy and materials management industry forward in New York State:
Waste Prevention, Reduction, and Reuse
Recycling and Recycling Market Development and Resiliency
Product Stewardship and Extended Producer Responsibility
Organics Reduction and Recycling
Toxics in Products
Design and Operation of Solid Waste Management Facilities and Related Activities
The DEC also noted that people wishing to comment on the draft New York State Solid Waste Management Plan have the opportunity to submit written comments until May 15, 2023. Comments can be submitted by email to NYSSolidWastePlan@dec.ny.gov. Please include “Comments on SSWMP” in the subject line of the email.
Waste Sector and the Climate Act
The following graph lists historical and projected waste sector GHG emissions using two global warming potential accounting approaches: one over 20 years and the other over 100 years. More details on the differences and the data source are provided in a recent article. In the graph historical data are used from 1990 to 2020, there are a couple of years that mix available data and projections, and from 2023 to 2030 the projected values assume a linear reduction each year to meet the 2030 Climate Act target of a 40% reduction in GHG emissions from the 1990 baseline. The waste sector emissions trends are interesting. Note that a 30% emissions reduction (12.6 MMT CO2e) is required from 2020 to 2030 in order to meet the 40% reduction from the 1990 baseline mandate. Note, however that while the GWP-100 required emission reduction is only 4.6 MMT CO2e it still represents a 30% reduction. I am not aware of any control technology that can be expected to provide that kind of reduction. The question of the day is whether the DEC’s solid waste management plan provides a strategy to meet these targets.
Overview of the DEC Plan
At 16:02 of the meeting recording the DEC describes the “vision” of the plan shown in the following slide. The presentation said they think we can achieve these visions. Subsequently, the presentation expanded on the “climate change mitigation is fully implemented” component. In 2020 the waste sector emissions were 12% of the total so reductions must be implemented in order to meet the Climate Act targets. Also note that a major point of emphasis in the presentation was the point that solid waste facilities are located primarily in disadvantaged communities.
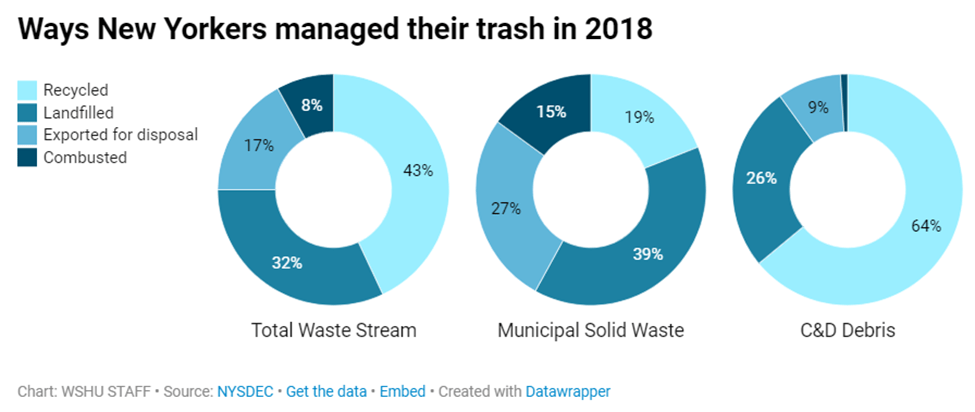
J.D. Allen writing on the WSHU radio website did an excellent job describing the plan and the current status of waste in the state. He explained:
New York is hearing feedback from communities that have been disproportionately impacted by waste disposal and transfer facilities. It’s part of a solid waste management plan the state works on every 10 years.
The plan is intended to guide the state over the next decade — from the beginning of 2023 to the end of 2032 — to reduce waste and advance the state’s transition to a circular economy, said David Vitale, division director for materials management at the state Department of Environmental Conservation.
The public is allowed to comment on New York’s solid waste management plan through May 15. However, environmental advocates, municipal leaders and the private sector are dubious about some sections of the proposal.
Allen went on to quote David Vitale:
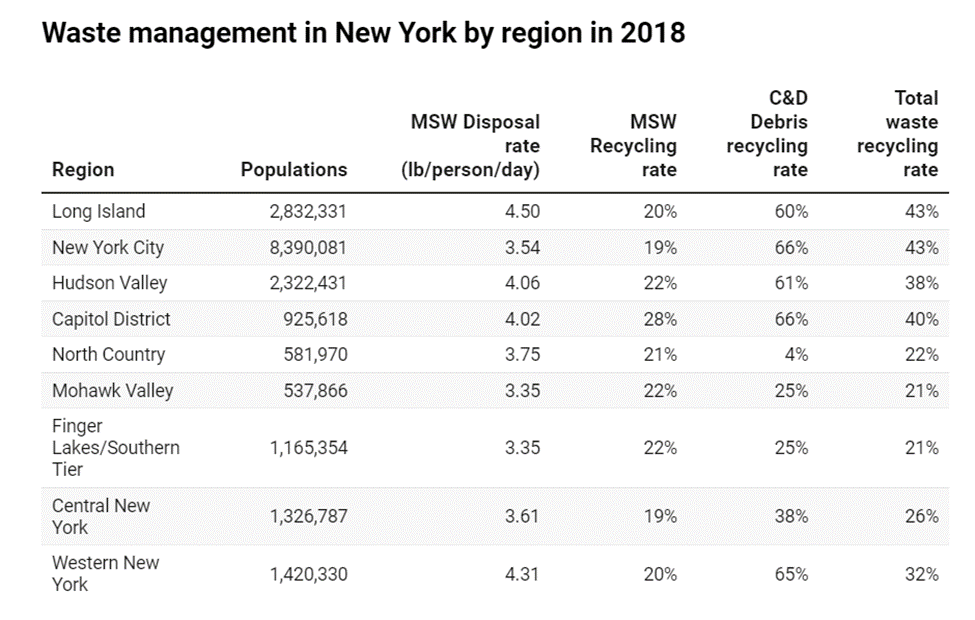
“Waste management is different in different parts of our state,” Vitale said about the plan based on statewide data from 2018 — well before the pandemic disrupted the system and information collection. “We have different programs, we have different needs and different challenges. And so all of that is captured in there.”
“[But] waste is a concept of the past,” he continued.
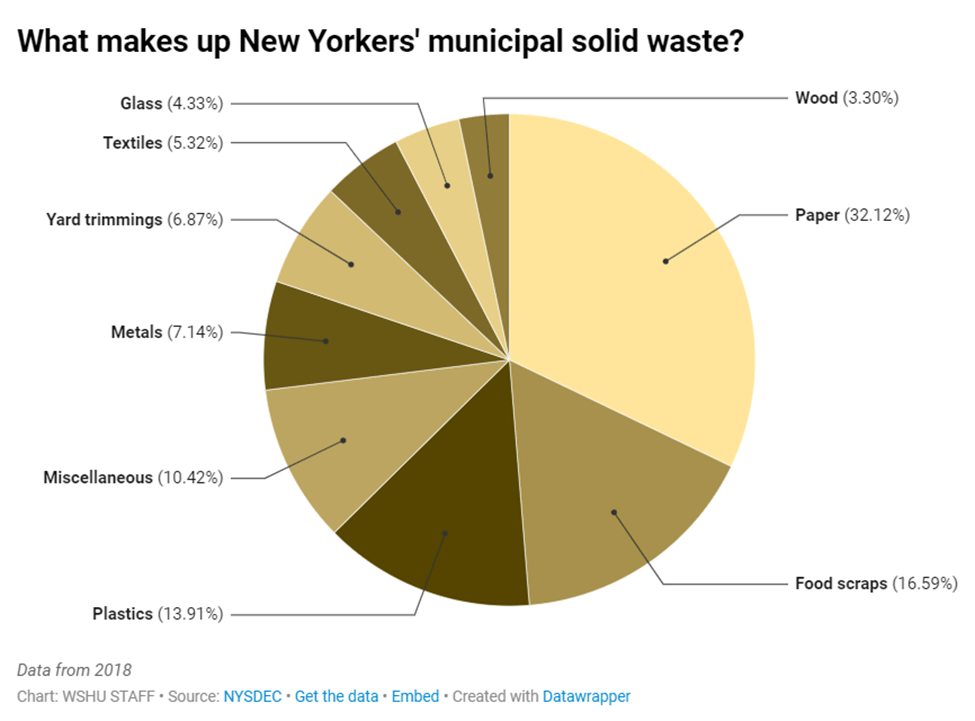
He said that will mean changing New Yorkers’ understanding of waste and their relationship to it by reducing the amount of plastic, paper and organic waste that enter the waste stream, while finding innovative ways to reuse and recycle waste that would typically end up in landfills and other facilities.
Allen also explained:
This is compounded by state goals to protect communities and mitigate the effects of climate change. By 2030, New York seeks to curb greenhouse gas emissions to 40% of 1990 levels by 2030 and 85% by 2050. Waste makes up 12% of the state’s contribution.
Vitale reminded New Yorkers during an informational meeting on the statewide draft plan on Tuesday that it’s also important to get involved in conversations about how trash is handled locally.
“The primacy for solid waste management rests with local governments,” he said. “We are a home-ruled state. That’s how the laws are set up; That’s where the authorities are. The state doesn’t have that particular authority.”
“So it’s most important to have this information available and to be used as part of that […] local solid waste management planning process,” Vitale continued.
Allen wrote:
Towns on Long Island have been critical of the state Department of Environmental Conservation for not taking a more active role in creating regional waste management plans. Vitale said it’s a responsibility that falls on towns on Long Island — and counties in the rest of New York, under state law. Six of 13 towns on Long Island have yet to update their expired local waste management plans.
More than half of New York state’s waste stream — and nearly 90% of New York City’s total waste stream — is managed in facilities located in disadvantaged communities. Last month, the state identified these communities to steer millions of dollars in funding to reduce greenhouse gas emissions that contribute to climate change. “The concerns from some of those committees now have data to validate those issues that they have dealt with,” Vitale said.
On Long Island, most of the 85 U.S. Census tracts selected are communities of color, and have existing or remnants of waste infrastructure. This includes around the Brookhaven Landfill, one of two facilities remaining in the region that handles the disposal of waste from more than two million residents — and which is scheduled to close over the next few years.
Residents have organized to call for the town to open hearings to brainstorm around a zero waste and equitable waste management. Yet, the Town of Brookhaven’s local solid waste management plan expired in 2009. According to freedom of information requests, the town has no record of any zero-waste planning between January 2020 and March 2023.
Vitale said unburdening these communities of waste infrastructure could be considered as part of state and local solid waste management planning. By 2050, New York has a goal to reduce landfilling by 85%. “It’s intended to be as open and transparent as we can with our processes. And the data that we have in these plans, hopefully can be used for that purpose,” he said
Statewide, the draft plan recommends 33 legislative actions aligned with the 2019 Climate Leadership and Community Protection Act. The plan calls on New York to expand existing law to require smaller businesses to donate food and scrap organic waste, and adopt an Extended Producer Responsibility law to shift the responsibility of reducing paper and plastic waste to manufacturers.
Another proposal would create a surcharge on the thousands of tons of waste being landfilled or burned into ash in New York and all waste generated and being sent out of state. Several projects statewide — including four waste transfer stations that are in different stages of approval on Long Island — seek to haul garbage to landfills in Ohio, Pennsylvania and other states.
Allen went on to explain:
“There needs to be a state plan for organics composting to avert combining clean organics with inherently contaminated sewer sludge and spreading/generating pollution through landfilling and burning,” Mary Arnald, co-founder of Civics United for Railroad Environmental Solutions (CURES) in Queens, said in a comment during the video conference. “This can’t be left to the private sector because that’s setting up a wild west of competition.”
A surcharge — at least $5 per ton — could not only “help disincentivize disposal, but also generate $133 million per year” to provide financial support for reduction, reuse and recycling projects, according to the draft plan. Over 30 states already use some form of fee structure.
“Without industry within New York state to create the circular economy to process, and little literature published or released from the state-funded education institution research,” Brookhaven Town Waste Management Commissioner Christine Fetten warned that a per-ton disposal disincentive surcharge “would result in an increase in illegal dumping.”
Professionals and everyday New Yorkers alike want an extension to the comment period to allow testimony for a few more days to an additional month.
Discussion
My first impression is that the Solid Waste Management Plan proposal is long on slogans and short on action items starting with “Waste is a thing of the past”. For example, the presentation says it will “empower residents to compost at home or through community programs”. This is a needed to reduce organic material methane emissions. That sounds great but in practice it is a gigantic pain in the neck based on my personal experience. In order to compost you must have space for a separate container to collect compostable material, space for a separate container for pickup for a community program or your own personal compost bin, and time to work the compost and use the composted material. Oh, by the way, if not done correctly, compost making can create odors and spread disease and weeds when used. The thought that this be universally adopted so “waste is a thing of the past” is magical thinking.
Allen described a couple of the recommendations. The first is for New York to expand existing law to require smaller businesses to donate food and scrap organic waste, and adopt an Extended Producer Responsibility law to shift the responsibility of reducing paper and plastic waste to manufacturers. He also noted that there is a proposal to create a surcharge on the thousands of tons of waste being landfilled or burned into ash in New York and all waste generated and being sent out of state. In both instances those plans would necessarily add costs for consumers.
Conclusion
This is not the first solid waste management plan. I would bet a lot of money the last plan had many similar goals and targets. There was no documentation provided that showed how well New York’s plan has been working to date which suggests they had nothing to show. Why in the world do they think it will work as planned this time?
This is yet another component of the Climate Act that is long on slogans, wishful thinking, and magical solutions but totally devoid of realistic plans with supporting feasibility analyses and cost estimates. This will come to a head as soon as the cap and invest program starts tracking emission reduction progress against the Climate Act mandates. When that happens the gap between observed reductions and needed reductions can no longer be ignored. Reality will eventually win.
On April 4 I published an article about the Hochul Administration’s proposal to make some changes to the greenhouse gas emissions accounting approach in the Climate Leadership & Community Protection Act (Climate Act). After a “firestorm of opposition from environmentalists” the proposal to use a different global warming potential value was removed from budget negotiations but the topic will still be addressed later this year. This post provides information on this Climate Act component to try to clear up some misconceptions that I noticed in the recent dustup and to explain what the two methodologies mean to required emission reductions.
I have been following the Climate Act since it was first proposed. I submitted comments on the Climate Act implementation plan and written over 300 articles about New York’s net-zero transition because I believe the ambitions for a zero-emissions economy embodied in the Climate Act outstrip available renewable technology such that the net-zero transition will do more harm than good. The opinions expressed in this post do not reflect the position of any of my previous employers or any other company I have been associated with, these comments are mine alone.
Climate Act Background
The Climate Act established a New York “Net Zero” target (85% reduction and 15% offset of emissions) by 2050 and an interim 2030 target of a 40% reduction by 2030. The Climate Action Council is responsible for preparing the Scoping Plan that outlines how to “achieve the State’s bold clean energy and climate agenda.” In brief, that plan is to electrify everything possible and power the electric gride with zero-emissions generating resources by 2040. The Integration Analysis prepared by the New York State Energy Research and Development Authority (NYSERDA) and its consultants quantifies the impact of the electrification strategies. That material was used to write a Draft Scoping Plan. After a year-long review the Scoping Plan recommendations were finalized at the end of 2022. In 2023 the Scoping Plan recommendations are supposed to be implemented through regulation and legislation.
Global Warming Potential
The recent controversy involved changes to the Greenhouse Gas (GHG) emissions accounting approach used by the Climate Act to account for methane or natural gas emissions. The Environmental Protection Agency (EPA) explains that the Global Warming Potential (GWP) was “developed to allow comparisons of the global warming impacts of different gases”. EPA explains that GHGs affect the rate at which energy from the surface escapes to space. The explanation notes:
Different GHGs can have different effects on the Earth’s warming. Two key ways in which these gases differ from each other are their ability to absorb energy (their “radiative efficiency”), and how long they stay in the atmosphere (also known as their “lifetime”).
The EPA explanation goes on to state:
Specifically, it is a measure of how much energy the emissions of 1 ton of a gas will absorb over a given period of time, relative to the emissions of 1 ton of carbon dioxide (CO2). The larger the GWP, the more that a given gas warms the Earth compared to CO2 over that time period. The time period usually used for GWPs is 100 years. GWPs provide a common unit of measure, which allows analysts to add up emissions estimates of different gases (e.g., to compile a national GHG inventory), and allows policymakers to compare emissions reduction opportunities across sectors and gases.
CO2, by definition, has a GWP of 1 regardless of the time period used, because it is the gas being used as the reference. CO2 remains in the climate system for a very long time: CO2 emissions cause increases in atmospheric concentrations of CO2 that will last thousands of years.
Methane (CH4) is estimated to have a GWP of 27-30 over 100 years (Learn why EPA’s U.S. Inventory of Greenhouse Gas Emissions and Sinks uses a different value.). CH4 emitted today lasts about a decade on average, which is much less time than CO2. But CH4 also absorbs much more energy than CO2. The net effect of the shorter lifetime and higher energy absorption is reflected in the GWP. The CH4 GWP also accounts for some indirect effects, such as the fact that CH4 is a precursor to ozone, and ozone is itself a GHG.
Nitrous Oxide (N2O) has a GWP 273 times that of CO2 for a 100-year timescale. N2O emitted today remains in the atmosphere for more than 100 years, on average.
Chlorofluorocarbons (CFCs), hydrofluorocarbons (HFCs), hydrochlorofluorocarbons (HCFCs), perfluorocarbons (PFCs), and sulfur hexafluoride (SF6) are sometimes called high-GWP gases because, for a given amount of mass, they trap substantially more heat than CO2. (The GWPs for these gases can be in the thousands or tens of thousands.)
EPA also explains that there are alternatives to using the 100-year GWP:
The United States primarily uses the 100-year GWP as a measure of the relative impact of different GHGs. However, the scientific community has developed a number of other metrics that could be used for comparing one GHG to another. These metrics may differ based on timeframe, the climate endpoint measured, or the method of calculation.
For example, the 20-year GWP is sometimes used as an alternative to the 100-year GWP. Just like the 100-year GWP is based on the energy absorbed by a gas over 100 years, the 20-year GWP is based on the energy absorbed over 20 years. This 20-year GWP prioritizes gases with shorter lifetimes, because it does not consider impacts that happen more than 20 years after the emissions occur. Because all GWPs are calculated relative to CO2, GWPs based on a shorter timeframe will be larger for gases with lifetimes shorter than that of CO2, and smaller for gases with lifetimes longer than CO2. For example, for CH4, which has a short lifetime, the 100-year GWP of 27–30 is much less than the 20-year GWP of 81–83.
Climate Act Global Warming Potential
The ideologues who wrote the Climate Act chose to use GWP measured over 20 years rather than 100-years. I believe that this was a deliberate choice to emphasize the “value” of methane and natural gas reductions. At the time the Act was passed this was a unique choice and since then only one jurisdiction (the state of Maryland) has chosen this approach. Everybody else, all the other states, the EPA, and the Intergovernmental Panel on Climate Change, all use GWP measured over 100 years. The proposal to change this accounting was greeted with vociferous opposition from New York’s environmental community because it was perceived as reducing the value of reductions of oil, gas, and bio-fuels.
If adopted, S6030 would cast New York’s newly-adopted climate plan into limbo by changing the figures that provide the foundation for its 400-plus pages of policy recommendations. It would also have brought New York’s accounting in line with the way methane is counted by most other states and the federal government — a method climate scientists say is outdated, and that underestimates the outsized impact that natural gas leaks and other major methane sources have on climate change.
If I had the time, I would respond to the entire article because it exemplifies the rationale of the NY environmental community relative to this issue. Unfortunately, there are too many issues on my plate to address all of it. However, the last sentence quoted above must be addressed. As I noted previously both the EPA and the IPCC use GWP-100. It is hypocritical for activists to demand that New York follow the “Science” as espoused by the IPCC except when it is inconvenient. The claim that “a method climate scientists say is outdated” cherry picks a limited number of scientists. In New York that would be Robert Howarth Ph.D. who has repeatedly claimed that he played a key role in the drafting of the Climate Act.
Dr. Howarth is a biogeochemist and ecosystem scientist who has assumed the mantle of venerated Climate Scientist™. Everything he says is taken as holy writ by New York climate activists. It is not clear to me why the David R. Atkinson Professor of Ecology & Environmental Biology at Cornell University is considered a climate scientist with impeccable qualifications that preclude any criticism of his arguments. I have no doubts of his expertise related to methane chemistry and the comparison to carbon dioxide in the laboratory. However, his understanding and that of the New York climate activist community, on the role of methane on global warming is flawed. I charitably ascribe his incorrect views to his lack of background in atmospheric physics. I have summarized the methane issues ignored by Howarth. It boils down to one issue that even the EPA description overlooks. The GWP values are based on laboratory molecular measurements which are only appropriate in that setting. In the atmosphere where the effect on global warming actually occurs, the relative differences between carbon dioxide and methane due to concentrations, the particular wavelengths affecting the out-going radiation, and the saturation effect all mean that carbon dioxide is much more important than methane. If considered properly the EPA and IPCC approach is appropriate and the use of the 20-year GWP is not justified as mandated in the Climate Act
New York State GHG Emissions Inventory GWP-20 and GWP-100
The primary purpose of this post is to document the differences between the emissions associated with the two global warming potential methodologies. The differences are being portrayed as hugely important. Marie French writes:
But the numbers — and previous work by state staff — show that New York would be required to take less aggressive action to slash greenhouse gasses if Gov. Kathy Hochul, despite dropping an immediate push for it Wednesday, ultimately cuts a deal with lawmakers to change the climate law, an effort first reported by POLITICO. “Overall, you’re saying we don’t need to reduce emissions as much,” said Bob Howarth, a Cornell University professor and member of the Climate Action Council that was set up to chart a path to achieving the state’s climate goals. “This is a big retrenchment from the climate goal, particularly on the use of natural gas.”
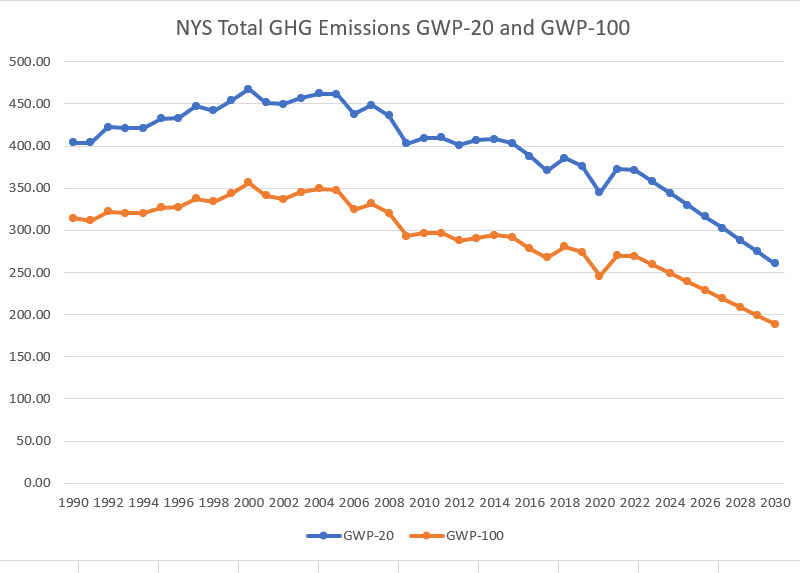
In order to look at the numbers I developed a spreadsheet that uses the NYS GHG emissions by Global Warming Potential for 20-year and 100-year time frames. The observed data from 1990 to 2020 are from the 2022 Statewide GHG Emissions Report and the associated data on Data NY for Statewide GHG Emissions.
My spreadsheet also makes projections for 2021-2030. I made some educated guesses for the 2021 and 2022 emissions. Electricity sector emissions in 2021 and 2022 are available from EPA. I assumed that the ratio of direct CO2 emissions to all the other GHG emissions in the sector for the last three years would be the same as for 2021 and 2022 to estimate the total electricity sector emissions. The emissions from all the other sectors are the average of the last three years. On the long list of unresolved questions is how the emission reduction target of 2030 will be apportioned amongst the different sectors. A portion of the agricultural and industrial sector emissions are off the table. Does that mean the other sectors have to produce reductions to make up the difference? For this analysis I just assumed that all sectors have to reduce their emissions 40% less than their 1990 baseline emissions. I assumed a linear reduction from 2022 to 2030 to estimate the annual emissions.
The total emissions shown in the following graph shows that GWP-20 values are significantly higher than GWP-100 values. In the baseline year of 1990 the total GWP-20 emissions were 404 million metric tons of carbon dioxide equivalent (MMT CO2e) and the GWP emissions were 314 MMT CO2e or 29% higher. In the last year of observed data, 2020, the GWP-20 emissions were 345 MMT CO2e and the GWP emissions were 245 MMT CO2e or 41% higher. Does that mean that changing to GWP-100 will the State can take less aggressive action to reduce emissions? Between 1990 and 2020 the total GWP-20 emissions dropped 15%. In order to meet the 2030 targets GWP-20 emissions will have to be reduced 29% almost double the reductions observed over 30 years. On the other hand, GWP-100 emissions dropped 23% between 1990 and 2020 and will “only” have to be reduced a further 22% to meet the
mandated reduction of 40% of total GHG emissions by 2030. It does appear that less aggressive action is needed but as shown below I don’t think the 2030 target is achievable for either accounting system.
One other feature of the plots needs to be discussed before we can address the question whether the target is likely for either accounting approach. The last year of observed emissions was 2020 and that value is sharply lower than the general trend because of the pandemic shutdown of society. I chose not to make any sophisticated attempt to adjust emissions for that outlier. However, note that emissions in 2021 are higher than 2019 despite the general downward trend. That is entirely due to the State’s misguided shutdown of Indian Point and the resulting increase in emissions.
To gain a perspective of the relative importance of sector specific emissions I list the emissions by sector for each GWP accounting methodology below:
One of my biggest concerns with the Scoping Plan is that it did not include a feasibility analysis. This is particularly troublesome with regards to the schedule for the mandated targets. If we consider the following graphs for each sector specifically looking at the rate of reductions required compared to historical emissions it does not appear to me that the targets are achievable.
I am most familiar with the electric sector. The following graph shows the GWP-20 and GWP-100 emissions for just that sector. The increased emissions associated with the shutdown of Indian Point and resulting fossil fuel generation emissions increase to replace that zero-emissions resource is clearly visible. The first reaction looking at the emission trends could be that the slope of both emission trajectories from 2006 to 2018 is roughly consistent with the trend necessary to meet the 2030 target from 2022 to 2300. There is a problem with that perception however. The observed reductions from 2006 to 2018 were primarily due to fuel switching away from coal and residual oil to natural gas. There are no more opportunities for fuel switching emission reductions. In order to reduce electric sector emissions, zero-emissions wind and solar resources must be deployed to displace fossil generation at the same time load is expected to increase due to the electrification of other sectors. I believe that the lack of a feasibility analysis to prove this is possible will prove problematic by 2030.
I am not familiar with the control strategies for other sectors but the same unsettling emission trajectory reduction rates are apparent. The biggest source of emissions using GWP-20 is buildings. Because GWP-20 accentuates the effect of natural gas, there will have to be a real concerted effort to switch existing building sector gas away from natural gas. In my opinion neither emission reduction trajectory rate looks realistic relative to historical emissions but the GWP-20 rate (31% between 2020 and 2030) is more unlikely.
Transportation is the next highest emitting sector for GWP-20 accounting and is greater than buildings for GWP-100. From 2010 to 2018 both emission trajectories were very similar. Clearly the emission reductions necessary in this decade are considerably faster than anything observed in the past. I am not aware of any indications that the public is ready to embrace electric vehicles at the rate necessary to meet this reduction trajectory.
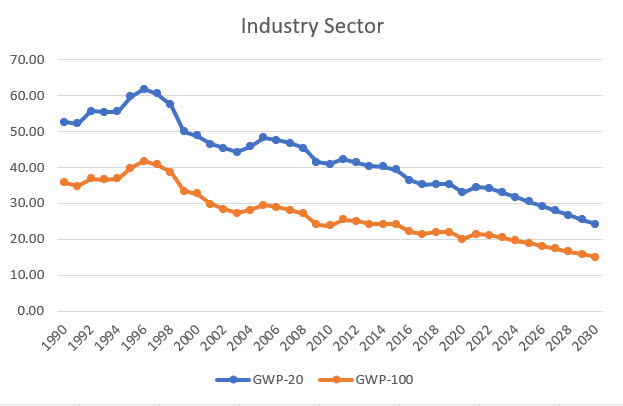
The industrial sector emissions reductions have been steadily decreasing since the mid 1990’s. Unfortunately, that is more a reflection of the business climate of New York rather than any clean energy strategy. The Climate Act includes provisions that are supposed to prevent further reductions in this sector to save jobs but no details have been provided. This is another instance where it may be decided that other sectors must provide reductions so that the state GHG emissions meet the 2030 target.
The waste sector emissions trends are interesting. I did not try to figure out what was going on between 2008 and 2009 when there is an obvious step change in GWP-20 emissions from 43 MMT to 38 MMT CO2e. In my experience with emission inventories any change that drastic was caused by some error in my work. More importantly, a 30% emissions reduction (12.6 MMT CO2e) is required from 2020 to 2030 in order to meet the 40% reduction from the 1990 baseline mandate. Note, however that while the GWP-100 required emission reduction is only 4.6 MMT CO2e it still represents a 30% reduction. I am not aware of any control technology that can be expected to provide that kind of reduction.
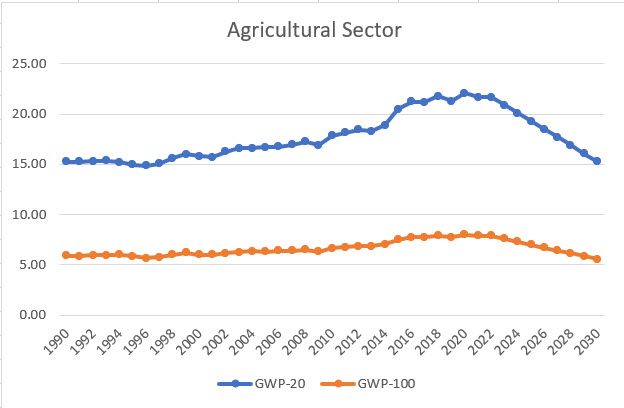
I include the agricultural sector for completeness but caution that I don’t know how the emissions will be handled. I know that some emissions are exempt but exactly how many I do not know. In any event the effect of the methane bias is obvious. It also is obvious that expecting the agricultural sector to make its share of emission reductions is unlikely.
Discussion
I do not think the proponents of the Climate Act understand how difficult it is to reduce GHG emissions. In the electric sector the only readily available emission reduction approach is to switch to a lower emitting fuel. There are no more opportunities to fuel switch in New York and there is no add-on cost-effective control option available. As a result, the only control option left is to reduce operations. The Scoping Plan presumes that wind and solar will be deployed such that the fossil generators will be displaced as required by the Climate Act schedule. However, the Integration Analysis did not include a feasibility study to prove that would be possible while current reliability standards are maintained.
As difficult as it is for the electric sector to reduce GHG emissions, that is the sector where reductions are most feasible. In general, the problem with all the “clean energy” solutions is that they don’t work all the time and the time when they don’t work is the time, they are needed the most. For example, in the building sector, air source heat pumps are touted as the replacement for fossil-fired furnaces. Despite the claims that they work fine, there is a point when air source heat pumps do not provide sufficient heat in really cold weather. That issue can be addressed by upgrades to the building shell but that in turn requires upgrades to the ventilation system. In order to provide a system as resilient as a fossil-fired furnace the costs of all the additions to the home will be so great that they are not saving enough energy to make the investments cost effective. The Integration Analysis did not include a feasibility study to demonstrate what would be needed to maintain the same level of resiliency for residential home heating or any of the other components of the net zero transition.
When Governor Hochul tried to sneak in a fossil-fueled methane accounting method that would gut New York State’s Climate Act during the final push of budget negotiations, New York’s climate and environmental justice movement responded swiftly and powerfully. NY Renews is proud to stand with a movement that stopped—for now—changes to New York’s progressive 20-year methane accounting method as written in law.
Based on these numbers I don’t disagree that using the 100-year GWP makes the emission reductions less problematic. However, the emission reduction rate trajectories necessary to meet the 2030 40% reduction mandate are so much greater than anything in the past that I do not think the accounting approach is going to matter. As a result, the over-the-top rhetoric about the importance of the 20-year GWP accounting approach is unwarranted.
The Hochul Administration lost control of the Climate Action Council and allowed naïve and uneducated ideologues to control the narrative. The global warming potential issue is one example of a technical consideration that was chosen based on emotion rather than a full understanding of the ramifications. In this instance the one unarguable negative aspect of the 20-year GWP is that it precludes New York from joining any other emissions market program with other jurisdictions. If New York cannot join other jurisdictions, then they will have to develop all the infrastructure for their system on their own.
Inevitably, there will be another flash point issue. The lack of a feasibility analysis to prove that reductions at the rate necessary for any sector to meet the 2030 targets kicked the problem down the road. The insistence that the Climate Action Council could not consider a “plan B” if targets could not be met means there is no contingency plan in place. When the reality that the 2030 40% reduction mandate cannot be met becomes obvious that will incense New York’s climate and environmental justice movement who will undoubtedly demand that the targets must be met. As explained above the ultimate control strategy is to stop burning fossil fuels. Hochul will have to choose between keeping the lights on, gasoline obtainable at the pump, and natural gas available for homes against meeting the arbitrary emissions reduction mandate of the Climate Act.
This is a guest post written by Gary R. Schoonmaker. Gary sent me four essays he wrote describing his concerns about the Climate Leadership and Community Protection Act’s impacts on freedom of choice and the implementation of the Act. Because I think he raises some important issues I am publishing his essays in this post.
Gary R. Schoonmaker is a lifetime citizen of New York State; a licensed Landscape Architect with over 18 years experience at an electric and gas utility in New York State; and involvement in many environmental organizations in Central New York. He designed and built an energy efficient home in 1978 which had an air-to-air heat pump and now has solar panels; and has over 40 years experience in real estate development. I published a post describing his comments on the Climate Act last spring.
Where is Freedom Going? The threat to Freedom in the United States is serious, but here in New York State the situation is dire!!! What has happened to the desire for freedom here? Are we really so willing to submit to the tyranny of the Democrat legislature and governor; to be taken care of by the nanny state that we will leave our freedom in the rear view mirror?
We are being told that the government knows so much better than we do what is best for us! When did we get to the point that we are willing to accept that? There are many examples over the last few years, but my principal concern today is with the Climate action initiatives. The state is on a path to do away with any but electric cars and using electricity for everything. Why is it reasonable that the state can dictate such a policy? What happened to our free will/agency as citizens/human beings?
No natural gas or propane appliances – stoves, furnaces, dryers; no gasoline operated vehicles or equipment; no wood burning at all. When did we give them the authority to dictate those conditions where we have no choice?
Our ancestors who worked so hard to give us this country/State would kick our butts for letting this happen!! My ancestors have lived and worked in New York State since before 1650 and I shudder to think what Hendrick would say if he was to show up and see what we have allowed our representatives to do. Frederick helped finance the American side in the Revolutionary War; do you really think he would support us giving up our freedoms to choose for ourselves what kind of transportation, heating, or other appliances are best for us?
If we allow this situation to continue, we have ceased being citizens and become subjects.
Which is more stable: A one legged stool or one with three or more legs?
The Climate Action Council is moving quickly to implement a program to terminate the use of any energy in the State of New York except electricity. That would leave us with an energy stool sitting on one leg. Have you ever tried to sit on a one-legged stool?
Right now, we have a stool with multiple legs: we have electricity yes, but we also have natural gas, propane, gasoline, etc. Why, when so many people are clamoring for diversity, and financial advisors recommend that no one put all their money in a single investment; does the State legislature and Governor think it wise to get rid of all forms of energy except electricity? I won’t argue in this article about the efficacy of the climate change arguments, but just ask that you consider the wisdom of the proposed action.
If a fire had to be put out, would it be wise to only have water? Today, fire departments have a large number of options, depending on the type of fire they are asked to fight. Would it be advisable for the Legislature to dictate that the fire department only be able to use water? If the logical answer is no, then why is it wise to allow the legislature to dictate that we citizens only be able to use electricity to address our individual energy needs?
Beyond the logic is one significant threat that accompanies the sole use of electricity. There are two possible situations where this threat manifests itself: solar flares and an electromagnetic pulse (EMP). Either of these threats can destroy the electrical grid as well as each and every unprotected appliance/vehicle. That is a threat today, but the threat to our survival is magnified many times if the only energy we are allowed to have is electricity, because as opposed to today, we would have no backup for heat, cooking or transportation.
Can you say 1850?
Is there some kind of media blackout around the Climate Action Council’s Activities?
The New York State government (Legislature and governor), passed a law in 2019 called the Climate Leadership and Community Protection Act (Climate Act). That act set a goal of “net-zero carbon emissions for the entire state economy by 2050”. In order to implement that goal the legislation commissioned a Climate Action Council to develop a draft Action Plan and then a Final Action Plan. In January 2022, the draft action plan was published and public hearings were subsequently held across New York State. If this is news to you, I expect you are in the majority of citizens of New York State.
When I heard about the public hearing in Syracuse, it was only a couple of days before they were to be held and I had seen nothing on the news or in newspapers about them. I heard about it on a local Saturday morning radio program discussing how to maintain your home. I got online and researched what they were talking about and couldn’t believe what I was reading.
I labored about what to do, if anything, and finally decided to go to the public hearing and express my deep concerns for what they were proposing. Imagine my surprise when I got to the only public hearing in Central New York to find there was not a single news crew covering the event. Maybe there was a reporter there (I didn’t see one), but no one was doing tv or interviewing any of the presenters as far as I could see. You know how these things usually are, reporters crowding around fighting to ask questions or get a quote for a story they are writing.
After waiting for over three hours, I got to make my two minute presentation. Many of the other people were from universities or environmental advocacy groups. There were a few people from business or unions there advising caution, but the vast majority of presenters were supportive of the State’s climate initiative.
When I got home, I watched the local news and saw not a word about the hearing that had just finished up regarding one of the most consequential plans to affect New York State since the Erie Canal. CRICKETS!! Over the following weeks, I saw no reports about any of the other hearings either. How is that possible? After the hearings, there was an opportunity to provide written comments so I sent in a six-page document elaborating on my two-minute presentation at the hearing. I still heard nothing in news programs about the Climate action plan. So, I decided to send my written comments to local and national news outlets and commentators. I received no response from any of them, nor was there any report about the plan, the council, or the comments. The closest I got was a brief acknowledgement on the Saturday morning radio program that had started me on my journey. To their credit, they have continued to talk about the plan off and on.
But beyond them….very little recognition of the building tyranny!
Is there really a legitimate Constitutional basis for New York State’s Climate Action Plan?
There are many ways to address this question: first, is climate change really an existential threat to New York State; and even if it is, does the State have the constitutional authority to take such draconian measure as are being proposed? While I personally do not believe that climate change is anything more than the natural order of the earth (Remember your elementary school studies where we were told that New York State was covered by thousands of feet of ice just 10,000 years ago?), I will leave that subject to others to debate. I don’t believe that it is in the governments’ authority to dictate the proposals being promoted in the Climate Action Plan (CAP).
It is part of our national fabric that freedom is a primary right of citizens. Everybody claims it personally and collectively, and yet the CAP is a direct assault on our personal freedom to choose and make our own decisions. Can anyone disagree with that? The Preamble to New York State’s Constitution states: “We the people of the State of New York, grateful to Almighty God for our freedom, in order to secure its blessings, DO ESTABLISH THIS CONSTITUTION.” The CAP unilaterally prohibits people from choosing what cars to drive, what heat to have in their homes, and how to cook their food, for a start. How is that securing the blessings of freedom for the people of the State of New York?
They are effectively destroying businesses that now sell natural gas, propane, gas appliances, firewood, and all associated businesses like auto repair, the list is endless! When we transitioned in the past, (think horses to autos, or kerosene to electricity etc…) people chose the change themselves. If you thought the change would be good for you, you invested your resources to make the change. If you had to buy a car, or wire your house you paid for it because you chose to do so. If you wanted to forgo the “modernization” you could do so also. Even today, we are still free to choose to light our houses with candles or kerosene, or ride horses instead of driving a car. Under the State’s CAP, we lose the ability to make those choices for ourselves (although perhaps we could still ride a horse, but who knows for sure?). So, who pays for the businesses that go out of business? In the past changes, businesses either adjusted or went out of business because their customers made personal decisions to not buy their products. But under CAP, businesses are being put out of business by an action of the State. Both the New York State and United States Constitutions prohibit the taking of private property for public use without just compensation. Can anyone really argue that closing down businesses (private property) for the CAP (a public use) doesn’t qualify for just compensation? The CAP does not plan for that, but it should!
I am not a constitutional attorney, but it seems pretty clear that the State constitution does not grant the government the right to unilaterally void the freedoms of our citizens. On the contrary, the constitution explicitly states that it was created to secure the blessings of freedom for the people of the State of New York.
The Climate Action Plan does exactly the opposite!
Concluding Remarks from the Pragmatic Environmentalist
In my opinion, the Climate Action Council did not do a good job justifying its actions. They have not provided adequate documentation documenting the costs of the control strategies that they have recommended and only now appear to be willing to acknowledge that it will be expensive. From what I have seen lately the real costs will be far in excess of what they are acknowledging now because the devil is in the details, More importantly, the Scoping Plan has not addressed reliability in enough detail to determine if the conglomeration of control strategies that they have cobbled together will actually work. Finally, the Hochul Administration has not updated its cumulative environmental impact statement to consider their latest estimates of the solar, onshore wind, offshore wind, energy storage, and whatever resource has to be deployed to provide zero-emissions dispatchable electricity. Combine that with the fact that the life-cycle of those resources have not been considered the Scoping Plan is an insult to environmental protections. Ultimately, the ideological insistence on zero emissions has taken alternative strategies off the table that would likely be less costly, maintain current standards of reliability, and have fewer environmental impacts. Against that backdrop there is absolutely no justification to implement the draconian policies described by Schoonmaker.
According to Merriam-Webster a kerfuffle is a disturbance or commotion typically caused by a dispute or conflict and it perfectly describes the response to the Hochul Administration’s proposal to make some changes to the greenhouse gas emissions accounting approach in the Climate Leadership & Community Protection Act (Climate Act). It is being described as revisions that will gut the Climate Act and reward the evil fossil fuel industry. This post explains why I think it injects a bit of sanity in the transition plan but misconceptions abound on both sides of all the ramifications.
I have been following the Climate Act since it was first proposed and have submitted comments on the Climate Act implementation plan and written over 300 articles about New York’s net-zero transition because I believe the ambitions for a zero-emissions economy embodied in the Climate Act outstrip available renewable technology such that the net-zero transition will do more harm than good. The opinions expressed in this post do not reflect the position of any of my previous employers or any other company I have been associated with, these comments are mine alone.
Climate Act Background
The Climate Act established a New York “Net Zero” target (85% reduction and 15% offset of emissions) by 2050. The Climate Action Council is responsible for preparing the Scoping Plan that outlines how to “achieve the State’s bold clean energy and climate agenda.” In brief, that plan is to electrify everything possible and power the electric gride with zero-emissions generating resources by 2040. The Integration Analysis prepared by the New York State Energy Research and Development Authority (NYSERDA) and its consultants quantifies the impact of the electrification strategies. That material was used to write a Draft Scoping Plan. After a year-long review the Scoping Plan recommendations were finalized at the end of 2022. In 2023 the Scoping Plan recommendations are supposed to be implemented through regulation and legislation.
Greenhouse Gas Emission Accounting System Revisions
– Reverts New York’s emissions accounting methodology to one using a one hundred year timeframe for assessing the global warming impact of emissions, moving away from the demanding accounting system mandated by the Climate Leadership and Community Protection Act. In doing so, this makes New York’s approach comparable to that employed by the IPCC, the U.S. Environmental Protection Agency, and the three other states – California, Oregon, and Washington – that have explicitly adopted a GHG accounting methodology.
– It specifically requires using full life-cycle analysis (using the Argonne Labs GREET model) for all systems resulting in GHG emissions in New York State, which will align the state with recent federal green incentive programs adopted in the Inflation Reduction Act. Access to those federal incentives will promote additional green energy investments in New York.
– Consistent with the use of full life-cycle analysis, it specifically requires the inclusion in the state’s emission inventory emissions related to the production and transmission of biofuels imported into New York State.
– It more appropriately measures the net emissions from renewable fuels, making these clearer alternative fuels available to New Yorkers at lower costs, by excluding from the state’s GHG inventory CO2 emissions from the combustion of biomass and biofuels. This approach is consistent with the United Nation’s Intergovernmental Panel on Climate Change’s accounting approach, and the GREET model, as these emissions were recently removed from the atmosphere and will be removed again in future growing seasons.
The Hochul Administration claims that changing the accounting methodology will also change the costs to consumers. Climate Action Council co-chairs Doreen Harris and Basil Seggos argued that:
“First and foremost, the governor is trying to maintain New York’s leadership on climate. It’s a core principle that she brought into office and we have been carrying that out for several years,” said Seggos.
But Gov. Hochul instructed both the DEC and NYSERDA to look at the affordability of Cap & Invest.
“We began running the numbers on that, based on some of the metrics being used by Washington state and some of our own, and revealed some…potentially extraordinary costs affiliated with the program,” Seggos explained. “So that’s really what this is. It isn’t a focus necessarily on methane itself, or any particular pollutant. It is how do we implement the CLCPA in a way that doesn’t put extraordinary costs on the pockets of New Yorkers.”
The task before DEC and NYSERDA is three-fold: To launch Cap & Invest, generate revenue to offset the cost of the transition and keep the whole system affordable.
The Climate Action Council’s scoping plan was released in December using the 20-year methane metrics. When asked if there had been a more recent analysis, NYSERDA’s Doreen Harris said yes.
“What the governor has asked us to do, and what we have now delivered, is an analysis around one piece (of the CLCPA), answering the question of how does one get from here to there,” Harris said. “This Cap & Invest proposal is an important part of not only capping emissions, but also investing revenues toward the change that we seek.”
Harris explained that under the CLCPA’s accounting framework, New Yorkers would be paying “substantially more out of their pockets, at the pump, to heat their homes and beyond.”
At the same time, she agreed that the original cost analysis of the transition by the Climate Action Council indicated that the benefits of action, using the 20-year methane metric, far outweighed the costs of the transition.
I don’t know what to make of these arguments. In the first place they offered no documentation to support it. In the second place Harris re-iterated the claim that “the benefits of action, using the 20-year methane metric, far outweighed the costs of the transition” without mentioning the caveat that the Scoping Plan only considered the costs of the Climate Act and not the costs of already implemented programs so the total costs of the transition were not considered in the claim. Importantly all the costs will directly affect New Yorkers but the benefits are societal benefits that provide indirect benefits. When all the costs and benefits are unraveled the Hochul Administration claim that the benefits out-weigh the costs are nothing more than a shell game. Finally, I think the Hochul Administration is worried about the ratepayer costs of the cap and invest program but that is only a revenue stream. The actual, and yet to be provided, costs are those associated with all the control strategies buried in the Scoping Plan recommendations. I am not sure how much of an effect, if any, the 20-year GWP accounting has on the amount of wind, solar, and energy storage resources needed for the net zero transition.
Activist Responses to the Proposed Revisions
In one word the response to the legislation has been “meltdown”. For example, NY Renews, a coalition of over 300 environmental, justice, faith, labor, and community groups that bills itself as the “force behind the nation’s most progressive climate law” had this to say:
S6030/A6039 is part of a larger pattern of attacks by the fossil fuel industry that threaten to sabotage New York’s nation-leading climate law, the Climate Leadership and Community Protection Act, and roll back hard-won standards for accurately accounting for the impacts of greenhouse gas emissions, particularly methane. If passed, the bill would change how the state measures methane and carbon dioxide emissions, pave the way for polluting corporations to emit without consequence, and harm the health and well-being of frontline community members who live, work, play, and pray in neighborhoods across NYS.
NY Renews unequivocally opposes the inclusion of this bill in the state budget and any deal that would include it. We’re calling on the state legislature to uphold the Climate Act as written into law and reject amendments that would threaten its power to protect and prepare New Yorkers facing the worst effects of the climate crisis.
Another example of the response is the April 3, 2023 “Save the CLCPA Action Party” webinar. It was an hour-long rally the troops to contact elected representatives. The meeting was in coordination with the Climate Action Now application that simplifies lobbying with actions in the app:
Like contacting your elected officials, emailing CEOs, or Tweeting at celebrities to step up – can be taken with just a few touches in just a few seconds. We’ve done all the work for you so that you don’t have to. Don’t know who your elected officials are? Give the app your location, and it will tell you. Don’t know how to contact them? The app has their phone numbers and Twitter handles. Don’t know what to tell them? We give you personalized, boilerplate messages that you can accept or modify.
As a result of the webinar 1500 messages were sent to elected representatives claiming that this legislation will eviscerate the Climate Act.
Finally, in an example of “if we don’t get our way we aren’t going to play” there was a Climate Act meeting boycott. On April 3, 2023 the Department of Environmental Conservation announced a meeting of the Climate Justice Working Group for the next day. This meeting was to include the approval of minutes from the previous meeting and a group discussion following the finalization of the disadvantaged communities criteria on March 27. All the Environmental Justice members of the Working Group boycotted or left the call because of this legislation so the call ended after only 45 minutes.
Discussion
I think this legislation introduces some rationality into the implementation process. There are no changes to the basic structure and objectives of the Climate Act so the claims of egregious harm of the proponents are unwarranted. The emission reduction targets and schedules stay the same but it will have several significant beneficial impacts.
The ideologues who wrote the Climate Act placed an inordinate emphasis on vilifying the use of natural gas to the point that they mandated a unique accounting methodology. Global warming potential (GWP) weighs the radiative forcing of a gas against that of carbon dioxide over a specified time frame so that it is possible to compare the effects of different gases. The Climate Act mandated the use of a 20-year GWP at the time when every other jurisdiction was using a 100-year GWP. One of the cornerstones of the Hochul Administration’s plan to fund the transition is a market-based program called cap and invest. If New York is ever to become a part of such a program with other jurisdictions it is necessary that our accounting is the same as everybody else.
There are effects on the achievability of the Climate Act reduction mandates relative to the use of the 100-year GWP rather than the 20-year GWP. It will reduce baseline and observed emissions on the order of 20 percent. It also shifts the emphasis on what needs to be controlled in each sector and the relative importance of sector emissions. I have no idea whether that makes achieving the targets easier or not.
I am intrigued by the provision that requires using full life-cycle analysis using the Argonne Labs Greenhouse gases, Regulated Emissions, and Energy use in Technologies (GREET) model. I am not familiar with that model but I believe that it is necessary for New York State’s cap and invest model to use standardized and replicable emissions accounting for the proposed cap and invest program. This model will likely fulfill that requirement.
Proponents of the proposed legislation claim that it will allow investors in New York to access significant federal tax incentives under the Inflation Reduction Act of 2022 (IRA) credits for clean fuel and clean hydrogen production, as these tax credit programs specifically require the use of the GREET model to determine climate impact scores. The discussion at the “Save the CLCPA Action Party” claimed that Senator Schumer had said that there was no link between the IRA and whether New York uses GWP-20 year accounting. I suspect that there is a technical issue here. If the IRA requires the use of GREET and GREET uses 100-year GWP, then I think it is an implicit requirement.
Ultimately NY Renews and its membership have an irrational hatred of methane that was exemplified by the 20-year GWP accounting methodology. During the “Save the CLCPA Action Party” each speaker argued that Dr. Robert Howarth’s vision of methane and the 20-year GWP accounting was correct and that he represented the best science on the subject. It is not clear to me why the David R. Atkinson Professor of Ecology & Environmental Biology at Cornell University is considered a climate scientist with impeccable qualifications that preclude any criticism of his arguments. His understanding of the role of methane on global warming is flawed. I charitably ascribe his incorrect views to his lack of background in atmospheric physics. I have summarized the methane issues ignored by Howarth. For starters, the measurements that quantify the difference between carbon dioxide and methane effects on radiative transfer are done on a molecule-to-molecule basis. The effect of those pollutants on global warming, which is the reason for the Climate Act, should account for the differences of those pollutants in the atmosphere not in the lab on a molecule-to-molecule basis. If the world outside a laboratory effects of concentrations in the atmosphere, the molecular weights instead of mass, the wavelengths where methane acts on outgoing radiation, and the saturation effect of GHG concentrations are considered correctly, the use of the 20-year GWP is not justified as mandated in the Climate Act.
Conclusion
On one hand it is encouraging to see that the Hochul Administration has recognized that their plans will have significant affordability impacts and are trying to do something about it. On the other hand, there still is no comprehensive accounting for their cost projections so we have to guess at the effects. In any event, the proposed legislation is a marked improvement over the existing Climate Act. If the goal is an ideologically pure green new deal then opposition is warranted. On the other hand, if the goal is to implement a GHG emissions reduction program that has an improved chance of actually working then it makes sense.
The following picture describes the Climate Act as it stands. As long as the State goes straight and does not have to consider what happens if we have to make a turn then it might work. When that does not happen there will be consequences.
The plan for New York’s Climate Leadership & Community Protection Act (Climate Act) net zero transition is to electrify everything possible using wind and solar generating resources. My primary concern is the reliability risks associated with the transition of the electric grid that took decades to develop based on dispatchable generating resources to one that depends upon intermittent and diffuse wind and solar by 2040. This blog post highlights articles that reinforce my fear that the reliability of any electric grid that relies on wind and solar is fatally flawed.
I submitted comments on the Climate Act implementation plan and have written over 300 articles about New York’s net-zero transition because I believe the ambitions for a zero-emissions economy embodied in the Climate Act outstrip available renewable technology such that the net-zero transition will do more harm than good. The opinions expressed in this post do not reflect the position of any of my previous employers or any other company I have been associated with, these comments are mine alone.
Climate Act Background
The Climate Act established a New York “Net Zero” target (85% reduction and 15% offset of emissions) by 2050. The Climate Action Council is responsible for preparing the Scoping Plan that outlines how to “achieve the State’s bold clean energy and climate agenda.” In brief, that plan is to electrify everything possible and power the electric gride with zero-emissions generating resources by 2040. The Integration Analysis prepared by the New York State Energy Research and Development Authority (NYSERDA) and its consultants quantifies the impact of the electrification strategies. That material was used to write a Draft Scoping Plan. After a year-long review the Scoping Plan recommendations were finalized at the end of 2022. In 2023 the Scoping Plan recommendations are supposed to be implemented through regulation and legislation.
Australian Renewables Integration
Chris Morris – a semi-retired power station engineer from New Zealand, and Russ Schussler – an electrical System Planning Engineer, have written a series of three articles about the unfolding disaster in Australia as they implement a net-zero electric grid.
The first article explains what they are doing in Australia and what is happening to their electric grid. Although there are significant differences between the Australian electric system and the North American system, there are proposals that will reduce those differences. In particular, the Biden Administration plan to eliminate fossil fuels as a form of energy generation in the U.S. by 2035 with targets of 80% renewable energy generation by 2030 and 100% carbon-free electricity five years later, will inevitably lead to the same problems already observed.
The authors explain that:
Wind and solar, the unreliables, are now a significant part of the current NEM generation but the backbone is still coal – over 60% of the energy. Wind is less than 15% and grid solar 5%.
They note that “There is also the significant presence of domestic PV”. Importantly. they found that: “even at those levels, the intermittency and unpredictability has had major detrimental impacts on power stability.” In particular, they state:
Management of the grid on a day-to-day basis depends on reliable generation and dispatchability. The renewables offer neither. For wind, there is often the mantra that the wind is blowing somewhere. The actual data does not back that up. A skeptic has for a number of years compiled the daily wind generation on the NEM. The results are revealing. The graph shown below is for just one month, June 2022. There is a synchronicity in the output of all the windfarms. To cope with the drop in those declines from wind, that is a lot of power that needs to be quickly ramped up. If the wind isn’t blowing and it is night-time, where will the energy to make up the dip come from? The mainstay 400MW+ coal units that form the background of the energy supply can take three days to get to full load if cold.
I maintain that current wind, solar, and energy storage technology is inadequate to support an electric system that can maintain current standards of reliability. The second article describes some of the innovations that are being tried in the Australian transition and note that they hype about “success” does not match reality. Both authors are engineers and describe some issues associated with the required new technologies. For example, there is a tendency to dismiss identified problems because there is a project or work by academics that claims industry changing innovations are just around the corner. They show that these “claims are often overblown or misunderstood”.
Advocates make claims about the penetration of wind and solar resources in components of the grid without admitting that the numbers they cite are only possible because of support from outside the component traditional generating resources. One major problem with wind and solar is that fossil-fired, nuclear, and hydro generating units produce electricity by spinning turbines that are synchronized to run at 3600 revolutions per minute. That inherent characteristic provides necessary support to the transmission system. Wind and solar generators are asynchronous and do not provide that service. The authors explain the ramifications:
Not too long ago many pointed towards Germany as showing how a grid could accommodate high levels of renewables. This was a very misleading picture. The physics of the grid do not care who owns what. Synchronous resources from a neighbor’s generators provide support across the European grid, despite differences in language and nationality. Electricity flows quickly, approaching the speed of light, over every potential path to support all parts of the system regardless of who owns what. The German component is supported by conventional generation from neighboring systems including coal resources in Poland.
The article goes on to evaluate specific claims about the South Australian component of the grid related to synchronous power. It turns out that in South Australia they have installed “synchronous condensers to maintain the grid without their synchronous gas generating units”. When anyone claims that wind and solar are cheaper than natural gas units, they are not incorporating the cost of some technology like synchronous condensers necessary to keep the lights on.
Schussler has previously explained that there are two major problem areas with the net zero transition: getting energy from renewables instead of fossil fuels and having the grid work with intermittent asynchronous renewable resources. Clearly if we are to have a working system it is necessary to address them together. As it stands now the emphasis in Australia and New York for that matter, has been on the first problem. The authors note “It is mind-boggling that an entity committed to an energy transition would seek to maximize efforts in regard to changing energy resources while hoping a miracle will occur allowing that energy to be delivered in an economic and reliable manner.” They go on to say (their emphasis included):
It is simple to take out coal, if you don’t care what happens next. It is going to be incredibly difficult, if at all possible, to enable the replacement. Significant roles will be demanded from all resources but that may not be enough. A lot of attention needs to be paid when baseload generation comes off, and a lot of challenges without practical solutions will likely emerge. A lot of needed things needed don’t exist yet and may not ever exist. The energy system may be unrecognizable, maybe because it will no longer resembles an economic and reliable power system.
The third article discusses other ancillary services that are necessary to keep the electric system operating reliably and then goes on to see how the grid is being impacted by increasing levels of wind and solar resource deployment. I am not going to describe their concerns about reactive power, frequency control, & inertia, reserves, load shedding, system functions during frequency excursions except to note that all these issues were ignored in the Scoping Plan. If you are interested in reliability issues, I recommend the article. The authors conclude:
The above is a simplified explanation of what is needed for reliable grid operation. Proponents of renewable energy do not want to discuss concerns of this sort, particularly the costs involved. When forced to address these issues, they rely on magical thinking, advocating for technologies that either do not yet exist or have not yet been proven to work reliably on a grid. The known solutions are expensive, but the renewable sector doesn’t want to pay for them – their mantra remains that renewables are cheaper than fossil fuels so the others should pay for them – hiding the expense. Add in the costs from the needed system support requirements described above, then renewables are significantly more expensive (and less reliable) than conventional generation. The extra costs of renewables support are being paid for a deteriorating quality of electricity supply. That is why there is a new industry adage – Cheap renewables are very expensive.
Futility of Wind Power
Francis Menton writing at the Manhattan Contrarian describes a new report by Bill Ponton that explores the effects and costs of continuing increases in generation of electricity from wind titled “The Cost of Increasing UK Wind Power Capacity: A Reality Check.” . This analysis addresses what I call the ultimate problem of an electric grid relying on wind and solar. The variability of those two resources is so great that there are huge issues trying to plan and develop the resources needed for periods when both resources are weak or nonexistent.
Ponton examines the relationship between energy generation and power capacity for wind resources. This is the same issue mentioned in the first article described above. In particular, advocates claim that all that needs to be done is to have the political will to build enough renewable generation capacity. What they don’t consider is just how much would be needed. In Ponton’s analysis he increases the wind generation capacity for every hour in a record of generation and load for 2022. He finds that because the wind lulls cover so many facilities that doubling the generation capacity does not double the percent of UK electricity from wind from 24% to 48%, but only to 40%. He then goes on to triple and quadruple the wind resource capacity to produce the following graph:
Note that the percent of generation from wind approaches a limit asymptotically. The percentage of electricity generated from wind deployment in any scenario still experience rapidly slowing increases as more wind capacity is added, and will approach a limit asymptotically. Menton points out that “This means that each incremental addition of wind generation capacity produces electricity that is more and more costly, with the costs accelerating rapidly after the tripling of existing capacity.” Menton promises that he will follow up with more results from the Ponton report so stay tuned.
Conclusion
All of these articles raise significant reliability concerns that were ignored in the Scoping Plan. Morris and Schussler believe it is “most likely that costs will increase significantly and reliability will degrade considerably” even if Australians do a great job of implementing all the planned changes. I agree with their conclusion that “Higher energy costs will hurt their consumers and industry while moving manufacturing and industry away from Australia to areas with cheaper (fossil fuel based) energy. The end result may cause far greater environmental harm.” If New York fails to heed these warning the result will be the same.
The expected costs associated with the Climate Leadership & Community Protection Act (Climate Act) for the net zero transition plan are poorly documented. This article describes costs associated with offshore wind transmission requirements as part of my on-going effort to consolidate cost estimates in one place.
Update 22 June 2023: NYISO chose Propel Alternate Solution 5 at $3.28 billion.
Everyone wants to do right by the environment to the extent that they can afford to and not be unduly burdened by the effects of environmental policies. I submitted comments on the Climate Act implementation plan and have written over 300 articles about New York’s net-zero transition because I believe the ambitions for a zero-emissions economy embodied in the Climate Act outstrip available renewable technology such that the net-zero transition will do more harm than good. Every indication is that the costs will be astronomical as well. The opinions expressed in this post do not reflect the position of any of my previous employers or any other company I have been associated with, these comments are mine alone.
The implementation plan for New York’s Climate Act “Net Zero” target (85% reduction and 15% offset of emissions) by 2050 is underway. At the end of 2022 the Climate Action Council completed a Scoping Plan that recommends strategies to meet the targets. The Hochul Administration is developing regulations and proposing legislation to respond to those recommendations in 2023.
Unfortunately, the Scoping Plan is just a conglomeration of control strategies that are projected to provide the emission reductions required. The inadequate analysis and documentation do not demonstrate the feasibility of the recommended strategies. Furthermore the costs of the program and potential costs to individual New Yorkers are hidden in a shell game con for hiding the true costs. In the Scoping Plan, costs are compared to a Reference Case that includes already “incremented programs”. As a result, the costs that are presented do not include all the costs of the net-zero transition.
Long Island Offshore Wind
The Department of Public Service has an Order for Public Policy Transmission Need (PPTN) (Case 20-E-0497) regarding Climate Act requirements related to offshore wind that drive the need to expand the number of transmission facilities between Long Island and the rest of the State. Climate Act goals include the development of 9,000 MW of offshore wind generation by 2035, with perhaps 6,000 MW connected into New York City. The Public Service Commission has concluded that offshore wind generation connected to Long Island is identified as “high” risk and would be curtailed unless something is done. Transmission expansion that increases the transfer capability from Long Island to the rest of New York is expected to significantly reduce the potential for offshore wind curtailment.
The New York Independent System Operator (NYISO) Electric System Planning Working Group (March 24, 2023 and April 3, 2023) is addressing independent cost estimates developed by NYISO’s consultant for proposed projects to address this issue. This is all preliminary work so the cost estimates are subject to change but they give an idea of what is needed to get the offshore wind generated to where it is needed. The cost estimates considered required material and labor cost by equipment, engineering and design work, permitting, site acquisition, procurement and construction work, and commissioning. The analysis found that the primary cost drivers were terrestrial and submarine cable length, HVDC converter systems and PARs, and the scope of the project (i.e., number/size of transmission facilities).
Cost estimates for sixteen projects were evaluated as shown in the following table. The average total cost estimate was $7.1 billion, the maximum was $16.9 billion and the minimum was $2.1 billion.
The Long Island PPTN project simulations all show improvements in the export capability of Long Island by adding tie lines between Long Island and the lower Hudson Valley. This added transfer capacity and upgrades to the internal Long Island system reduce the amount of curtailment from offshore wind resources. The energy produced through reduced curtailment of offshore wind resources can then be used to offset more expensive generation to meet New York’s energy demand and, therefore, produce a production cost savings. Production cost savings are also created by offsetting high-cost energy imports from neighboring regions with lower cost New York-based generation that was previously inaccessible due to transmission congestion.
In general, all of the proposed projects produce savings by unbottling offshore wind resources in Long Island and reducing the amount of imports from neighboring regions. The figure below shows the estimated production cost savings for each project over a 20-year period in 2022 real million dollars.
The baseline scenario estimated 20-year production cost savings (2022 $M) average $99 million, the maximum is $110 million, and the minimum is $39 million. The policy case scenario savings average $347 million, the maximum is $458 million, and the minimum is $291 million. (I don’t have the costs for the Policy + B-VS scenario so I do not discuss that scenario.) The difference between the total estimated cost and the production cost savings is the amount that must be subsidized indirectly to the ratepayers. The annual subsidies over 20 years range from $823 million to $90 million and average $339 million.
I am not impressed. Without this connection upgrade as much as 92% of the 3000 MW of off-shore wind which costs $15 billion would not be deliverable. However, it comes at an annual average subsidy of $339 million.
Discussion
Unfortunately, the indirect subsidy costs described are not the only costs. These costs are only for the new transmission and do not include additional costs associated with the impacts on the existing transmission and distribution systems on Long Island. In addition, this is the cost associated with 3,000 MW of offshore wind. The Climate Act goal is for 9,000 MW and the Scoping Plan Integration Analysis projects that 12,675 MW of offshore wind will be needed by 2040 in the Strategic Use of Low-Carbon Fuels mitigation scenario. If the transmission costs are proportional that would mean that this indirect subsidy alone would be at least $1,356 million a year for the Integration Analysis.
There are a couple of other things to keep in mind. The Integration Analysis cost documentation is inadequate so I cannot be sure but I am confident that none of these costs were included in the Integration Analysis. This further weakens any claim that the net zero transition will provide cost-effective emission reductions. The other thing is that the only cost number associated with the cap and invest program proposed by the Hochul Administration is for a universal Climate Action Rebate that is “expected to drive more than $1 billion in annual cap-and-invest proceeds to New Yorkers.” In other words, the State will make a big deal about giving New Yorkers a rebate at the same time there will be indirect cost subsidies that are approximately the same. This is yet another example of shell game scams with the Climate Act costs.
Conclusion
There are two reasons that the Hochul Administration has not provided comprehensive cost estimates. The first is that they don’t know the all-in costs because those numbers can only be developed on the basis of detailed analyses like this proceeding. The second is that they don’t want to know and they certainly don’t want the voters to know the mind-numbing costs.
This example of one aspect of the transition plan shows that the capital costs for getting the offshore wind to where it can be used most effectively are enormous, and the savings are miniscule which means enormous subsidies to be paid for by all New Yorkers. New York GHG emissions are less than one half of one percent of global emissions and global emissions have been increasing on average by more than one half of one percent per year since 1990. This does not necessarily mean that we should not do something, but it does mean that we have time do something that we can afford. Until such time that detailed analyses like the kind of analysis described here are completed this process should be paused.
Richard Ellenbogen frequently copies me on emails that address various issues associated with New York’s Climate Leadership and Community Protection Act (Climate Act). I asked his permission to present his analysis explaining why New York’s building decarbonization push it is going to fail, just as Germany’s has, and will drive up state GHG emissions and raise utility costs for decades. He has consolidated all of his material on this topic in one document and has included recommendations for an alternative approach.
I have published other articles by Ellenbogen because he truly cares about the environment and the environmental performance record of his business shows that he is walking the walk. Ellenbogen is the President of Allied Converters that manufactures food packaging. His facility is about 55,000 square feet and does a lot of manufacturing with heat to seal the bags, all electrically driven. The facility has solar panels and uses co-generation. He explains:
In 2008, the average energy cost per square foot for a commercial facility in Westchester was $1.80. We were at 16% of that 12 years later and even with the increases, we are at 62% of that 14 years later. That has been done while having a carbon footprint 30% – 40% lower than the utility system. The $1.80 per foot also included commercial office space and our operation is far more energy intensive than an office. We use energy extremely efficiently and as a result, our bills are much lower than everyone else.
Ellenbogen on Building Decarbonization
While it is being proposed with good intentions, NY State’s building decarbonization push is going to fail, just as Germany’s has, and will drive up state GHG emissions and raise utility costs for decades. The analysis to justify that conclusion follows. While there is new material included, a portion is a synopsis of prior emails but as NY State gets closer to committing energy suicide, I felt obligated to put it all in one document. As it is written, the state’s energy plan is going to be the fossil fuel company’s best friend. NY State is adopting a “Chicken Little” approach to energy policy. It is so focused on the acorn of fossil fuels and a belief that the sky is falling that it is ignoring science in the process. As a result, the state will fall victim to the fox of energy failures, high GHG emissions, and incredibly high utility rates that are going to eat NY State citizens and businesses. For those who declare that NY State must exhibit “Climate Leadership”, this policy isn’t that. It is copying a failed policy from Germany. For those not interested in the minutiae of the reasoning, the figure headlines and the final recommendations will give an accurate picture of the problems.
There is a way to get about a 44% GHG reduction in NY State while also having enough generation to support the system without imposing extremely high costs on the state’s residents and businesses. It can be implemented in one-quarter the time of the state’s current plan using a combination of improved fossil fuel plants and renewables, while replacing old gas equipment with newer gas equipment that won’t require an entire rewiring of NY State.
In lieu of doing something that will actually work, the state’s plan will face the following issues:
1 – Cost – Trillions of Dollars
First of all, the cost of the project will not be anywhere near as inexpensive as the $200 billion figure that is being thrown around. Going through all of the figures, it will be at least $600 billion for the electrification portion, before adding storage and renewable generation to the totals. For anyone that doubts that, the cost of a single 400 mile cable from Quebec to NY City has now risen to $6 billion and try to name a single infrastructure project in NY State that has come in on budget. The Champlain Hudson Power Express Cable was projected to cost $2 billion in 2013. That cost is now up to $6 billion, a 232% increase in inflation adjusted dollars. Does anyone seriously believe that the entire state can be rewired for less than 100 times that cost? If you add in storage costs at the present cost of Lithium Ion Batteries, the cost rises to approximately $4 trillion plus the cost of the renewable generation. Even if you could get a 75% reduction in storage costs using a different technology, the total cost will be well over $1.5 trillion and much of that will depend on the usable life of the new storage. At present, battery storage only lasts 10 years. Pumped Storage would likely be much more cost effective but where in NY State can a utility site a large reservoir. Also, based upon Con Ed’s experience with Storm King Mountain between 1960 and 1980, no utility will even try to build a pumped storage facility.
2 – Logistics – Size of Project and Lack of Labor will result in it requiring Over 60 Years – Policy is going to create situations where the mandates cannot be fulfilled
There are 112,000 miles of roads in NY State. Of those, about 22,000 miles are major highways and likely don’t have electric distribution lines on them, leaving about 90,000 miles of distribution lines that were designed and sized for an era where onsite heating was delivered from fossil fuels or wood. The vast majority of the transformers and conductors will not handle a tripling of the electric load during the during the winter. If you eliminate 18,000 miles (20%) for areas upstate that are already using electric heat, that leaves 72,000 miles of distribution network to be rewired. 8,000 of those miles are in NY City where a substantial portion of the infrastructure is buried and the costs will be higher still.
When I did the utility project with Con Ed back in 2010 where we demonstrated that we could reduce transmission loads and line losses using reactive power correction on the local distribution system, I added power monitoring devices to four transformers. On hot days during the summer, three of the four transformers where the project was executed were operating at or near their capacity on a hot summer day. If heat pumps are added to the system, the winter time load on a cold day will be substantially higher than the summer time load on a hot day. That is not my speculation. The NYISO has determined that NY State will need an additional 25 Gigawatts of generation to support heat pumps in NY State. during the winter. Winter peaks are expected to exceed summer peaks starting in the early 2030’s.
As a result, a substantial portion of that 90,000 miles will need to be rewired to support onsite electrification. Using an existing project in California as a reference, PG&E has been required to bury 10,000 miles of high voltage transmission lines in the fire prone areas. In 2022, they replaced 71 miles of cable. By 2025, they expect to increase that to a rate of 1200 miles per year. That doesn’t include replacing transformers or services to people’s homes which would be required to electrify onsite heating. Even larger conductors will have to be added in rural areas of NY State where they expect to interconnect large solar arrays so that the projects don’t keep getting canceled because of interconnection costs. While replacing overhead lines would take less time than burying them, replacing old equipment with higher capacity equipment for the larger heating loads and the additional time needed to increase the service sizes into people’s homes would about offset the time difference.
At 1200 miles per year, rewiring 72,000 miles of distribution lines in NY state will take 60 years to upgrade. They have been burying larger electric and gas services in New Rochelle to support the extra 9,000 units of housing that they are building here and the roads have been like a slalom course for about 4 years to fix about 10 miles of services so the 60 years is not an unrealistic estimate. NY City may take even longer to rewire and that is 40% of the state’s population. What is going to happen to the people that cannot replace their gas equipment in areas where the service has not been upgraded to support the higher electric loads imposed on the system by NY State policy ?
3 – Bad Science Is Driving Initiatives – Results Will be Far worse than Estimated and It will add Enormous Costs On the Backs of the State’s Citizens
I have read extensively about the PAF (Population Attributable Fraction) technique that was used as the analytical tool to do the analysis for the recent paper about gas stoves and childhood asthma. A slide from an upcoming PowerPoint that I will be presenting is below. The caption at the bottom of the slide was copied from the introduction of a paper discussing PAF by people that developed an improvement to PAF. However, the improved version needs very specific data directed at the variables involved, and not 30 – 40 year old data that was not asking the necessary questions from a time when the focus on health issues was very different. Every PAF study with multiple variables warns of bias in the study and questionable results, whether it is from sugar intake and type 2 diabetes to comorbidities and Covid. Asthma falls into the multiple variable category. Risk factors can include tree pollen, second hand smoke, proximity to large emission sources such as factories or power plants, pet dander, vehicle exhaust, nutrition, and yes, even gas stoves, among others. But unless all of the data on the other variables was collected in the survey, PAF will return garbage, even in the updated format proposed by the authors of the PAF improvement. Thus, the conclusions of the gas stove report have no validity.
Another issue never explained by the authors of the gas stove study is why the top ten states for cases of asthma in the US are all 80% electric stoves and the top eight states for childhood asthma are 80% electric stoves. If gas stoves were that large of a factor, at least one of the five states that is primarily gas stoves would appear higher on those lists. The conclusions of the study could possibly be correct, but no one could be sure because the study was so poorly conceived, conducted, and analyzed. It certainly should not be used as the basis for a public policy affecting 19.5 million people that is going to add an additional $72 billion in costs onto the backs of the state’s utility customers. Results that will be at least 95% – 98% as effective can be obtained at a fraction of that cost using other techniques.
4 – Existing Transmission and Distribution System Will Not Support Installation of Large scale Renewable Generation – Too Many Resources are Being Wasted on Projects that will Yield No Environmental Benefits. Not Enough is being spent On Grid Infrastructure to support renewables and vehicle electrification.
Another major issue, and one that is severely impacting the installation of renewables is the fact that the state’s utility system is wired backwards for what policy makers are trying to do with it. The utility system was wired to have large sources of generation distributing energy outward from a few locations. Now, the state is trying to site large generation sources in remote locations where the infrastructure won’t support it. As a result, renewable generation installers are faced with long transmission line runs to interconnect into the system, making the projects non-cost effective. The projects are being cancelled and as a result, NY State is falling well behind in their installation schedule that was already insufficient to fulfill the state’s requirements.
This is also apparent with regard to the 9 GW of offshore wind. There is a major concern about the availability of space to run the cables to interconnect the energy to where it is needed. One possibility is running the cables across Long Island in an environment where every infrastructure project is faced with lawsuits. As a result, even if they can build the 9 GW of Atlantic Wind, they may only be able to interconnect about 6 GW to where it is needed. That is clearly shown in another slide from the upcoming PowerPoint documenting a critical page in a NY State Power Grid report, below. Transferring renewable generation installation projects to NYPA may increase the rate of installation slightly but the node analyses will still have to be done that takes five years at present and the transmission lines will still have to be installed so the price will not be reduced.
5 – Air Source Heat Pumps On a System Not Fully Supported By Renewable Generation Will Not Reduce GHG. There are not Enough Drillers to install Ground Source Heat Pumps, which actually work, in any time frame that will yield significant results.
As is clearly documented in the slide below, putting electric onsite heating into buildings that are not fully supported by renewables just shifts the load to existing generating plants. In Germany, heat pump installation, primarily air source, exceeds gas combustion installation. However, despite installing massive amounts of renewable generation, while their household carbon emissions have declined by 28% since 1999, their utility system carbon emissions only declined by 3.4%. While they closed nuclear plants, they actually installed more Gigawatt hours of renewables. They should have seen a large GHG decrease, but heat pumps running on a system that uses fossil fuel generation add marginal additional load to the fossil fuel plants with higher emissions than an efficient gas boiler/furnace.
Germany is playing “Whack-A-Mole” with its building emissions and NY State is about to do the same thing. They beat down the emissions in one place and they pop up somewhere else. That chart was copied from a Yale publication “Can Germany revive its stalled energy transition?” published in about 2018. Based upon events 4 years later, the answer has been a resounding “NO” Even prior to the war in Ukraine, Germany was reopening coal plants. After the war started and they lost their gas supply, they opened even more coal plants and there were news articles about people across Europe stealing firewood, cutting down trees, and burning anything that they could find to stay warm. That will be the future of NY State with the proposed policies. Germany has been exceedingly lucky this year with a relatively warm winter, however they recently signed an agreement with Qatar to import 20 million metric tons of Liquid Natural Gas over the next ten years.
As the chart shown below from a Cornell Geothermal report clearly show, all additional load added to the system is supported by fossil fuel generation. Blue and Brown lines were added after to explain the difference between the upstate and downstate generation sources which in 2019 were within 5% of each other. However, in terms of zero emissions sources, they were worlds apart. The downstate system is almost entirely supplied by fossil fuels.
6 – Battery Storage is being added to the System Prematurely. The batteries will wear out at least 50 years before the state has enough renewable generation to charge them. As a result, they will be charged with fossil fuel generation with a 15% – 20% higher carbon footprint than the actual generation.
As all marginal generation in NY State is provided by fossil fuel generation, all new battery systems that are added will increase fossil fuel generation by a minimum of 15% related to that stored energy as 15% of the battery’s energy is lost in the Charge/Discharge cycle. The batteries will need to be replaced after about 10 years, well before the system will be supported by renewable generation. This is great news for Elon Musk, but not that good for the taxpayers and utility customers in NY State. The following slide was also borrowed from the same report.
7 – An Energy “Shell Game” is Being Used to Make the New Micron Technology Facility Appear Greener than it Actually Will Be under CLCPA rules. However, it could be made far “Greener” in reality by siting a combined cycle generating plant next to the Micron Facility. Nuclear generation would be better still, but that would take far longer to build and would have much higher upfront costs.
The New Micron Technology Facility in Clay, NY will eventually use more energy than the state of Vermont. NY State and NYPA have said that they will provide 140 Megawatts of NY Hydro to the plant. For lack of a better word, that policy is a farce. All of the NY State Hydro has been allocated for years. If they allocate it to the Micron Facility, those customers that are currently using it will then effectively be using fossil fuels. They want Micron to use all renewable energy. From Where? A solar array that could generate enough energy to support that facility would occupy 100 square miles. They want Micron the buy Carbon Credits. From whom? NY State’s two largest neighbors to the south and west, Pennsylvania and Ohio, average 1.5% renewable energy. If NY State has to import energy from either of those states to support the Micron facility, it will all be from fossil fuel generation, gas or coal fired, at a lower efficiency than a combined cycle generator. The import of energy from long distances to the Micron Site will increase transmission line losses by approximately 350 Gigawatts compared with a generator on-site. The new rules are going to make the Micron facility less energy efficient, more polluting, and also increase Micron’s operational costs while imposing environmental costs on the state. Forcing Micron to buy Carbon Credits does nothing to help the environment. It literally papers over the problem while raising Micron’s costs and doing nothing tangible to reduce greenhouse gas emissions.
8 – Renewable Generation Installation Rates are Insufficient to Support NY State’s Plan
Even prior to many of the recent cancellations of renewable generation projects, NY State was not going to have enough renewable generation installed for about 60 years. Prior to the cancellations, NY State was going to be at least 120,000 Gigawatt hours short of what it would need to support the system on all renewables by 2035 as is shown in the slide below. With onsite fossil fuel combustion about to be banned in new building and replacement equipment banned after 2035, while EV’s are mandated for all sales after 2035, the system load is going to grow far more rapidly than the expansion of renewable generation resulting in an energy shortfall. Beyond the transmission issues facing the Atlantic Wind projects mentioned earlier, the Jones Act is going to slow the rate of installation for offshore wind by limiting the number of jack ships that will be available. While NY State is short on land, money, and grid capacity, the one thing that NY State has in abundance is lawyers so that any renewable project will be faced with years of NIMBY lawsuits and the resulting delays.
Just because California tried it that doesn’t mean that NY State should. California has a Mediterranean climate and is 20 degrees warmer in the winter so the orange and gray “energy blocks” in the fossil fuel column A on the chart below are much smaller. If NY State had the same climate as California, it would eliminate a need for about 150,000 Gigawatt hours of renewable generation on the future system. Keep in mind that California is having difficulty keeping the lights on without the albatross of onsite heating around their neck.
Four columns on the chart above are labeled A,B,C,D and are referred to in the conclusion.
“A” is the Existing Fossil Fuel Consumption in NY State. “B” is the Electric Load if all of that was converted to electric technologies on a fully GHG free generation system. “C” is 6 GW of 1000 hour storage as mentioned in the NY State Energy Storage report. Current cost using Lithium-Ion batteries, $3.4 Trillion. NY State is betting on technologies that don’t exist commercially yet and at present, have shorter lifespans than the 10 years of Lithium-Ion. “D” was the projected renewable installation for 2035 estimated in 2019 using figures provided by NY State. With solar projects being canceled, in 2023 that is an overly optimistic estimate.
Even if all of the existing fossil fuel generation remained static and no fossil fuel plants are closed, the additional load being mandated is going to outstrip the rate of renewable installation. As NY State is not allowed to build any new fossil fuel generation, one of two things will happen as a result of the energy shortfalls shown in the slide above. NY State citizens will be without lights and heat, or NY State will have to import large amounts of fossil fuel generation from out of state, just as California has had to do. When the neighboring states don’t have it available, NY State will have to impose rolling blackouts just as California now does, only the blackouts will occur on the coldest days of winter which will be far more deadly than the hot days during the California summer.
If Climate Change is truly the existential crisis that the authors of the CLCPA claim it to be, and if the recent UN report about the need to halve atmospheric carbon within 10 years is true, then NY State’s 60 – 70 year plan that is going to increase carbon emissions for at least the first 30 years needs some rethinking.
Keep in mind that NY States total GHG emissions are 350 million metric tons annually. Worldwide GHG emissions increased in 2021 by 2 billion metric tons, 40% of that from increased coal combustion in China, India, Germany, Japan, and other countries. So, the increase in worldwide GHG emissions in 2021 was six times NY State’s total annual emissions.
Because of the above fact, it is apparent that the rate of Climate Change is not in the purview of NY State policy makers. As resources are limited, instead of wasting money on building electrification that will yield no holistic improvements in GHG emissions, resources should be used to harden infrastructure against the inevitable negative effects of Climate Change, whether that is on grid infrastructure or flood mitigation. The most expensive and severe impacts of Sandy were on the underground infrastructure of NY City and along the Hudson River. Venice type barriers might be considered for under the Verrazano and the Triborough Bridges, however that will never happen if the state wastes $600 billion on an electrification plan with no positive upside.
A Better Plan –
The following, if executed properly could result in the energy chart, below, where the right hand column actually can supply NY State’s energy needs at a fraction of the cost of the current plan while also reducing fossil fuel energy use and the associated GHG emissions by 44%. However, people will have to allow techniques that don’t meet the current standard of ideological purity in NY State.
By eliminating the push to electrify buildings, the energy savings and carbon reductions will actually be greater than what the CLCPA will yield in practice. This alternative plan will need far less labor and storage resources. Existing resources can be allocated to grid infrastructure to support renewable installation and vehicle electrification. Vehicle electrification is the fastest way to improve GHG emissions. Eliminating storage requirements will reduce battery demand and costs, making EV’s cheaper.
All is not Doom and Gloom
What can be done to reduce GHG emissions considering the state’s lack of financial resources and the lack of sufficient renewable generation for at least seven decades? The following is a list of ten ideas that can be implemented relatively quickly that will help to rapidly lower GHG without breaking the piggy bank while also slowing or reversing the increase in utility bills
Do not electrify buildings that run on natural gas – while it will reduce GHG at the building, it will increase it as much at the generating plants while forcing residents and the utilities to incur enormous rewiring costs. There will be no reduction in current fossil fuel energy, Column A in the New York Fossil Fuel Energy Load figure. Also, the gas stove analysis that was done recently was mathematically flawed and should not be used to set public policy.
Focus heat pump efforts on locations that use oil heat or that use radiant electric heat. Those locations will see a significant reduction of GHG and heat pumps will reduce grid load when compared to radiant electric heat.
Focus resources on expanding grid infrastructure. This will reduce the cost of installing solar in Upstate locations and reduce the number of system cancellations allowing the state to increase the proposed renewable generating resources, Column D in the New York Fossil Fuel Energy Load figure.
Increasing grid infrastructure will also help with the installation of chargers for the electric vehicle wave that is about to arrive, with or without the state mandate.
Do not install large amounts of battery storage until there is sufficient renewable generation to support the storage. It will increase current fossil fuel energy (Column A in the New York Fossil Fuel Energy Load figure) while incurring an enormous capital outlay and starving other projects of funding. They will also decay well before sufficient renewable generation is installed.
Replace older generating plants with higher efficiency combined cycle natural gas generating plants. The state will need the energy to support the EV’s and the newer plants are far more efficient. It will lower Column A, reduce gas usage and put downward pressure on the commodity price.
Place an emphasis on hydrogen injection into natural gas combustion plants. It will decrease gas usage and increase combustion temperatures which reduces NOx emissions and lowers current fossil fuel energy, Column A. It will greatly lower GHG emissions related to those generating plants
Focus available natural gas resources on combined heat and power systems. It will reduce the utility bills for the system owners while also reducing requirements for grid infrastructure. Allow multiple building to form micro-grids to utilize the thermal output and increase the generation capacity. It will greatly reduce Column A
Allow Micron Technolgies to build a combined cycle plant the size of Cricket Valley Energy Center on their property. The Micron facility will use more energy than the state of Vermont. Instead of letting them be “green” on paper by buying carbon credits, let them be green in reality with high efficiency generation and have lower energy costs to make them more competitive and able to recoup the $5 billion rebate without faking it. That will eliminate the increase in column a related to the facility.
Figure out how the utilities can interconnect the 9 GW of offshore wind because at the moment, no one is certain how to do it. There is limited space for underwater cables. Without that, energy curtailments will occur and impede the increase of column d, unless they use the alternative idea which is to run transmission lines across Long Island.
Ellenbogen Conclusion
Ellenbogen Follow Up
The next day Ellenbogen followed up with another email with this warning.
In a speech to the British Parliament in 1948, Winston Churchill said, ‘Those who do not learn history are doomed to repeat it”.
As a conclusion to my email of yesterday, March 28, the following should serve as a warning to those proposing the current NY State Energy plan and expensive projects that are going to raise utility rates but do little for the environment.
The statement above by Churchill not only applies to NY State following Germany’s failed energy program. It also applies to something that happened just across Lake Ontario, much closer to home.
In 2009, Ontario, Canada passed the Green Energy Act. Ontario has a similar population distribution to NY State with large population centers to the south and more rural areas to the north. Hardships were incurred by the more rural areas in the building of renewable generation and sending the energy to the wealthier, more densely populated southern areas. In reading some articles on the subject, it was portrayed as a class war. The act might have survived that issue, except energy costs skyrocketed along with the perceived injustices and the combination led to the repeal of the Act after only 10 years. The Green Energy Act from 2009 is available here and an article documenting the repeal is here.
As I documented above, the state’s energy policies are going to cost trillions of dollars with far fewer carbon emission reductions than could otherwise be obtained at a far lower cost. Hundreds of square miles of solar arrays and wind farms are going to have to be built in rural areas that are already exhibiting a substantial resistance to the projects. The 2019 repeal of the act gave municipalities the right to control what energy projects could be built within their borders, just the opposite of NY State’s proposed legislation.
The quest for the perfect will be anything but and the inevitable voter rebellion that is going to occur in the not-too-distant future is going to leave the state with massive debt, extremely high utility costs, and little to no GHG reduction to show for it. In the interim, a decade will have passed where functional, inexpensive programs could be implemented that will actually reduce GHG in the real world, as opposed to the current program that only might work in Mark Zuckerberg’s fantasy Metaverse. It certainly hasn’t worked in any cold climate on Earth where it has been tried.
Utility customers are already feeling enormous amounts of pain. I have been receiving emails of late from politicians excoriating Con Ed for raising rates, however most of the increase is needed to comply with the mandates of the CLCPA. The increases are due to terrible policy and not utility rate gouging. As a clear example of how upside down this policy is, it actually has me defending Con Ed after they said some rather nasty things about me in a tariff hearing 12 years ago. I have a long memory and no love for Con Ed but this energy policy is going to end up turning the state’s utilities into piñatas through no fault of their own.
The utility rate increases are going to be far worse going forward as the costs documented in my email of yesterday are not figments of my imagination. The plan will not be sustainable. The state can’t borrow its way out of trillions of dollars of costs in an effort to subsidize utility rate payers to ease the pain that will be caused by this.
Beyond the actual costs, there is going to be a huge opportunity cost in terms of lost time imposed by the CLCPA that prevents working solutions from being executed, along with a souring of popular attitudes towards any future programs to reduce GHG.
In their overreach for an unrealistic fantasy, they are going to achieve nothing. Unfortunately, as bad as that is, that situation will be the best-case scenario. The worst-case scenario will be that they continue to push forward, ignoring utility customers pain, still achieving no GHG reductions, while creating energy shortages that result in loss of life.
The current energy policy has no long-term positive outcomes.
Caiazza Concluded Remarks
I could quibble with a few numbers and my take is slightly different for a few aspects but I am in complete agreement that this cannot possibly work. The biggest flaw in the Hochul Administration’s net-zero transition plan is the lack of a feasibility analysis. In 2018 I wrote the following.
We’re choosing between as yet undefined but surely expensive options trying to understand which one (or what mix) will be the least expensive. Unfortunately we don’t know but we need to start now because we’ve been told that we have to make reductions by 2030. If we make a good pick then we’ll spend the least amount of a lot of money and will be left with the fewest negative outcomes, but if we get it wrong, we will be left with many more negative outcomes and even higher costs for a long time.
Since then, the only thing I would change is that it is not just about the money, the possibility of catastrophic reliability outcomes must be considered because present wind, solar, and energy storage technology must be coupled with other ill-defined and speculative resources in order to work reliably. Clearly the first step and priority should be a feasibility analysis before anymore time and money is spent on this.
This blog post highlights an article and report that address New York’s Climate Leadership & Community Protection Act (Climate Act). I am highlighting them here because they make good points in ways that I think clearly show the futility of the Climate Act.
I submitted comments on the Climate Act implementation plan and have written over 300 articles about New York’s net-zero transition because I believe the ambitions for a zero-emissions economy embodied in the Climate Act outstrip available renewable technology such that the net-zero transition will do more harm than good. The opinions expressed in this post do not reflect the position of any of my previous employers or any other company I have been associated with, these comments are mine alone.
Climate Act Background
The Climate Act established a New York “Net Zero” target (85% reduction and 15% offset of emissions) by 2050. The Climate Action Council is responsible for preparing the Scoping Plan that outlines how to “achieve the State’s bold clean energy and climate agenda.” In brief, that plan is to electrify everything possible and power the electric gride with zero-emissions generating resources by 2040. The Integration Analysis prepared by the New York State Energy Research and Development Authority (NYSERDA) and its consultants quantifies the impact of the electrification strategies. That material was used to write a Draft Scoping Plan. After a year-long review the Scoping Plan recommendations were finalized at the end of 2022. In 2023 the Scoping Plan recommendations are supposed to be implemented through regulation and legislation.
Francis Menton writing at the Manhattan Contrarian blog wrote an excellent story about New York’s budget proposals that includes a section on energy policy. He described the Empire Center’s just released Next New York report that offers “counter-proposals in the major policy areas: public safety, K-12 education, Medicaid and healthcare, energy, transportation and transit, housing, and so forth”.
Menton’s article addressed energy policy. The energy section of the Next New York report, titled “Heading off New York’s Home-Made Energy Crisis,” begins at page 69, and was written by the Empire Center’s energy guru, James Hanley. The following is a direct quote from the Menton’s article :
I guess it’s fair to say at this point that we do have an “energy crisis” in New York, but the key word is “home-made.” Everything about energy in New York that could remotely be called a “crisis” is entirely the creation of our politicians. There is no rational reason why energy policy should even be a significant political issue in New York. We have a perfectly good, functional energy system. By far the larger part of it — the non-electrified part, including nearly all transportation, industry, agriculture, and home heat outside the large cities — came into being through private initiative and works with little to no input or interference from politicians and bureaucrats. The other, smaller part — the electrified portion plus urban natural gas distribution — has historically been subject to substantial government regulation, but until quite recently the whole point of the regulation was only to prevent the monopoly utilities from raising their rates to a point of overcharging the customers.
Then our politicians got the idea that there was an imperative to address and solve “climate change” through the device of a politically-directed total re-do of the energy system into something that has never previously been tried nor proven to work. (Don’t get me started on the question of how a place like New York, with a fraction of 1% of world greenhouse gas emissions, is supposed to be able to affect “climate change” by using less fossil fuels, when the places that emit the large majority of world GHGs, like China and India, are adding new coal power plants as fast as they can build them.).
At pages 69-75 of the Report, Hanley provides a brief history of how this subject of reducing GHG emissions got a toe-hold in New York and then rapidly metastasized. Governors Pataki and Paterson began the game in the 90s and 00s, with things like a “renewable portfolio standard” and joining the Regional Greenhouse Gas Initiative (2005). Andrew Cuomo (first elected Governor in 2010) ramped things up by blocking fracking in the extensive Marcellus Shale that underlies a large part of the state, and by having his environmental bureaucrats block natural gas pipelines on bogus “water quality” concerns. But the full suppression of fossil fuels and the wind/solar mania did not really take full control in New York until 2019, when the progressive Democrats finally took both houses of the State Legislature. They used that control to pass something called the Climate Leadership and Community Protection Act (CLCPA), which was then signed by Cuomo. Suddenly, we are on a crash program to get rid of all fossil fuels, electrify everything, and depend completely on the wind and sun for the generation of our energy. Hanley:
The CLCPA’s overarching goal is an 85 percent reduction in greenhouse gas emissions and a net-zero state economy by 2050. Intermediate steps on the way include 6,000 megawatts of installed solar and 185 trillion BTU savings in energy efficiency by 2025, 70 percent renewable energy production and 3,000 megawatts of battery storage by 2030, 9,000 megawatts of offshore wind production by 2035 and 100 percent zero-emissions electricity production by 2040.
I believe that I have used terms like “ridiculous,” “preposterous,” “incompetent,” and “irresponsible” to characterize the legally-mandated goals to which the CLCPA commits our state. Hanley is much more gentle in his use of words:
To say the CLCPA’s goals are ambitious is an understatement, and yet they will not be adequate to provide the state with sufficient clean energy to ensure the continuing reliability of the electrical grid. One place where Hanley makes a real contribution to the debate is by producing a chart, based on data from the federal Energy Information Administration and Department of Energy, that makes the absurdity of the CLCPA goals apparent:
In the eleven years from 2010 to 2020, the percent of New York’s electricity coming from “renewables” inched up from about 22% to about 28%. But most of that 6% increase came from that blue line, “hydro,” aka almost entirely the Niagara Falls power plant, going from about 18% to about 22% of state electricity production. Meanwhile, in that 11 year period when everyone was starting to obsess about wind and solar and federal subsidies ramped up dramatically, the percent of electricity from wind (the orange line near the bottom of the graph) went all the way from about 2% to about 4%. And the percent from solar remained a barely-perceptible 1% or so, represented by a gray line that is so close to the x-axis of the graph that you can barely see it next to the brown line representing wood.
And then supposedly the percent of electricity from renewables takes off like the blade of a hockey stick in 2020 and gets to 70% by 2030. Unmentioned is that we don’t have another Niagara Falls. Therefore this whole increase now has to come from wind and solar. Oh, and we’re already two years in since the data in Hanley’s graph. How much of this has happened so far? Almost none.
Meanwhile the consumption of electricity is supposedly going to double or so, due to the electrification of automobiles and home heating.
I’ll throw in a few figures from research of my own to further illustrate the absurdity. According to EIA data here, New York’s electricity consumption in 2021 was 141,423,778 MWh. If that doubles from electrification of automobiles and heating, then we’ll need about 280 million MWh in a year. Per Hanley’s summary of the CLCPA above, the state authorities are calling for adding 6000 MW of solar and 9000 MW of offshore wind by 2035. At highly optimistic capacity factors of 25% for solar and 40% for wind, here’s what that will get you:
6000 x 0.25 x 8760 + 9000 x 0.40 x 8760 = 44,676,000 MWh
In other words, as ambitious as the plans for wind and solar may be, even if all gets built this will provide less than a sixth of the electricity that will be needed. And with wind and solar generation, such electricity as gets generated will come at random times that could include long weeks of no wind and almost no sun in the dead of winter.
But meanwhile they are proceeding apace to shut down the existing natural gas capacity.
Hanley concludes his section of the Report with a series of highly sensible recommendations, like ending the fracking ban, ending the pipeline moratorium, and scaling back renewable energy subsidies and tax credits. I actually think we will likely be better off going full speed ahead on the innumerate nonsense and running hard into the green energy wall.
Conclusion
The demand that we do something as quickly as possible does not square with reality. New York GHG emissions are less than one half a percent of global GHG emissions and global GHG emissions have been increasing by more than one half a percent per year. Anything we do will be replaced by global GHG emission increases in less than a year. That does not mean that we should not do something but it does mean that we should take the time to do “something” that it does not do more harm than good. Menton and Hanley show that the proposed implementation timeframe is extraordinarily risky and unlikely. Their concerns must be addressed or the reliability and affordability of New York electricity will be unacceptably at risk.
The demand for compliance certainty inherent in the cap and invest proposed plan exacerbates the risks and impacts. In my last post on the cap and invest program proposal I noted that developing sufficient zero-emissions renewable energy to displace enough fossil-fired electric generation to meet the mandated emissions targets would be a challenge. Both Hanley and Menton clearly show that the expectation that New York State can convert the electric energy system to meet the 2030 goal of 70% renewable energy is a dream and that meeting the emissions targets is a stretch. Of particular concern is that the cap and invest approach includes penalties when those targets are not met. Affected sources are going to err on the side of caution relative to their compliance obligations. These results and that outlook increase the chance of an artificial energy shortage.